Mouseflow is introducing Live Heatmaps
The Grandfather of modern business management, Peter Drucker, famously stated that:
“If you can’t measure it, you can’t improve it.”
But measurements are only as good as the insights you can derive from them. Our new Live heatmaps will help you gain those insights faster and with more accuracy than ever before.
Going Live!
Mouseflow has always been one of the front runners of web analytics and, by extension online heatmap technology. We find that heatmaps are a great way to gain insights into complex data at a glance. We are therefore excited and extremely proud to present our newest feature – Live Heatmaps!
Video-intro: What are Live Heatmaps
The Future of Data Driven Web Development
If you work with websites, whether you are a UX designer, Marketing Professional, Digital Analyst or Product Owner, you know the value of insights based on user data – because you never actually meet your customers. However, you still need to understand their customer journey.
A heatmap can save you countless hours of work and frustration by combining the steps of measuring user interactions and converting these measurements into insights. They essentially allow you see through all the data and easily spot the underlying trends – but without having to crunch numbers or compare metrics. A heatmap will allow you to gather reliable insights into how you can improve your site and boost your conversions – by simply looking at it.
“a heat map shows you where people interact with your website.”
However, because traditional heatmaps are mostly static pictures of what is often a dynamic page, they come with a number of limitations. Here at Mouseflow, we don’t like limitations, so we’ve come up with a solution.
- Check out Live Heatmaps now!
- Learn all about how Heatmaps can improve your Conversion Rate and your business.
Fully Dynamic and Customizable
There are quite a few ways in which Live Heatmaps are superior to regular Static Heatmaps. to give you an easy overview of how the different heatmaps compare, we have prepared the matrix you can see below.
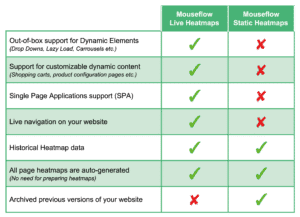
Perhaps the two greatest improvements in Live Heatmaps are that they support most dynamic elements – and that you can easily customize the heatmap view by for example adding more products to the cart, or toggling filters on your live site. This makes them the ideal tool when:
1. Seeking insights into the performance of Dynamic elements
Because Live Heatmaps work as an overlay on your live website they offer complete support for dynamic elements (such as Single Page Applications (SPA), Lazy Load, Drop Down Menus, Revolutions Sliders, Parallax Scrolling and other dynamic technologies). This means that using Live Heatmaps you can now view all the dynamic content that can’t be displayed on traditional static heatmaps.
2. Investigating the effect of Dynamic Content (Carts, filters, drop down menus, etc.)
Changing the content on your live site (eg. by adding products to a cart or checkout page) will update the data you see in the heatmap to reflect the content on the page.
This makes Live Heatmaps fully customizable, allowing you to navigate through your site as if you were testing the functionality – but you’ll have the data from hundreds, or even thousands, of users, “follow you” as you go.
You can place 100 items in your cart and see how the heatmap conforms to this – how far down the page does the average user scroll? Does the ‘Next’ button disappear below the fold? Or you can filter for a specific category of products on your product page and see exactly where users are clicking or where their attention is focussed.
3. Arguing for design change
Heatmaps as an argument become even more relevant when you can show stakeholders the heatmap data and insights – directly on your live site.
Get started for free:
- Try out live heat maps
- Check out our knowledge base to learn more about the differences between dynamic and static heatmaps