Trusted by 190,000+ digital experience frontrunners worldwide
Mouseflow Website heatmaps
Get insights that deliver results

6 types of heatmaps
Click heatmaps
Visualize engagement with elements. Get a detailed overview of interactions.

6 types of heatmaps
Movement heatmaps
Get a granular overview of what grabs the visitors’ attention on your site.

6 types of heatmaps
Scroll heatmaps
Figure out how much content they get to see.

6 types of heatmaps
Attention heatmaps
Know what your visitors notice and care about.

Six types of heatmaps
Live Heatmaps
Assess the performance of dynamic elements like drop-down menus, carousels, filters, and etc.

6 types of heatmaps
Geo heatmaps
Verify the location of your audience and see how user behavior changes with the region.


Faster insights with Friction Score
Focus on most impactful improvements
Thousands of users, hundreds of pages, months of data — where do you start? With your website heatmap tool’s Friction Score.
Rely on automatic Friction Scores to call out the least satisfied users. Then, dive in and analyze the heatmaps with the most impact.
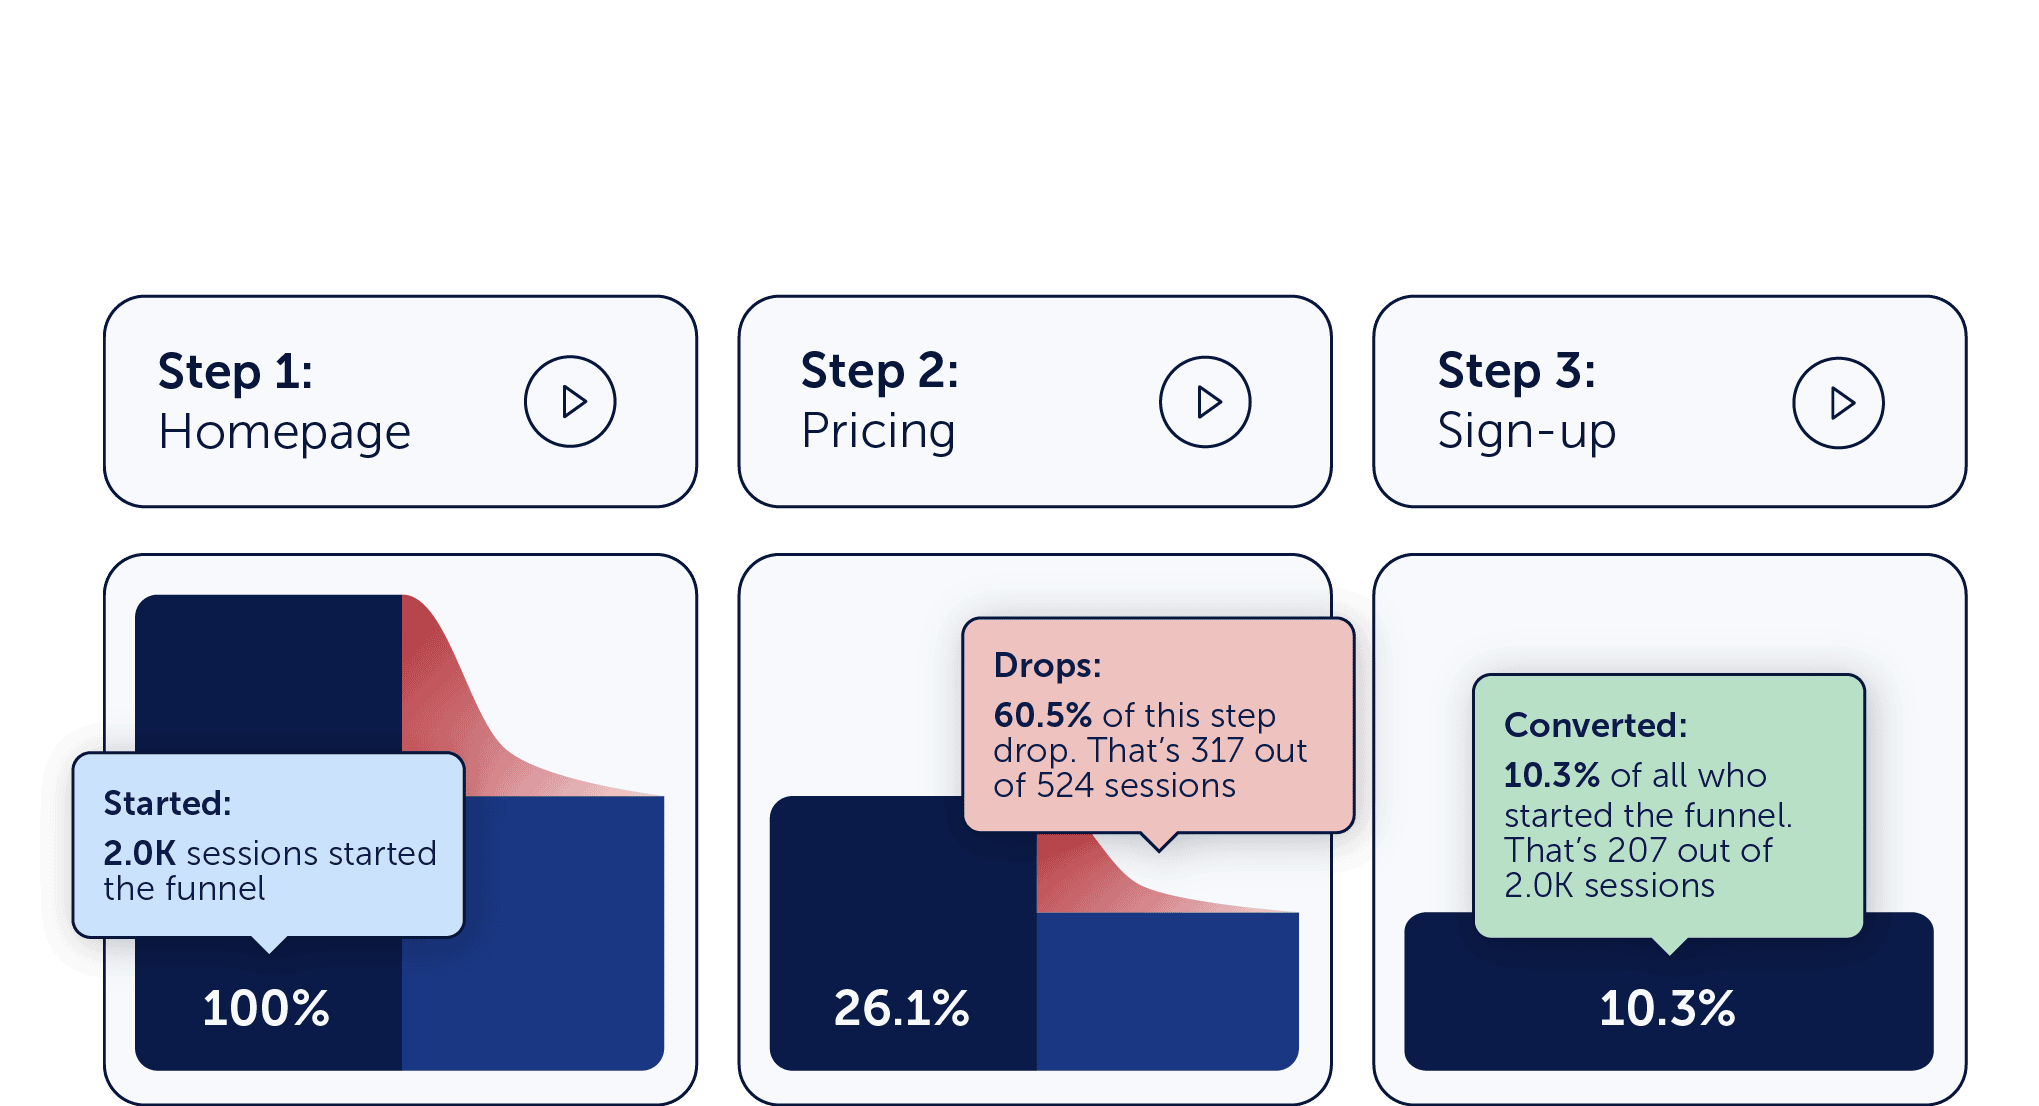
Go beyond a page
See how each page impacts the user journey
Build conversation funnels and see how a particular page affects the user journey in a conversion funnel. Understand at what point users change their minds and don’t take expected actions.
Watch session recordings of people who didn’t complete the journey and get insights on what impacted them.

“We operate in multiple markets globally, so it was important to find a behavioral analytics solution that allowed us to see and understand our website user behavior without compromising privacy and security.”
M
Marek Rynski
Product Owner Bosch Siemens
Want to see more?
Get your personalized 30-min demo!