








For better UX & Web Experience

The UX Analytics Tool for Smarter Tracking and Better Design

With Mouseflow’s UX tracking, your team sees what worked, what failed, and why – so you can fix fast and design smart.
Book a Demo Create free Account
No credit card required
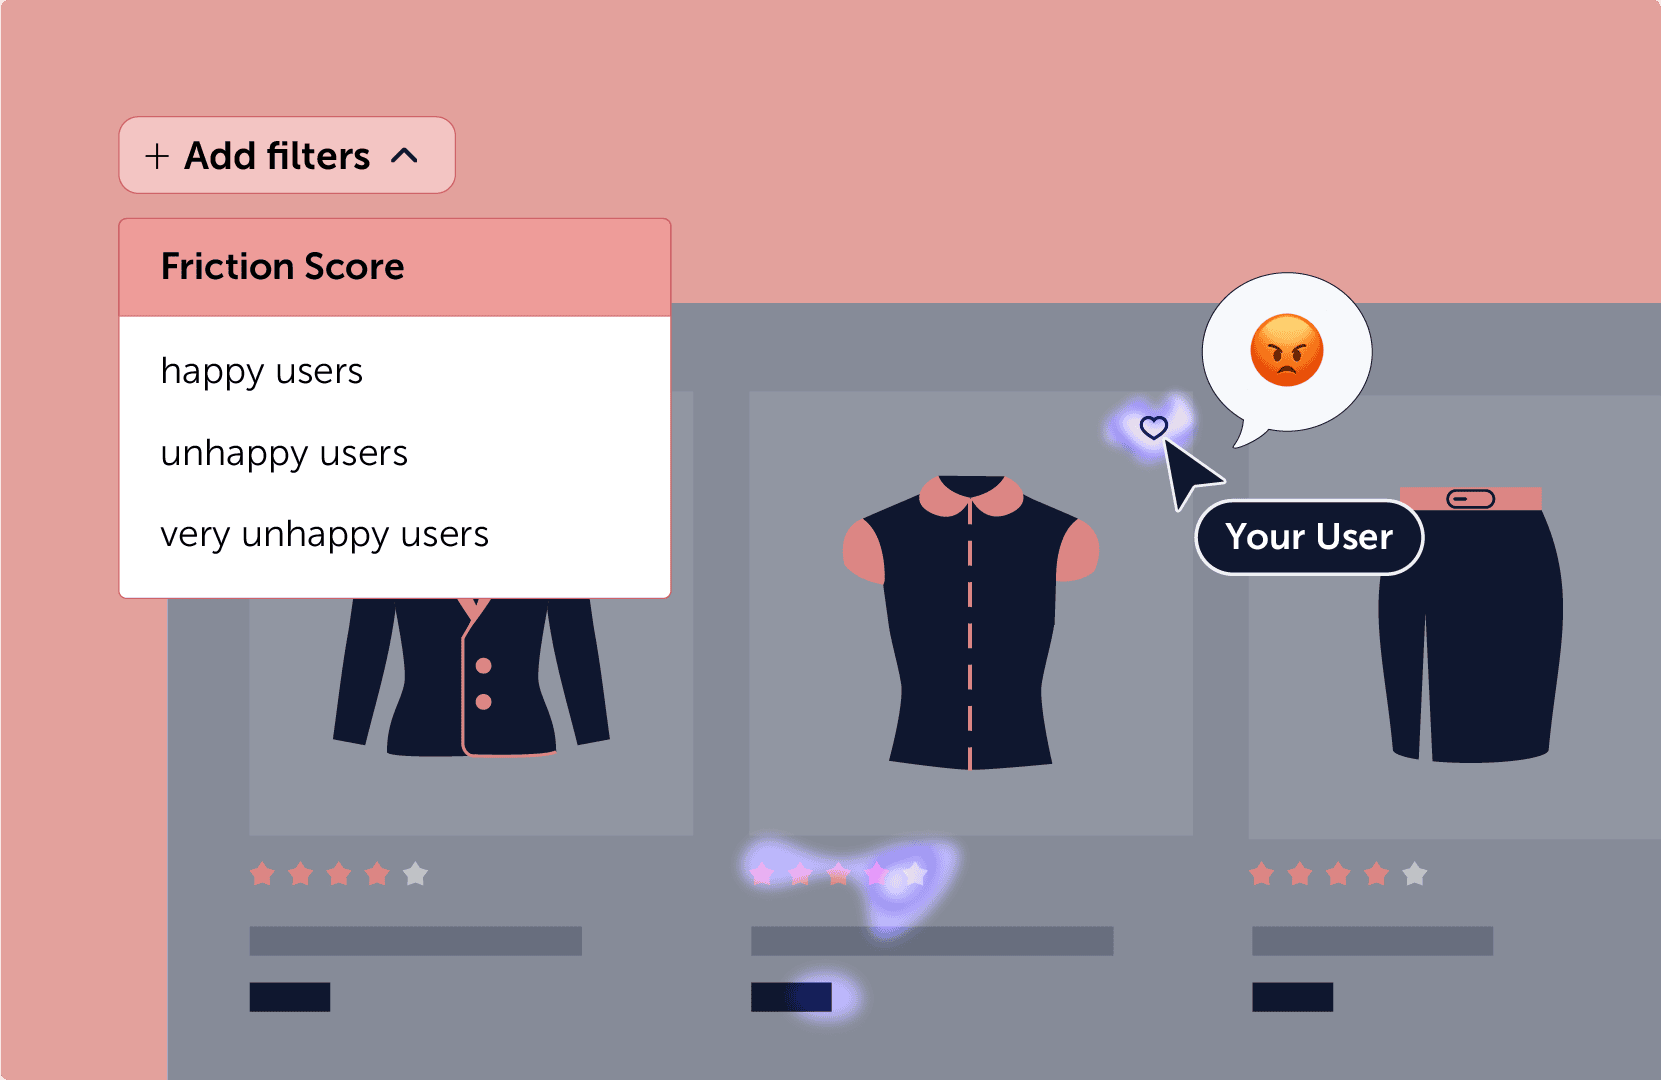
A clothing grid with a visible heatmap and a filter dropdown labeled ‘Friction Score’, letting users sort by happy, unhappy, or very unhappy users. An angry emoji icon highlights user frustration at a favorite icon.

88% of users won’t return after a frustrating UX

Heatmaps pinpoint confusion, frustration, and broken flows before they cost you users.
Website Heatmaps88% of users won’t return after a frustrating UX

3x faster issue detection for UX teams

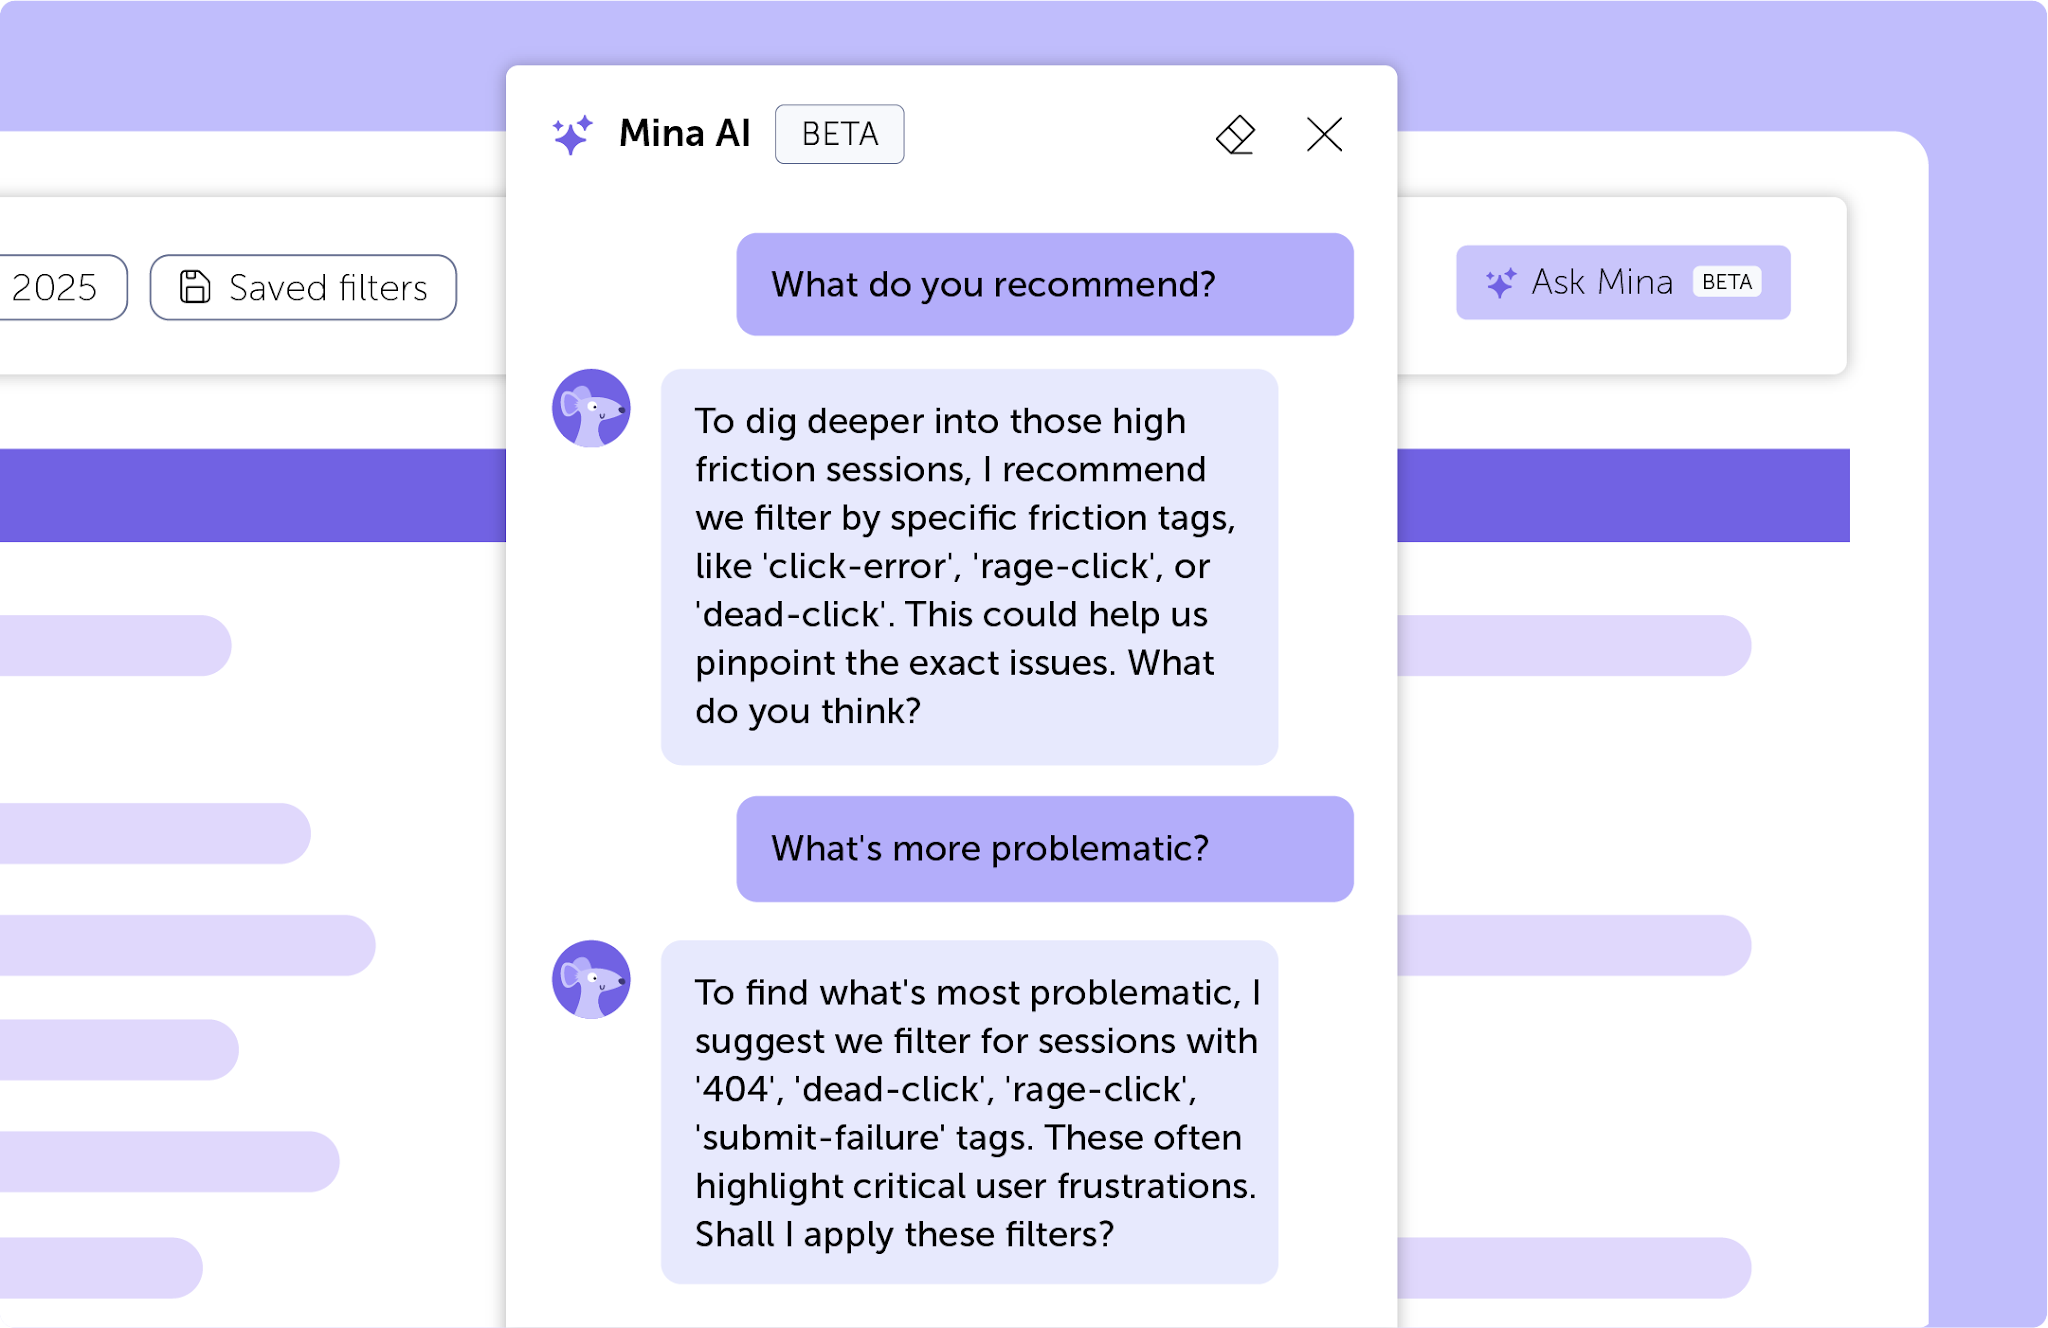
Session Replays and Heatmaps are key UX tracking tools that helps you see what usability tests miss.
Session Replay3x faster issue detection for UX teams

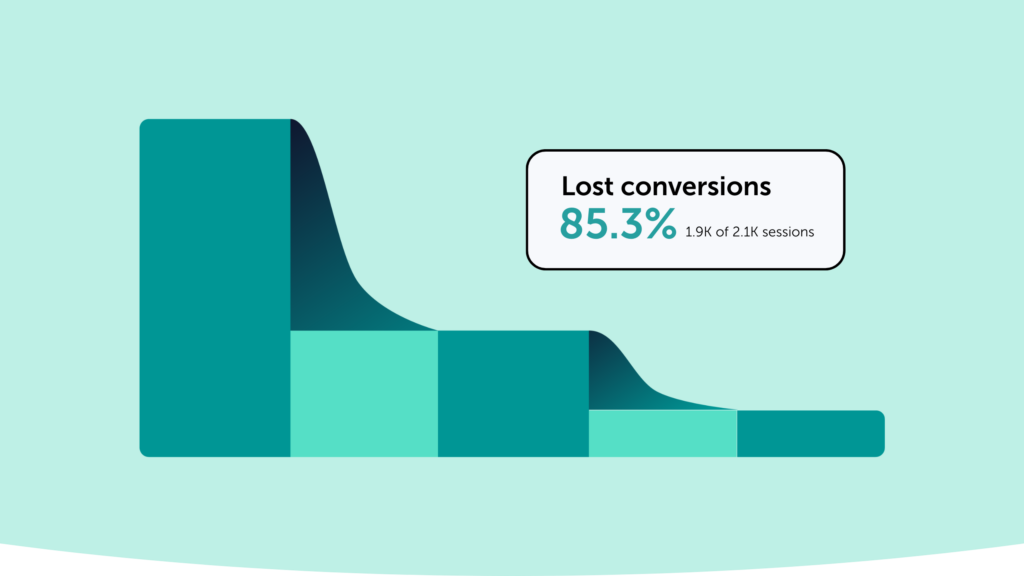
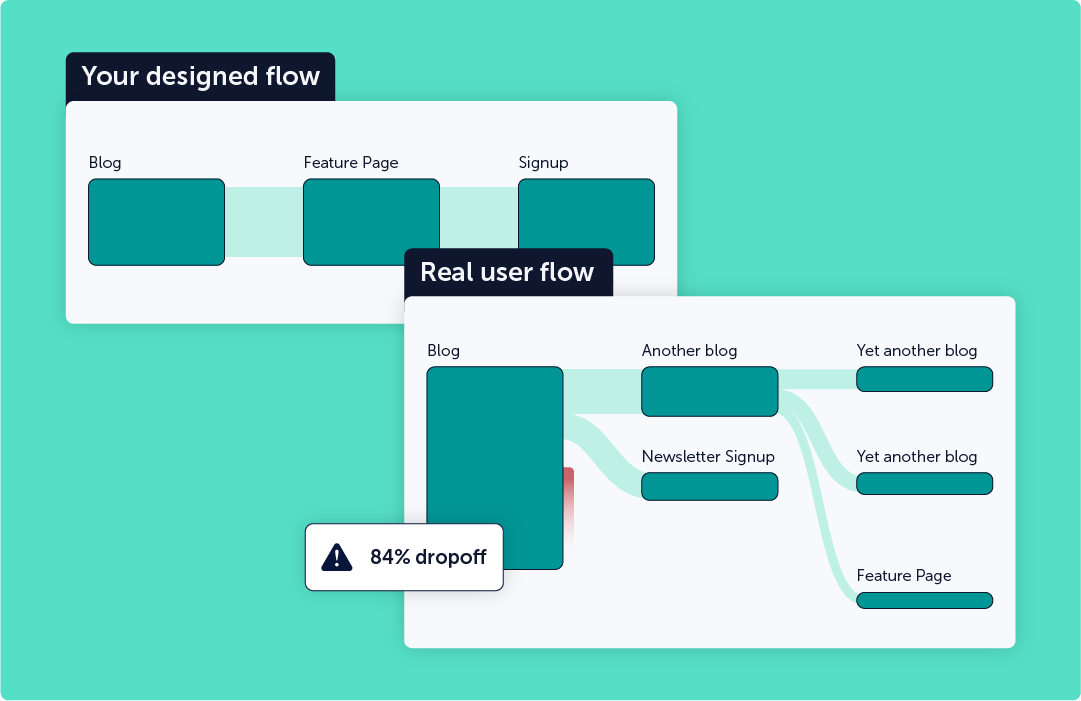
Up to 70% of users drop off before reaching the CTA

Journey Analytics shows where users drop off, so you stop wasting spend and start fixing what’s broken.


Journey AnalyticsUp to 70% of users drop off before reaching the CTA

The Lovable UX Checklist

This guide helps teams move beyond surface-level metrics and understand what users actually experience on their website.