Finding the best FullStory alternative can be a daunting task, especially if you are assessing options as a first-time user. So, how do you evaluate what’s the best tool for you and your business? You search and land in an article like this one – with the nagging feeling that anything you read is inherently biased. Yet, I’m here to help you get to the bottom of it while remaining as agnostic as possible.
TL;DR: Mouseflow vs Fullstory
- Ease of Use: Mouseflow is intuitive and easy to use out of the box (great for non-technical teams), ideal for marketers, UX designers, and CROs. FullStory is powerful but demands a steep learning curve and technical resources.
- Approach: FullStory uses auto-capture for deep, searchable analytics, powerful, but complex. Mouseflow captures every interaction too, but simplifies access through intuitive, user-friendly features.
- Heatmaps: FullStory offers 3 heatmaps that require setup and segmentation. Mouseflow auto-generates 7 heatmaps (click, scroll, attention, geo, etc.) with standalone access and dynamic filtering.
- Session Replay: Both platforms provide high-quality session recordings. Mouseflow adds a visual “waterfall view” of page interactions while FullStory integrates DevTools but requires segment setup before viewing.
- Friction Detection: FullStory ties friction to revenue (Enterprise plans only). Mouseflow’s Friction Score tracks 7+ signals, available across all plans, with a full Friction Insights dashboard.
- User Feedback: Mouseflow includes built-in survey tools to gather qualitative insights which can be triggerable by behavior like rage clicks or form abandonment. FullStory requires 3rd-party integrations.
- Pricing: FullStory starts around $20K/year, no monthly plans. Mouseflow is transparent, starting at $39/month.
- AI: FullStory has StoryAI to summarize sessions. Mouseflow supports external AI via API.
- Best for: Mouseflow is ideal for SMBs and mid-market teams/businesses looking for quick insights without heavy tech investment that are privacy and security conscious. FullStory fits best with large enterprises and teams with deep technical know-how
Quick Overview Comparison
Here is a quick side-by-side comparison that lays out the key features of Mouseflow and FullStory at a glance. From ease of use and pricing to heatmaps, session recordings, and advanced capabilities, here’s how the two platforms stack up, so you can quickly identify which one fits your needs best.
| Feature | Mouseflow | Fullstory |
|---|---|---|
| Session Recording | Comprehensive, easy-to-filter, Full HD copy of HTML | Detailed, high-definition |
| Heatmaps | Automatically generated (7) Click, Scroll, Attention, Movement, Interactive, Geo, Friction heatmaps | Snapshot-like (3) Click, Scroll, Movement heatmaps |
| User journey mapping | Yes, with page grouping | Yes |
| US and EU data centers (GDPR, CCPA) | Yes | Yes |
| Funnels | Robust & easy-to-configure | Advanced, detailed analysis |
| Friction Score | Yes | No |
| Friction Events | Rage clicks, dead clicks, click errors (Javascript errors), 404 errors, bounces, mouse out, speed browsing, custom friction | Rage clicks, dead clicks, error clicks, thrashed cursor, refreshed pages |
| Form Analytics | Yes | No |
| User Feedback | Built-in feedback tools | Integrations required |
| Revenue Tracking | Through tags and variables | Native |
| Retention | No | Yes |
| Integrations | Extensive and easy-to-use | Extensive and highly technical |
| Pricing | Affordable, scalable | Premium pricing, enterprise-focused |
| Ease of Use | User-friendly | Complex, steep learning curve |
| Filters | Extensive, user-friendly | Comprehensive, highly technical |
Feature-by-feature Comparison
Mouseflow and Fullstory both offer valuable insights into user interactions, but they cater to slightly different audiences. Mouseflow focuses heavily on usability and accessibility for small to mid-sized businesses, whereas Fullstory offers deep analytics for large enterprises with extensive technical capabilities. We’ll break down their main features to offer you an unbiased view to help you make the best decision.
User Journey Mapping
| Feature | Mouseflow | Fullstory |
|---|---|---|
| User journey mapping | Yes | Yes |
| Page grouping | Select the pages from dropdown | RegEx |
| Group by properties | N/A | Yes |
| Event-based journey steps | N/A | Yes |
| Focus step | Yes | N/A |
| Watch sessions from Journey steps | Yes | Yes |
| Visualize heatmaps from Journey steps | Yes | N/A |
| Plans available | Business, Pro and Enterprise | Enterprise and Advanced plans |
Journey mapping is a key feature when comparing behavior analytics tools. Both FullStory and Mouseflow offer this feature, but getting access to it will require that you purchase a specific plan.
💡 With Mouseflow, you can use the 14-day, full-featured, free trial to test drive this feature. Whereas with FullStory you won’t get access to it during this period. You’ll need at least a Business plan in Mouseflow to access Journeys (219/month when paid annually)
Feature-wise, both are excellent solutions to glean insights from your visitors behavior. Yet, there are some nuances to consider:
- With Mouseflow, you get to pick a focus page to build your journey around, which lets you explore the paths users took before and after that step. FullStory lets you define journey steps using events, either a single event or both a start and end point, which adds flexibility, though it may require more setup depending on the analysis you’re aiming for.
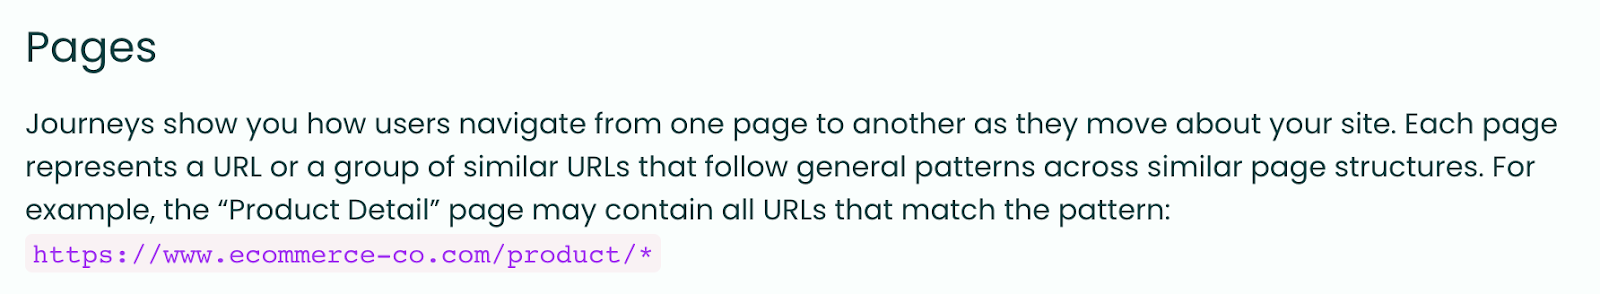
- Page grouping is a key feature when it comes to Journey mapping. This feature comes in handy when you have theme pages, like comparison pages or PDPs, where each page is not as important as emerging the behavioral patterns of navigation. Both FullStory and Mouseflow offer page grouping, with the difference that Mouseflow’s page grouping is intuitive to use, and FullStory does require some basic RegEx skills.
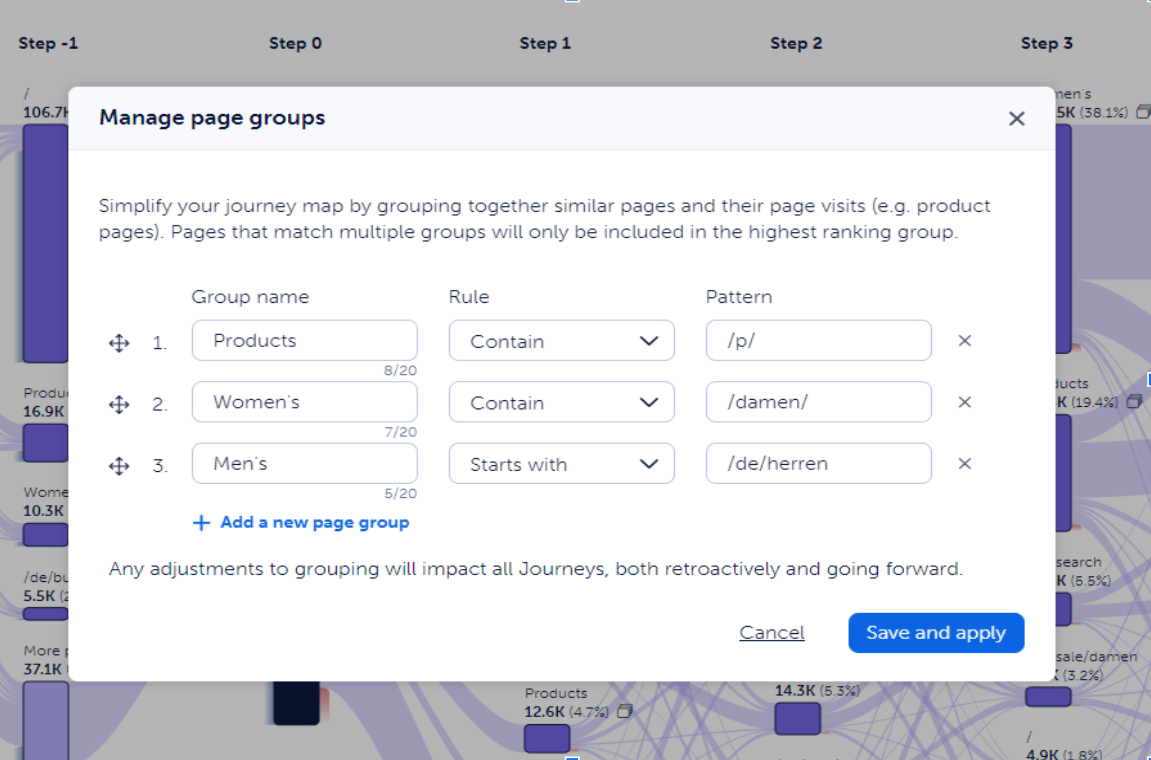
- With Fullstory, you’ll have the opportunity to build Journeys based on events and click/ watched elements. This is especially useful to understand specific interactions between journey steps. For example, what was the journey taken by a user who experienced consecutive friction events.
Friction Detection
| Fullstory | Mouseflow | |
|---|---|---|
| Friction Score or Frustration Score | Frustration Score | Friction Score |
| Friction events | Rage clicks, Error clicks, Dead clicks, Thrashed cursor | Click-rage, click-error, bounce, mouse-out, speed-browsing, submit-failure, 404-errors custom-friction |
| Friction insights dashboard | Not available | Add-on, included in Enterprise |
| Friction heatmap | Not available | Add-on, included in Enterprise |
| Plan available | Available on all plans at no extra cost | Available on all plans at no extra cost |
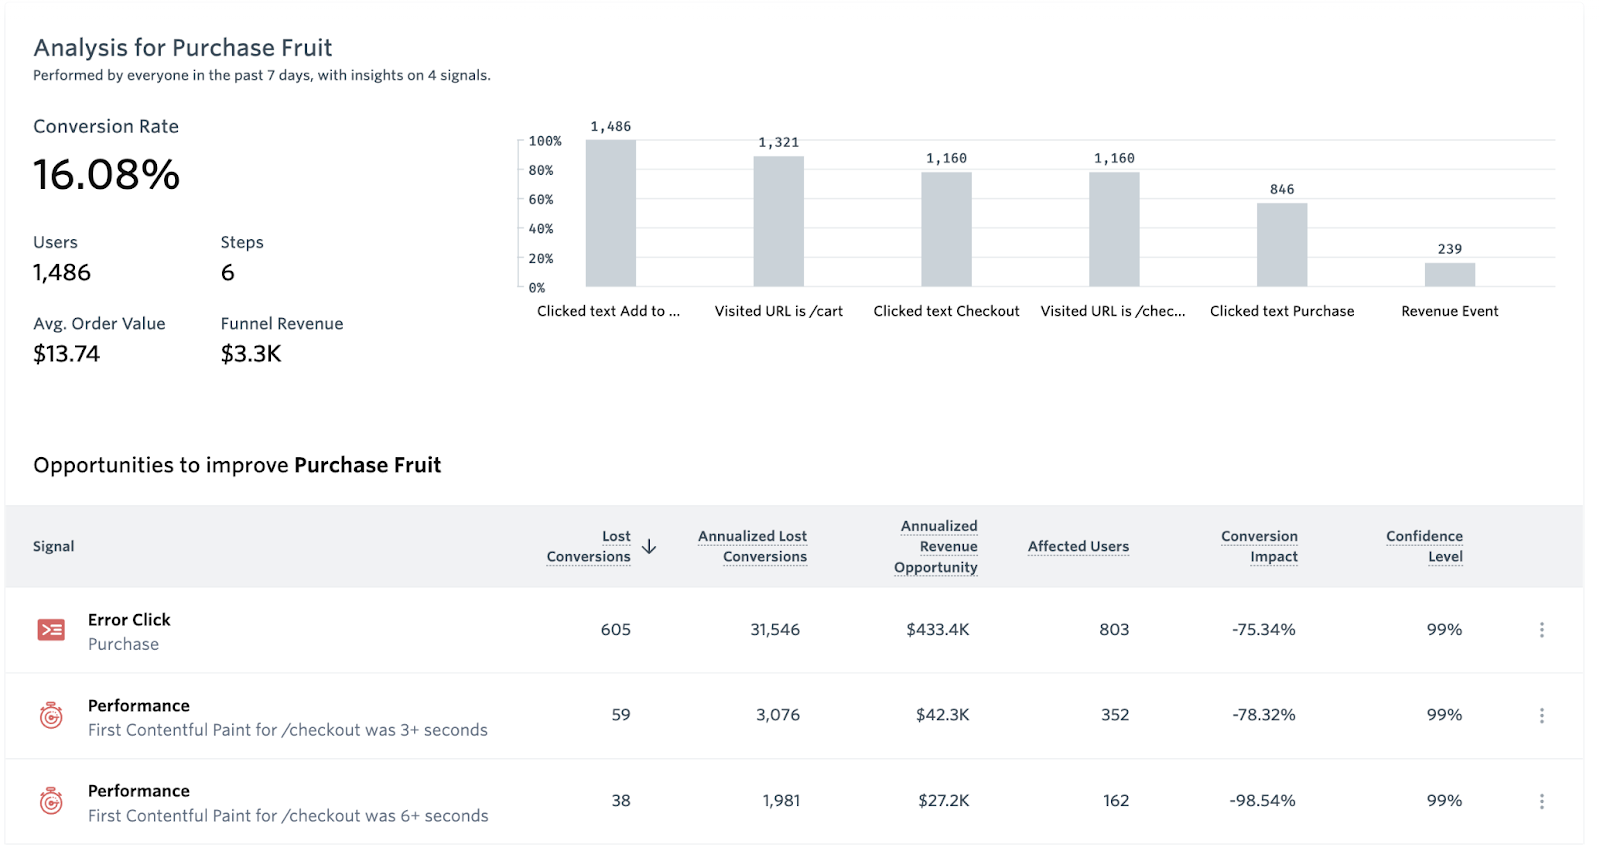
When it comes to Friction Detection, both Mouseflow and FullStory have their own way of measuring sessions where the experience went sideways. One of the differences is that Mouseflow’s Friction Score (based on 7+ friction events) is far more comprehensive than FullStory’s Frustration Score (based on 4 friction events), and that FullStory can correlate friction to revenue “in-the-box”.
However, the revenue opportunity feature in FullStory is reserved for Advanced and Enterprise plans ($$$). On the other hand, you can leverage Mouseflow’s APIs to build models based on friction events or any other interaction to conduct revenue modeling (Growth plan and above).
Another substantial difference when it comes to visualizing friction or frustration between the two platforms is that Mouseflow offers a dedicated Friction Insights Dashboard that surfaces friction impact across your website project.
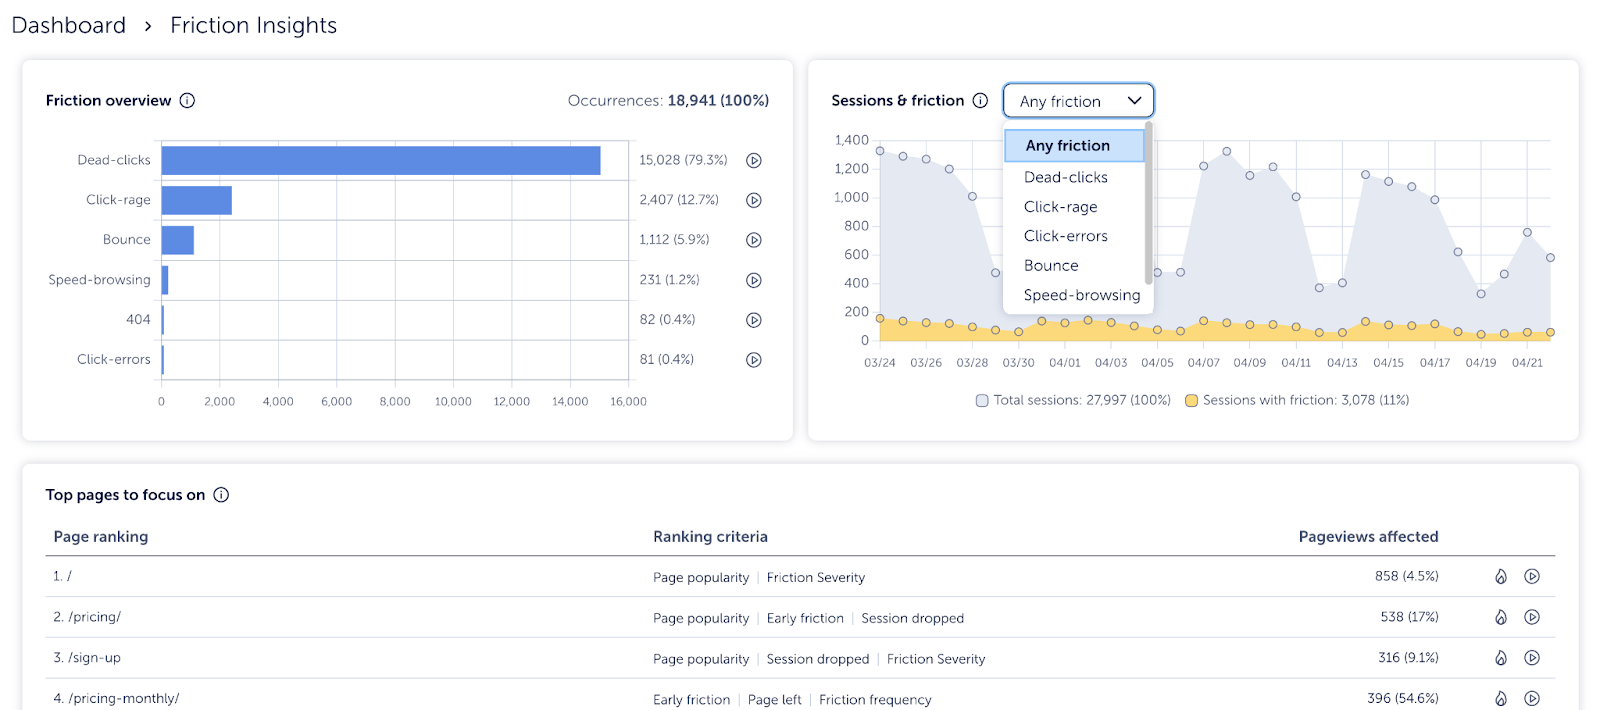
You can quickly access recordings and heatmaps for these occurrences, making it easy to see exactly how these events deter your users from having a great user experience. You can also visualize a trend of the friction events to show stakeholders improvements over time and justify your time and work.
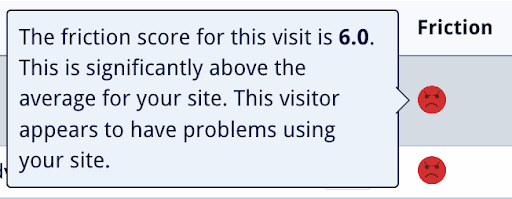
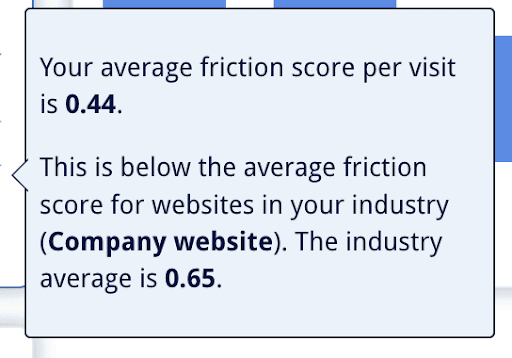
With Mouseflow’s Friction Score, you can easily filter behavior based on their level of satisfaction, and industry-specific benchmarks for your user experience. This can help you inform your improvement and progress towards a perfect customer experience.
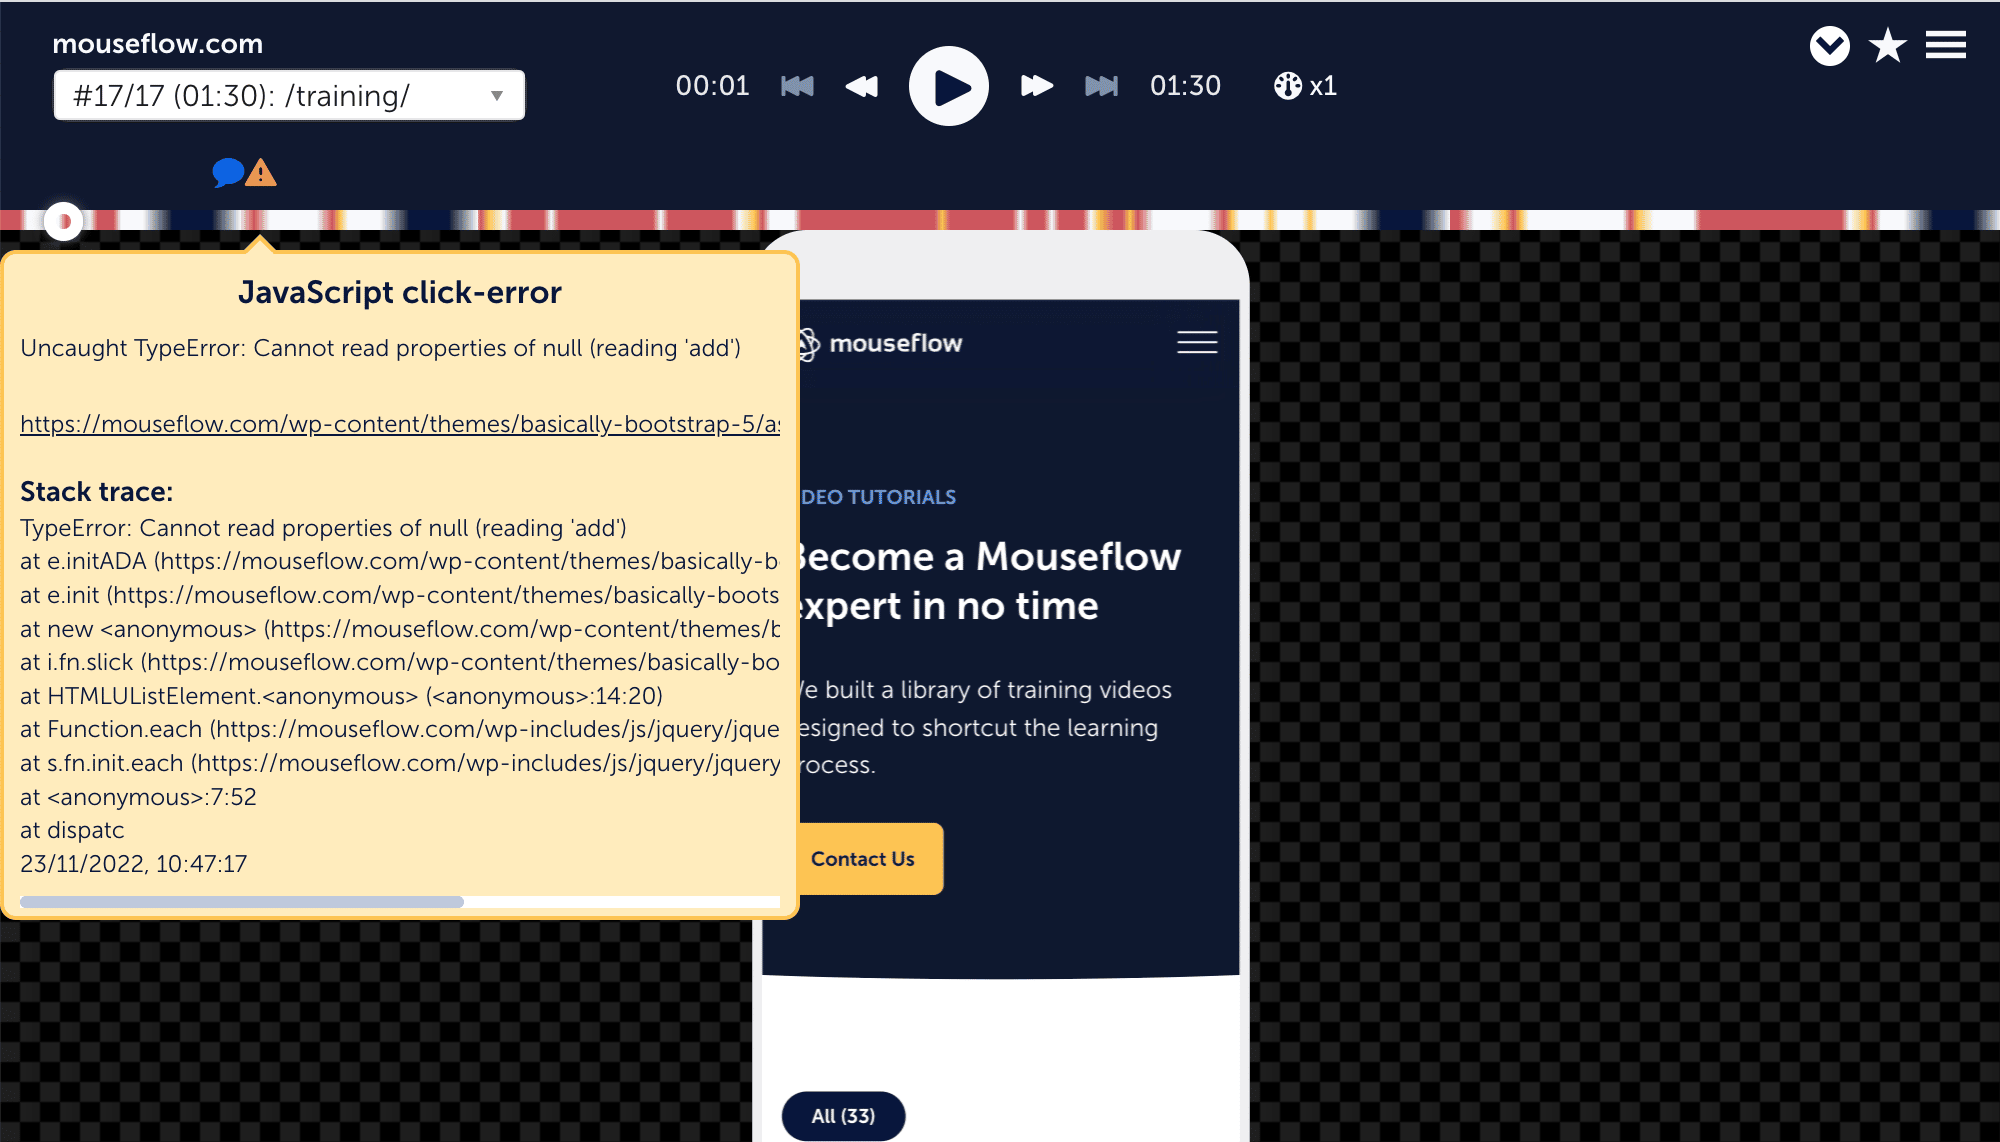
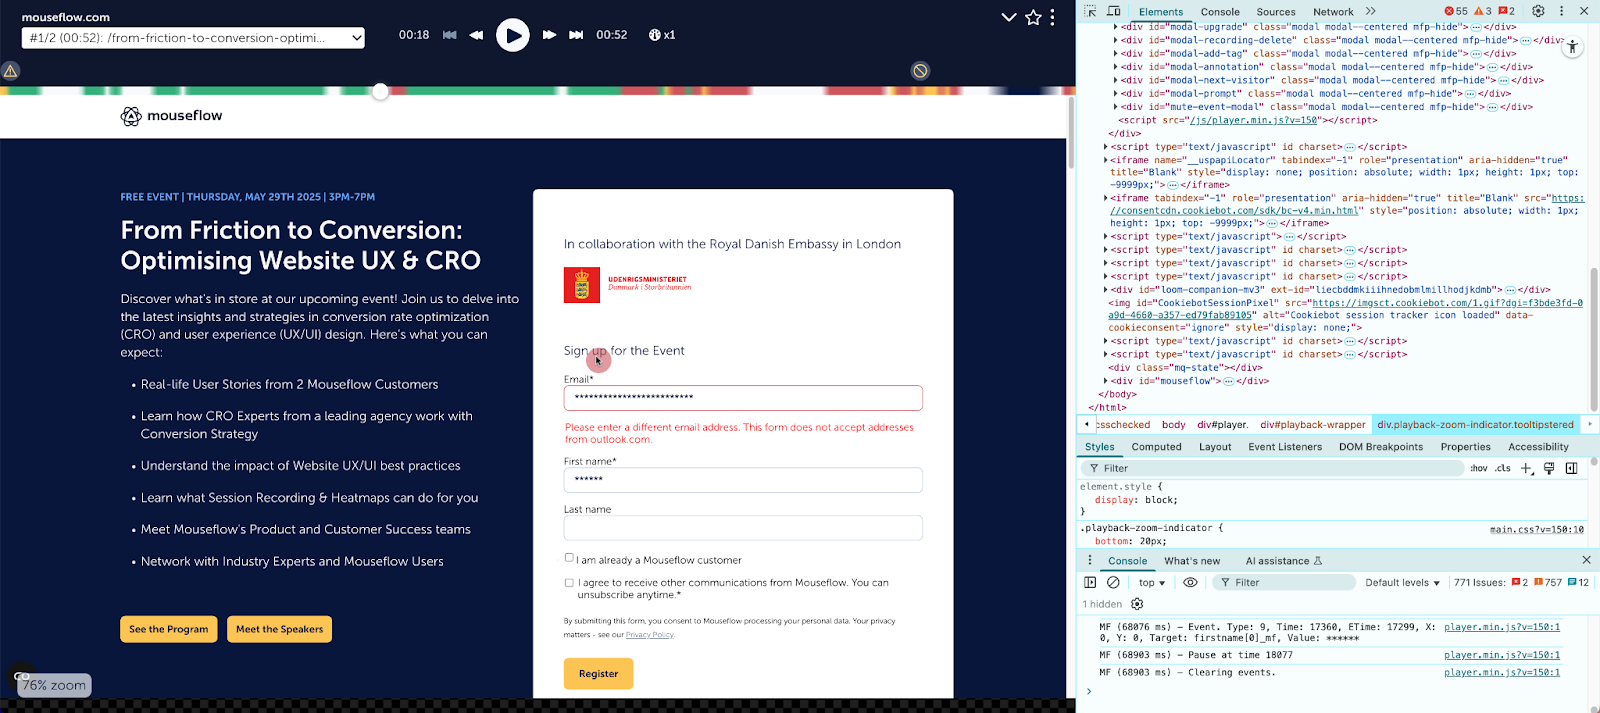
Error clicks are essentially misfires of Javascript code on the website. Seemingly and often invisible, it signals that something is broken on your website and can lead to poor experiences. Both Mouseflow and FullStory track click errors, yet the visualization and depth varies.
With FullStory, you get access to Developer tools and full Console/Network access, much like you would with the “Inspect” feature on Chrome.
With Mouseflow, you get to visualize the stack trace for the Javascript error. Additionally, since we record a full copy of the HTML, you can right click on the recording and access the browser’s inspect feature.
Session Recording and Playback
| Fullstory | Mouseflow | |
|---|---|---|
| Recording | Non-stop | Non-stop |
| Users captured | All (not sampled) | All (not-sampled) |
| Pageview break-down | Entry page/ Exit page | Shows all pages visited with times, engagement rates, tags or events, and friction scores during a session organized in a waterfall view. |
| Can download | No | Yes |
| Can replay sessions of users who dropped out of the funnel | All plans | Yes |
| Can replay sessions of users who have problem with forms | No | Yes |
| AI summary for session recordings | Yes (Enterprise and Advanced plans) | No |
If you start a trial with FullStory, the first thing you are going to ask yourself is, “where are my recordings”. Rest assured, they are there, you just have to dig a little deeper to get them. One of the reasons why we mentioned they work under a different paradigm is because to access recordings, you first need to select what you want to watch (create a segment). Whereas with Mouseflow, accessing recording is as easy as just clicking on Session Replays, and from there on, decide how to filter your data. You could argue the UX is backwards for either of the two.
Another argument you could make is that session replay makes for the bulk of both product offerings. So let’s assess the differences between them.
The Recording List
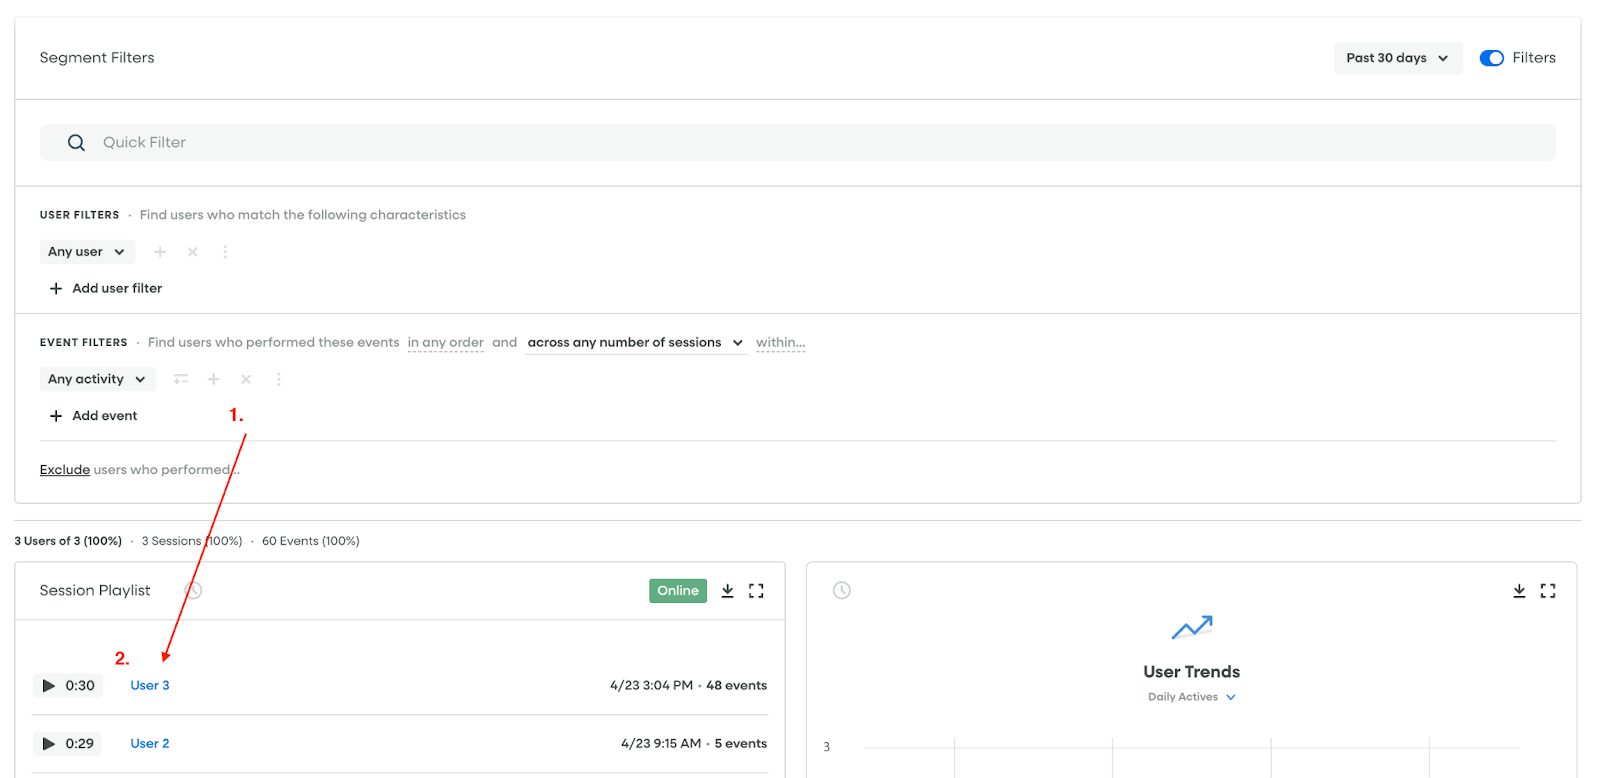
FullStory will show you a “playlist” once you create a segment. Information in the playlist is limited, and won’t give you much context about the full journey for that recording.
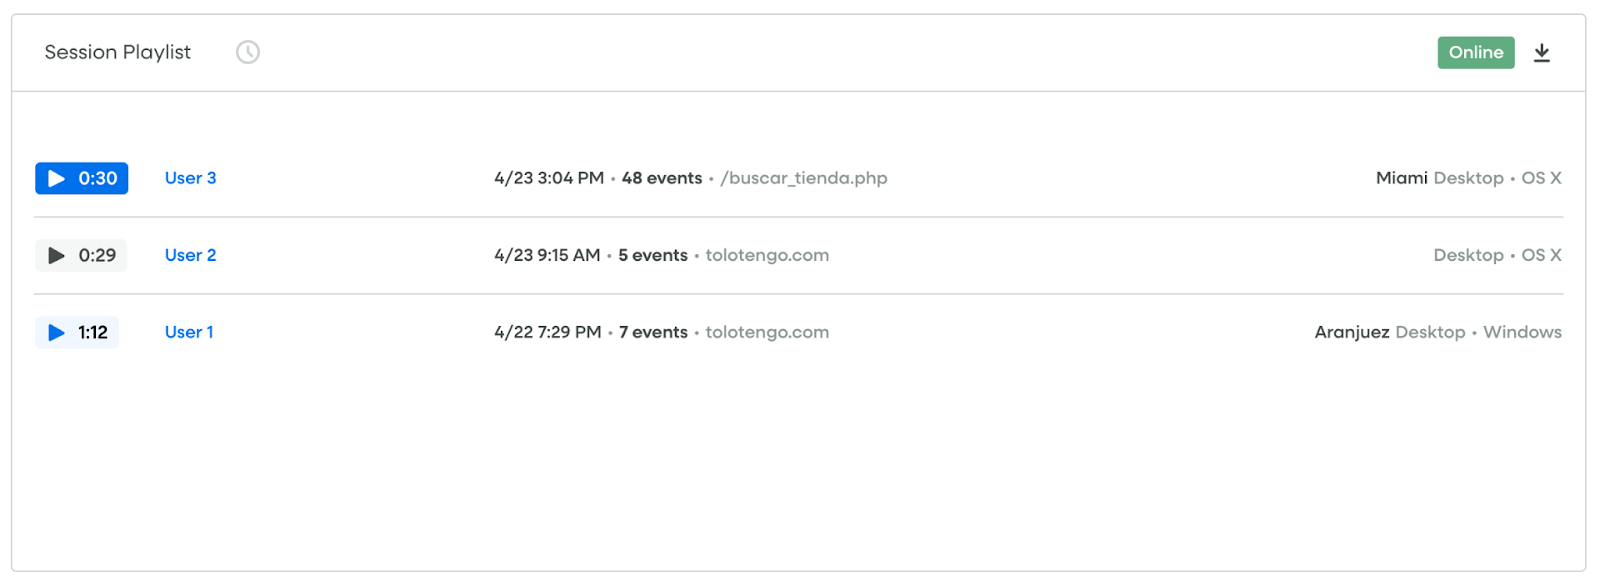
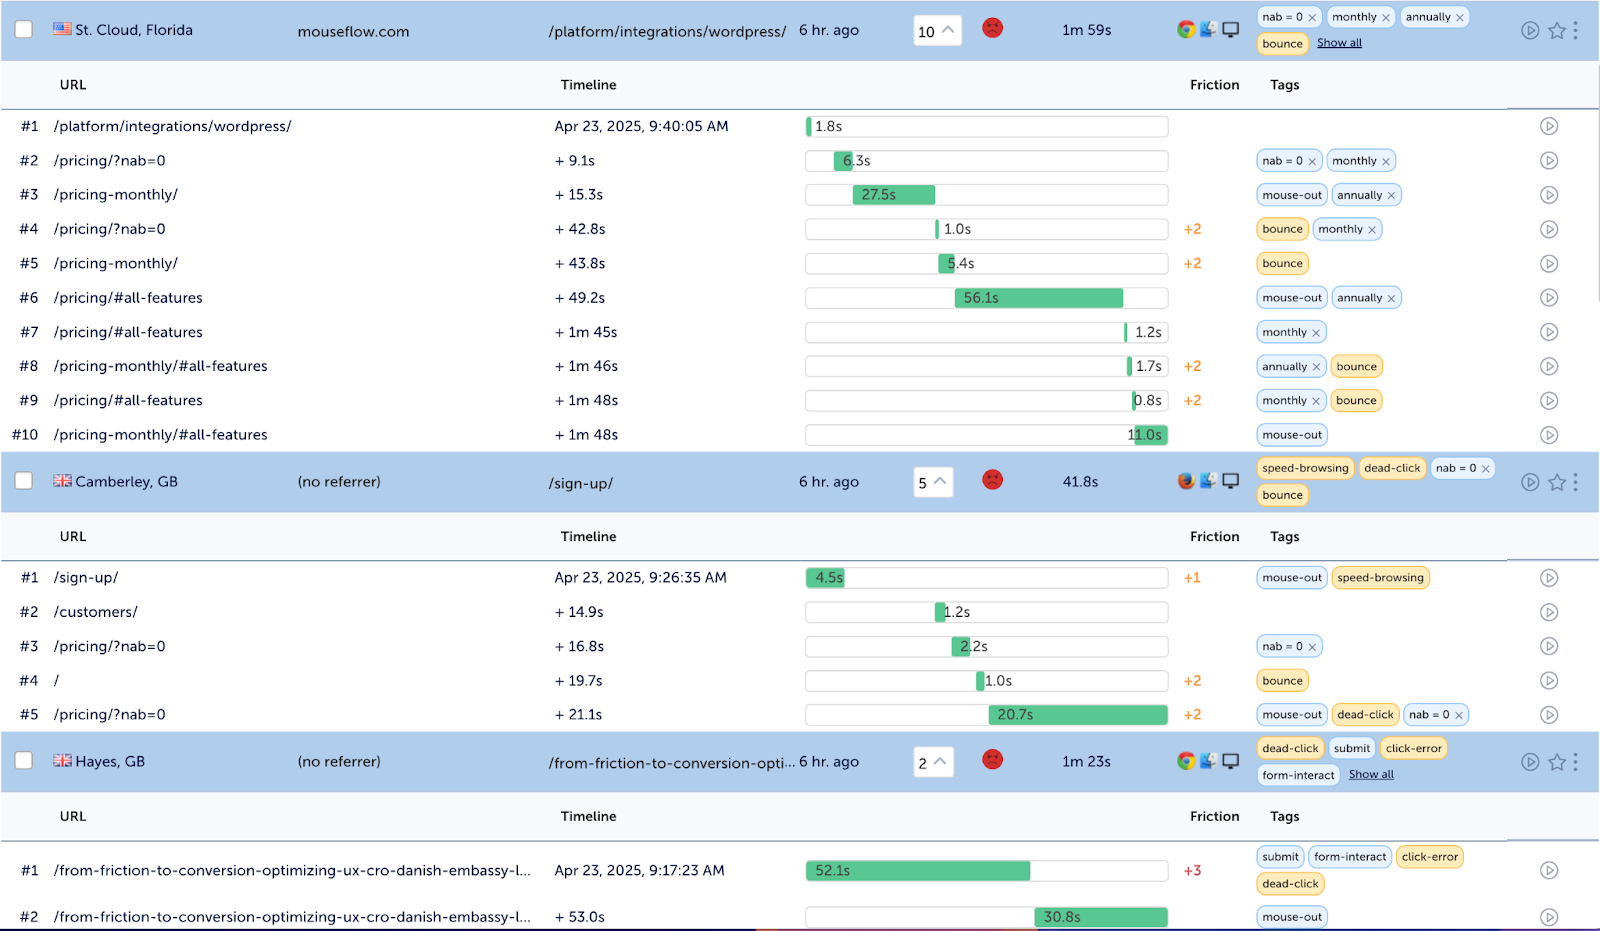
In contrast, Mouseflow will give you a waterfall view of every pageview included in the session, along with relevant data to glean quick insights from the session including visualizing concurrent browsing experiences.
The theater
Popcorn ready? Let’s step into the theater to replay a few sessions.
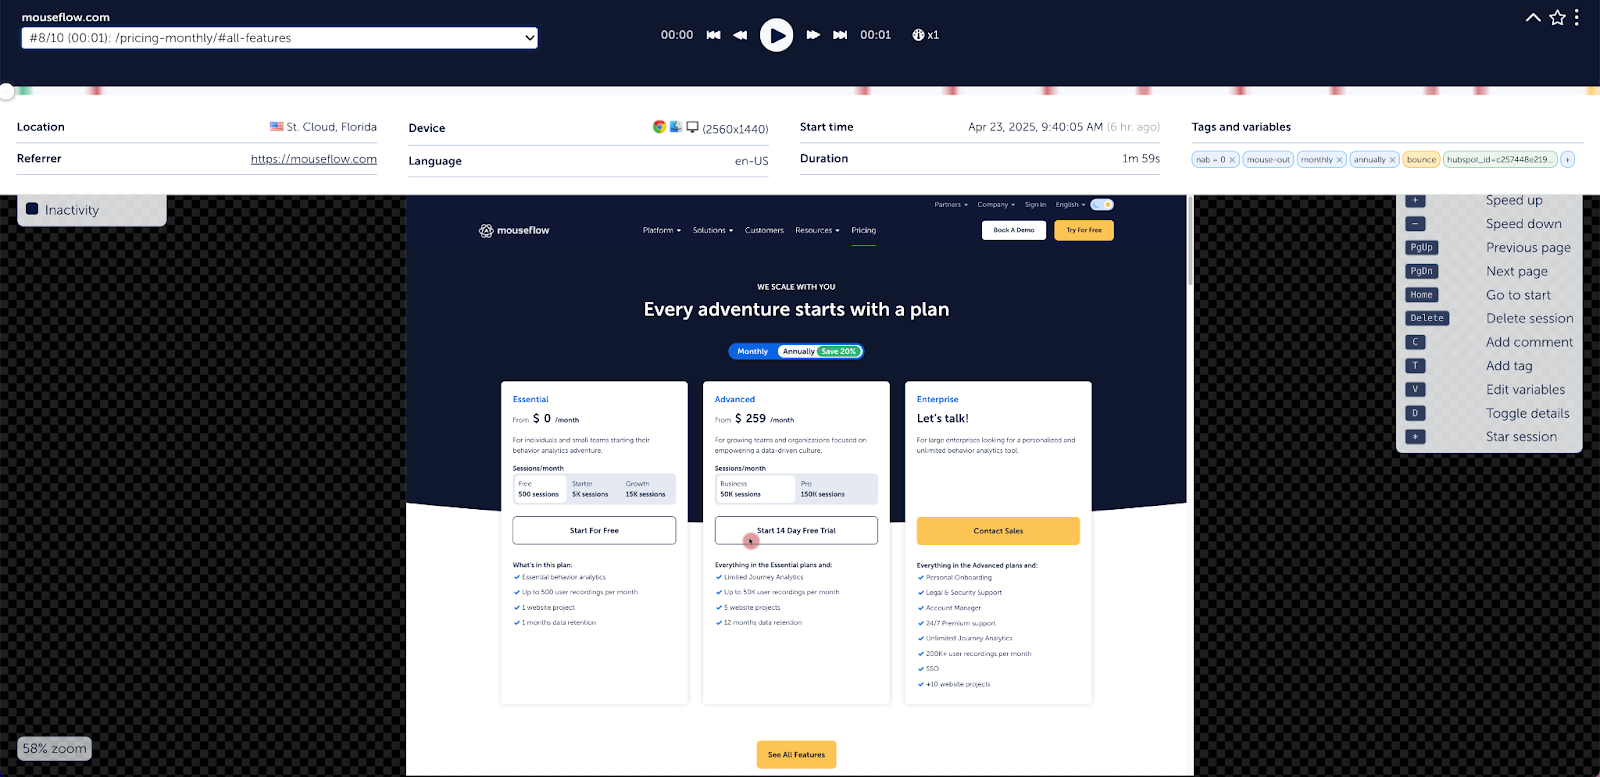
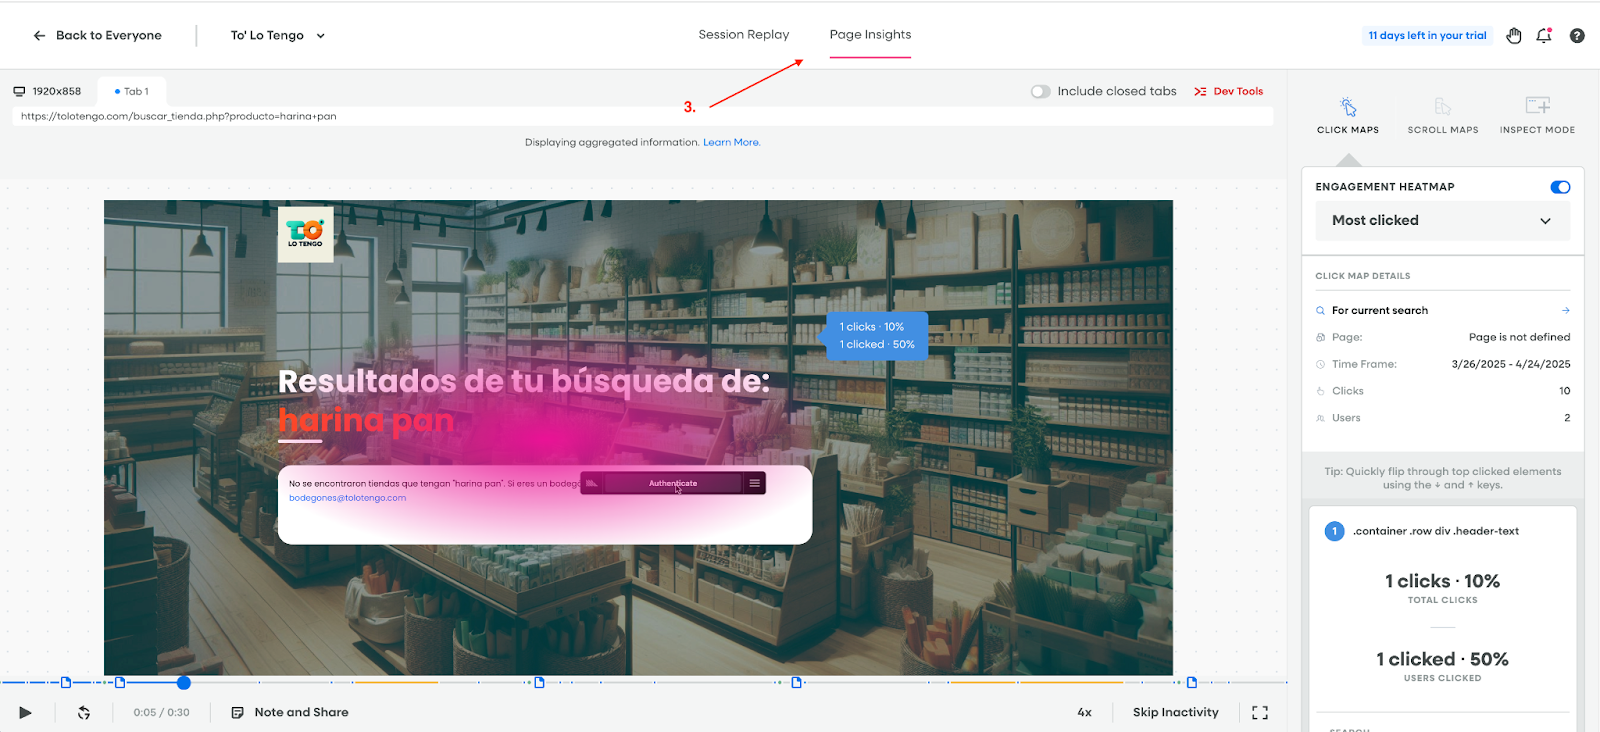
FullStory’s theater is aesthetically pleasing and packed with tons of features. More notably, you can access heatmaps from the theater itself as you watch a session. Some may find this confusing, as it is showing the aggregate data of all visitors into a single pageview, when you are indeed watching just one session.
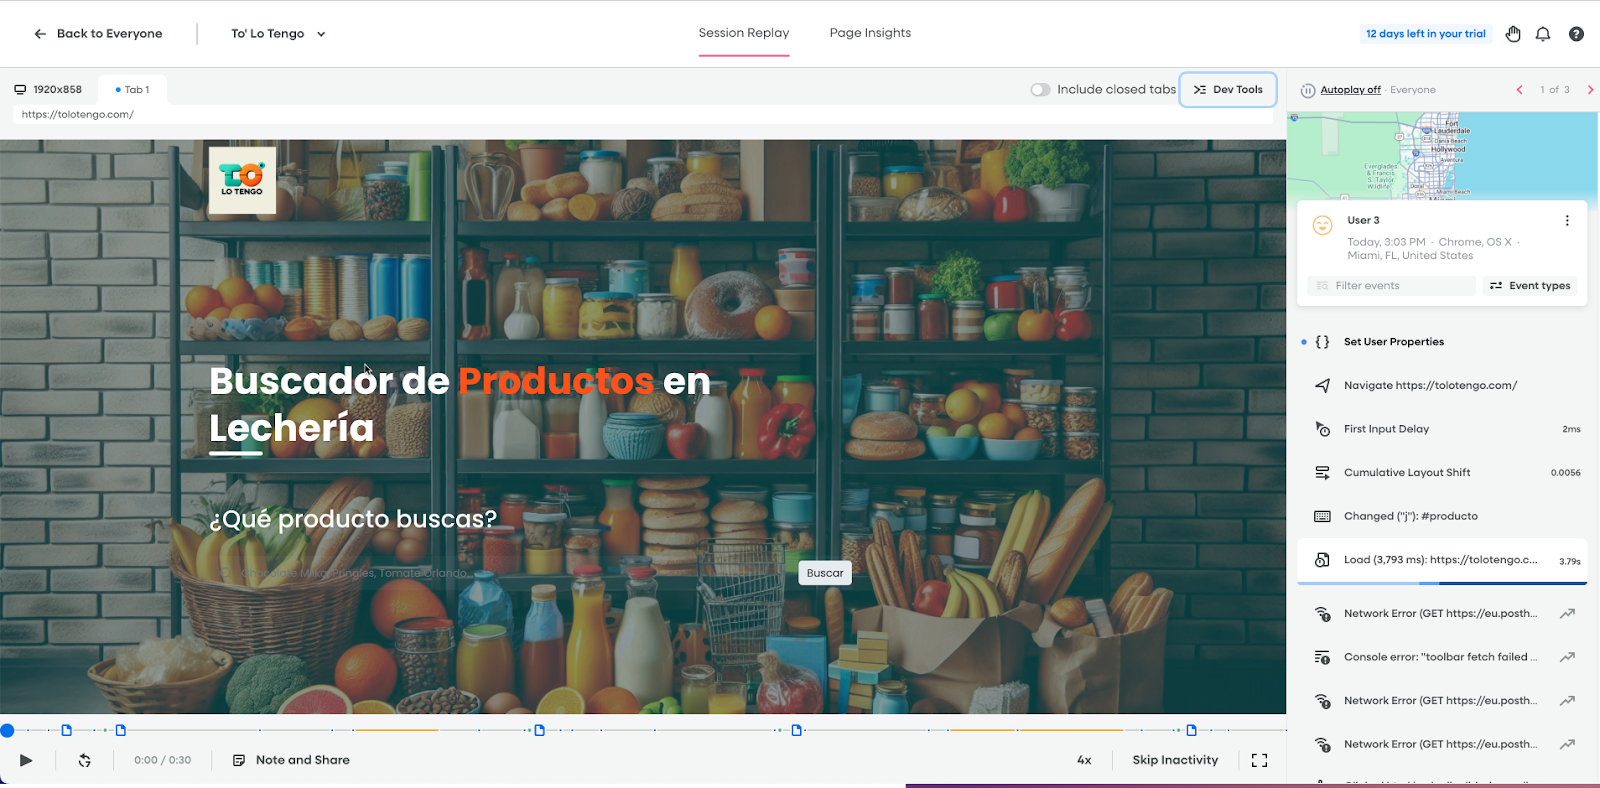
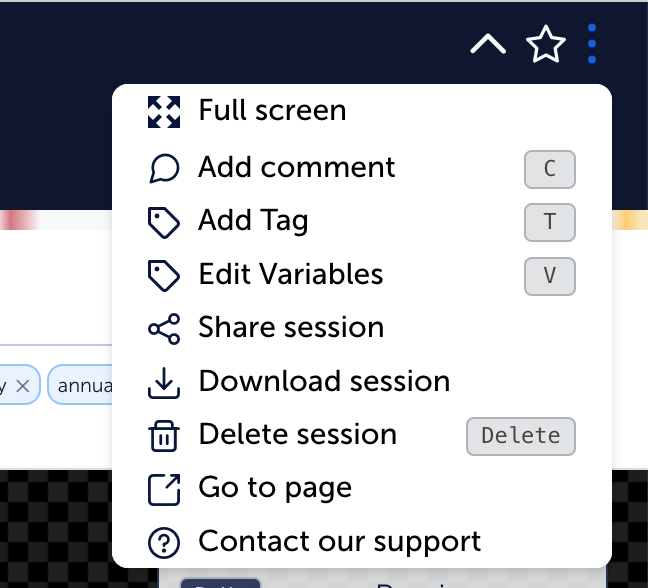
It offers a play-by-play account of all interactions on the page, a nice map preview of the visitor’s location (GDPR?), access to heatmaps (Page insights) and Dev tools. You can add notes and share right from the theater as well.
Mouseflow’s theater offers a similar experience, streamlined to focus attention on the behavior shown in the recording. It has a drawer to surface technical details of the session, as well as a menu to enrich the session with additional tags, variables and comments. On the left hand side you’ll be able to scroll through all pageviews in the session.
Heatmaps
| Fullstory | Mouseflow | |
|---|---|---|
| Generated | By request, or by accessing session replays | Automatically for all tracked pages |
| Types | 3: Click, Scroll, Conversion | 7: Click, Move, Scroll, Attention, Geo, Interactive and Friction (Add-on) |
| Filters available | Device, Type on manually set up heat maps. Note: To filter heatmaps, you’ll need to build a segment first. You can’t change the filtering conditions on the heatmap itself after it’s created. |
Device, Type, Time, Traffic Source, Browser, Screen Resolution, OS, Tags |
| Link Analytics | N/A | More than 10 data points available for each clickable element on the website |
| Visualization of dynamic elements (sliders, menus) | No | Yes |
| Can download | Yes | Yes |
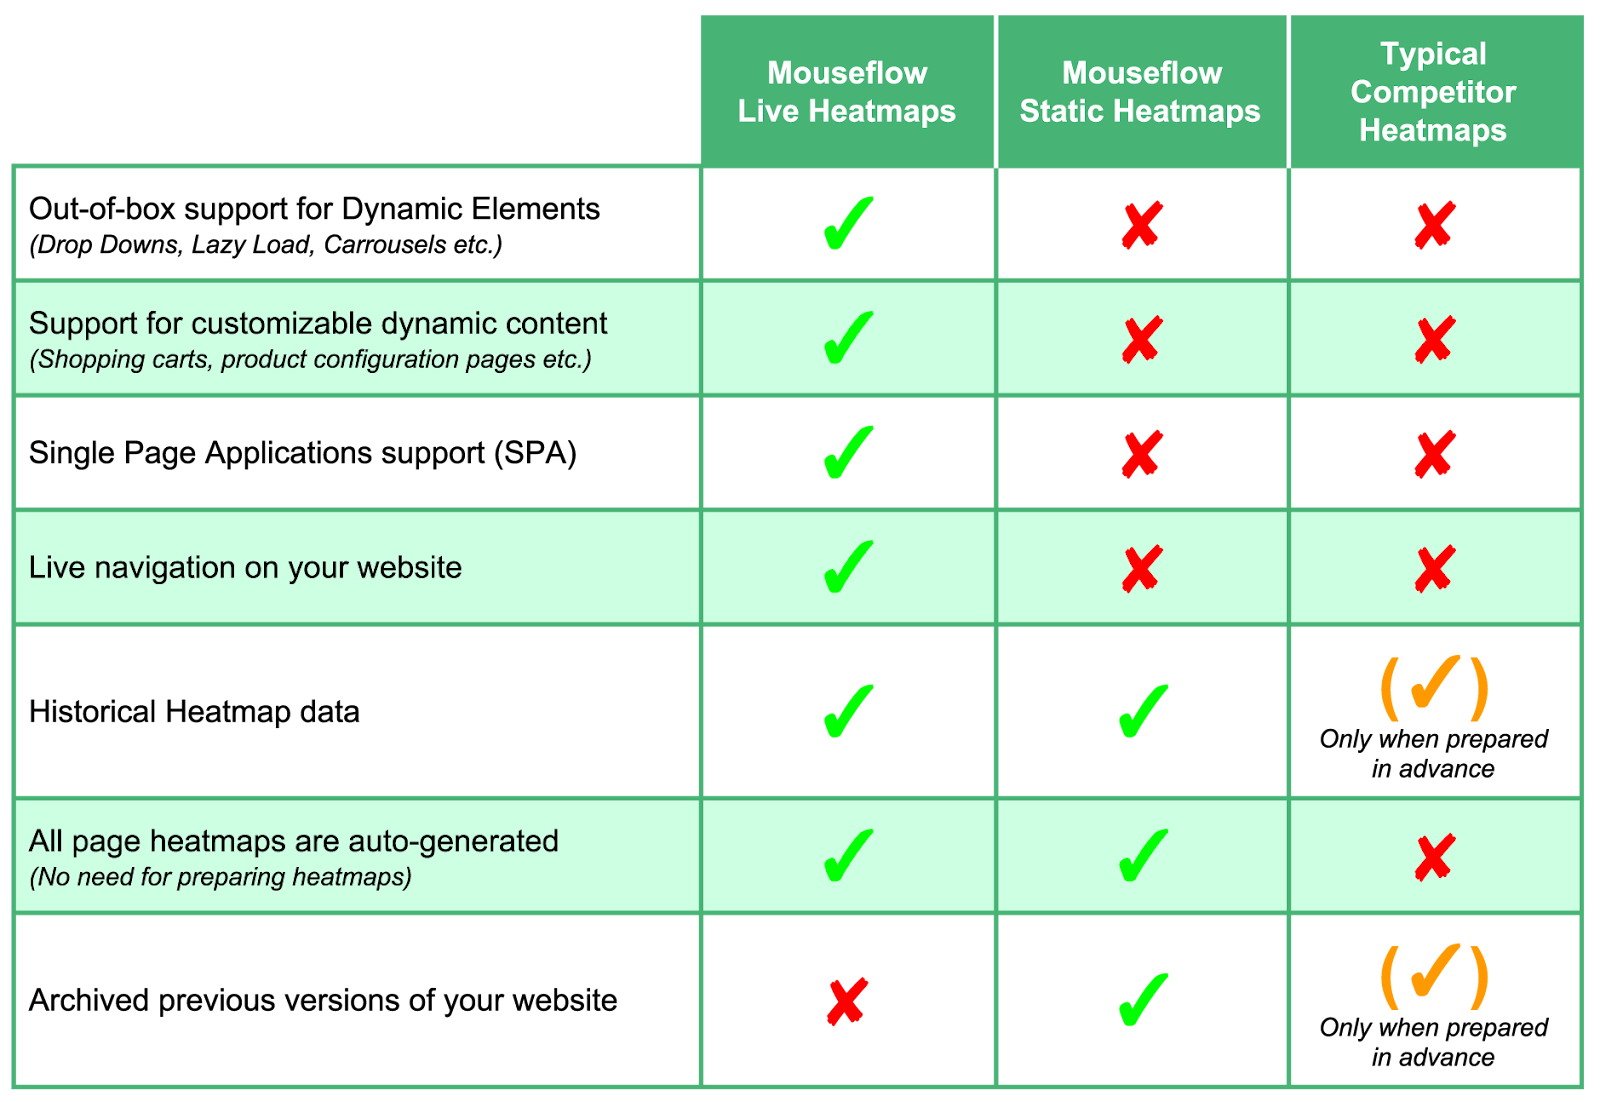
At face value, you’d think that a tool that offers 7 types of heatmaps would be better than one that offers 3. And in this case you are right. The only point of parity between heatmaps in FullStory and Mouseflow is that they both offer Scroll heatmaps. Beyond that, it is hard to make a case to favor FullStory in this analysis. Let’s establish first that to access heatmaps in FullStory you first have to create it. Which would be ok if we were in 2017.
Moreover, if you didn’t want to set it up ahead of time, you’d need to access session replays, and access page insights – for which you’ll need to also set up a segment. Unintuitive and inconvenient at best.
Filtering? Well, you definitely can set up a segment then head into a session in the playlist, and then access Page Insights. Rinse and repeat if you want to change conditions. Again, not the most intuitive UX.
Heatmaps through session replay in Fullstory
Now, the other option is to create a heatmap. It’s convenient to pick the URL (yeah, they got that one right), but beyond that, you can’t do much.
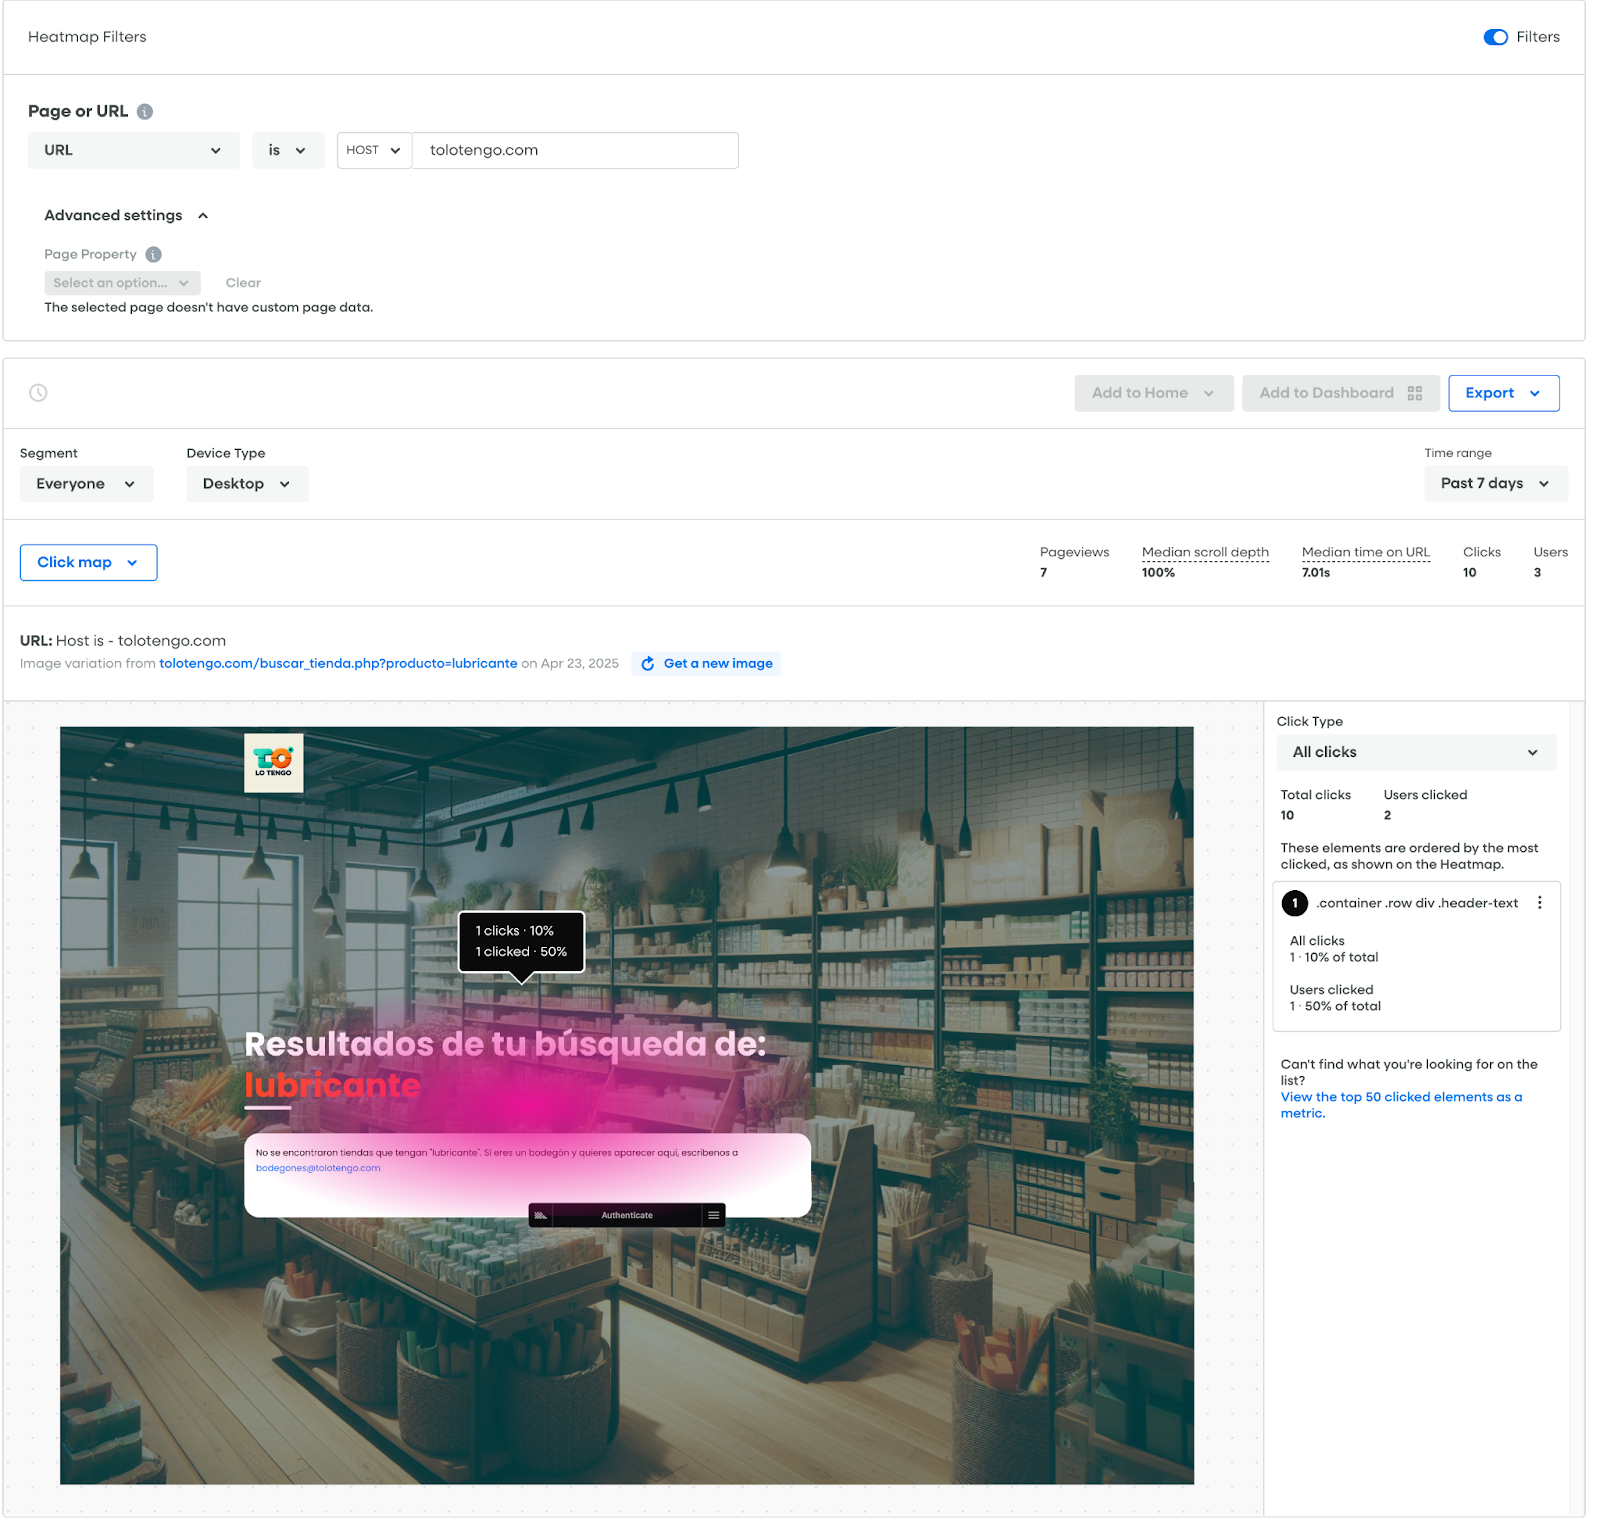
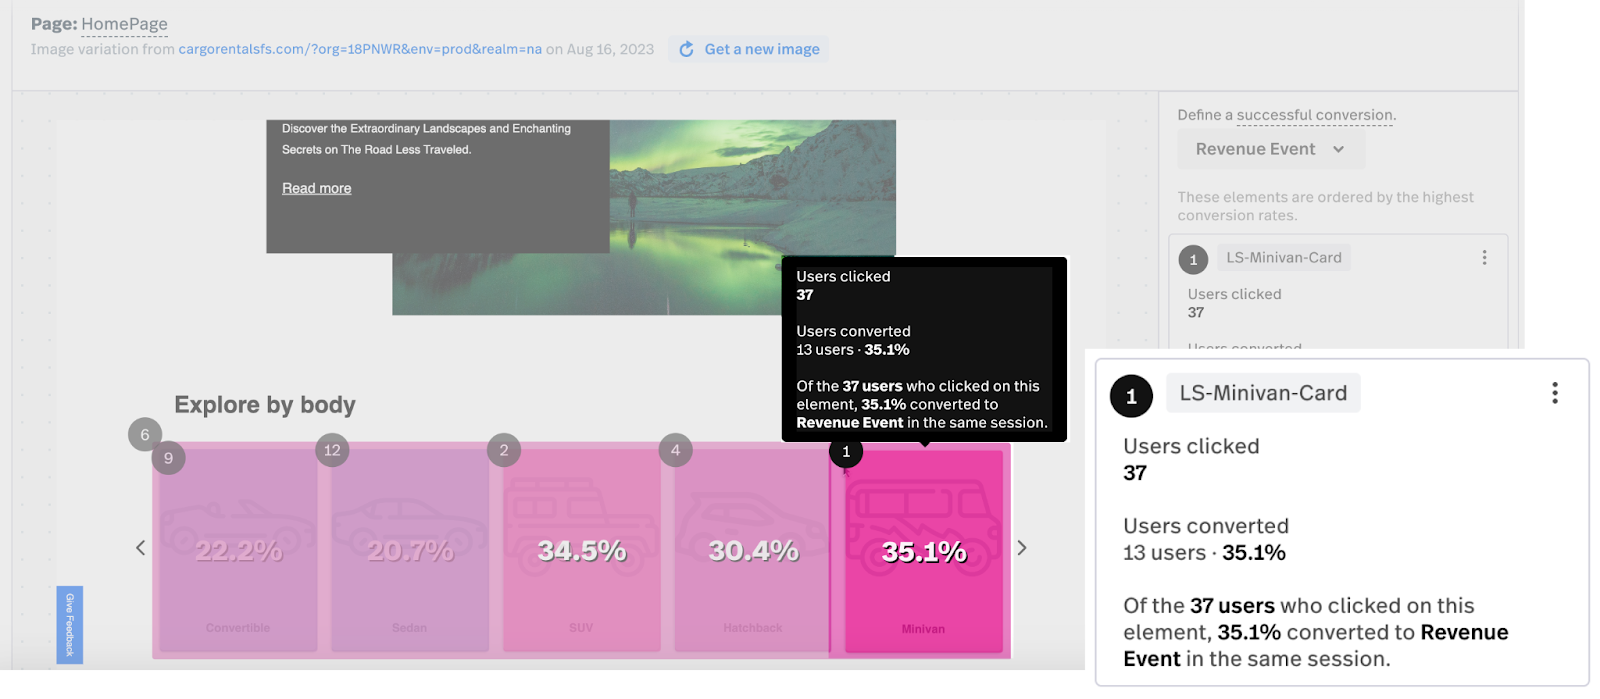
They do offer Conversion heatmaps, which will show you the conversion rate for each element on the page – but you’ll need to be on an Enterprise or Advanced plan.
Now, let’s look at Mouseflow’s heatmaps and compare.
Mouseflow generates 7 types of heatmaps automatically for all URLs tracked and makes them available in the heatmap list. We’ll analyse intuitiveness and filtering options, as we’ve assessed these features for FullStory, then we’ll evaluate click, attention, movement, interactive and friction maps in Mouseflow to showcase what you’d get if you were to pick us as your behavior analytics solution.
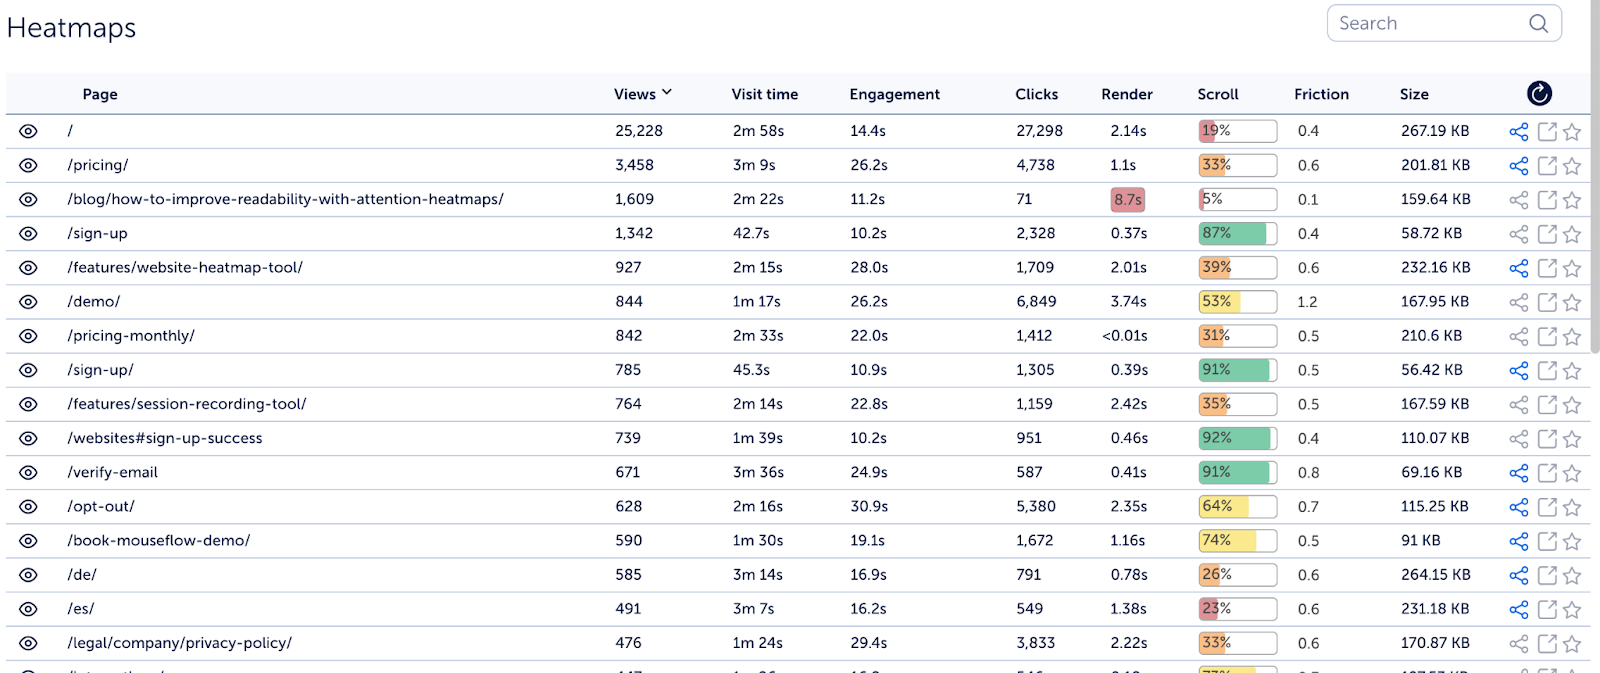
The heatmap list surfaces important information about each page: views, visit time, engagement, total clicks, render time, scroll depth, Friction Score and size of the page.
Click on any of the pages and access the heatmap. That simple.
Filtering? Not an issue. One of the cool things about Mouseflow is that its filtering suite is available throughout the app for all features. Change the conditions and the data adjusts dynamically.
Click Heatmap

Mouseflow’s click heatmaps are quite powerful. Beyond just showing hot/cold spots, you get far more control over your visualization. From the heatmap engine you can scroll through different pages on the left-hand side, change the device for which you are visualizing the heatmap, or scroll through the 7 types of heatmaps offered. Right without leaving your analysis.
Link analytics show when hovering over a clickable element. It offers 10+ contextual link data to help you optimize the smallest of details.
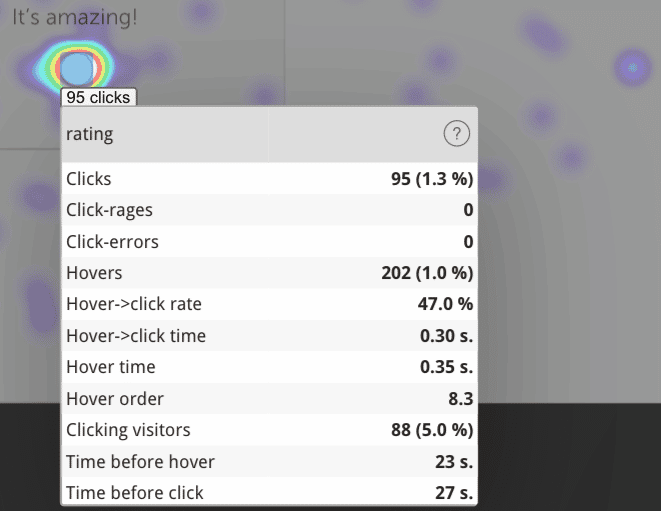
Mouseflow’s example of click information on a heat map.
Mouseflow makes it easy to understand why your landing page isn’t performing as expected. Just choose the page or UTM source you want to analyze—no extra setup required.
Plus, with the date filter you can track how visitor behavior evolves after changes to your site. Whether you’re running A/B tests or tweaking your layout, it’s easy to see what’s working (and what’s not) so you can boost conversion rates with confidence.
Movement Heatmap
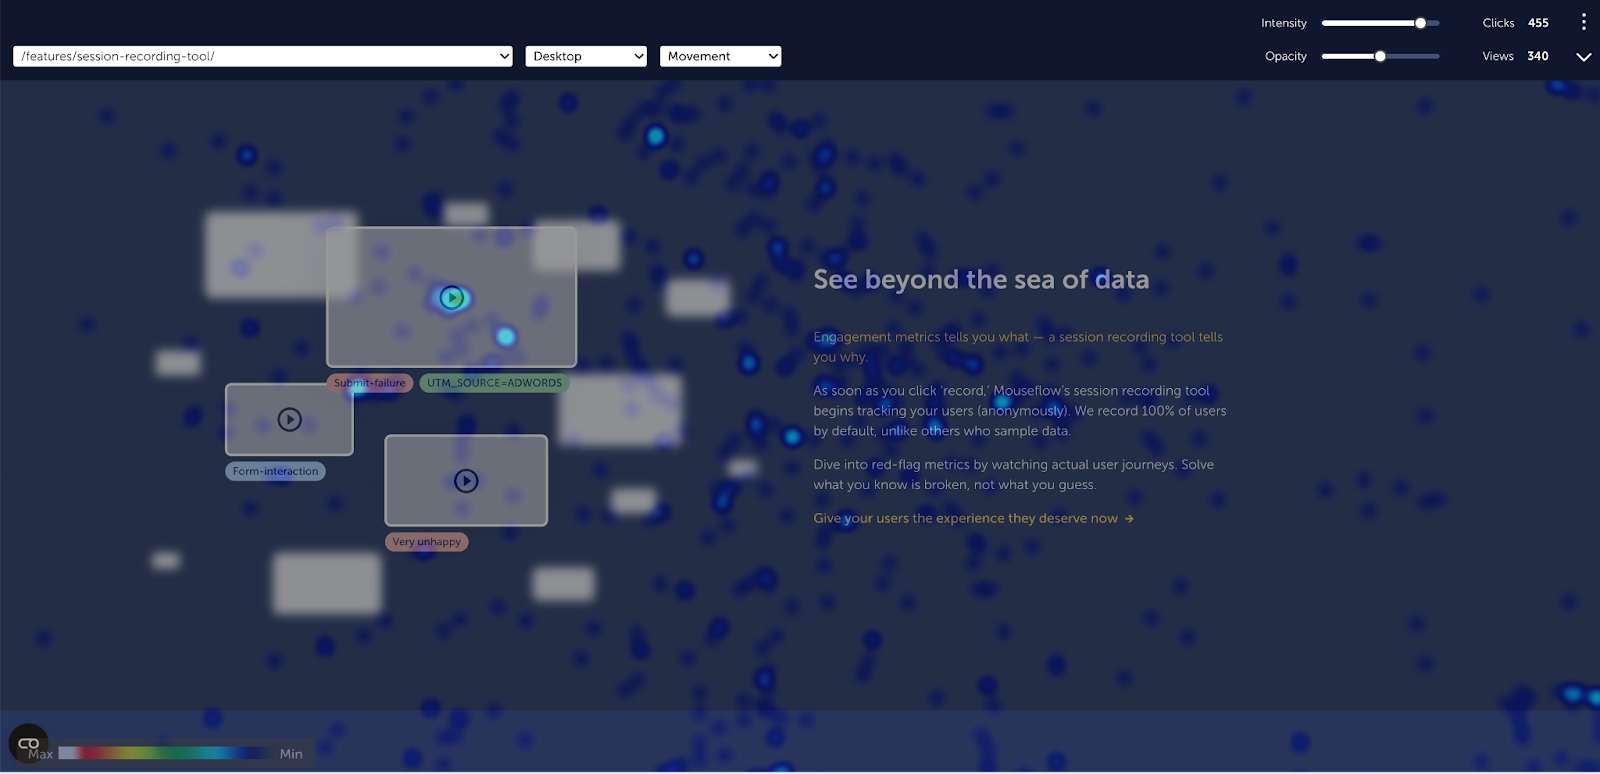
Movement heatmaps is another reason why Mouseflow is a great FullStory alternative. It will allow you to see what elements in your UX/UI are catching the attention of your visitors. This happens regardless of whether they click on or not on the element. This is crucial to understanding what is causing friction or simply distracting your visitors from performing the action you wanted them to.
Attention Heatmap
Is your blog interesting? Is the new section you added to your pricing page drawing attention? Is there something on the page getting too much attention? These are all questions you can answer by leveraging attention heatmaps. It’s the perfect content optimization companion.
Interactive Heatmap
Interactive Heatmaps let you see how visitors engage with dynamic elements on your website. Mega-menus, carousels, login options… These interactions are often lost in a heatmap analysis, but with Mouseflow’s interactive heatmaps you’ll be able to surface insights from them. Set up? No need. It works out of the box.
Friction Map
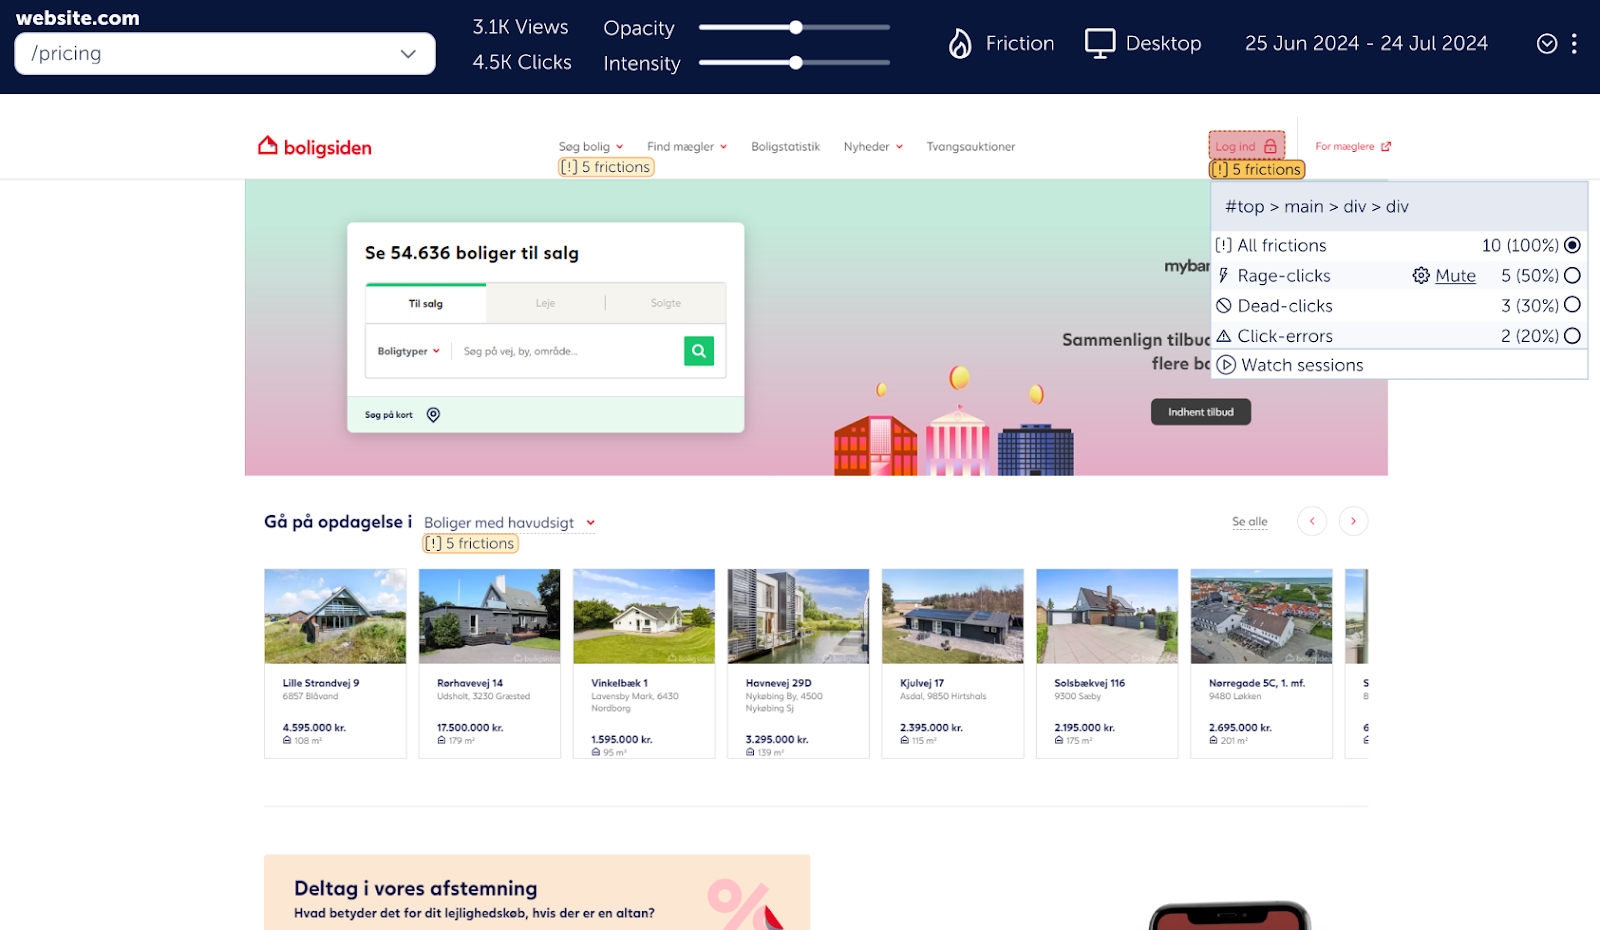
Mouseflow’s friction map allows you to visualize all friction events happening on a single page. rage clicks, dead clicks, and interaction errors are mapped on the page to showcase the areas in which friction is present, making it easier to assess and visualize the importance they have in the user journey. You can also quickly access the recordings where friction happened to uncover what happened, before, during and after the event.
Funnels
| Fullstory | Mouseflow | |
|---|---|---|
| Build funnels with any item in the data layer | Yes | No |
| URL-Based funnels | Yes | Yes |
| Filtering | Limited | Full |
| Flexible visualization | Yes | No |
| Watch session replays from Drop-offs | Yes | Yes |
| Compare to past performance | Yes | No |
One big tradeoff between Mouseflow and Fullstory when it comes to Funnels is that, in order to apply filters to a FullStory funnel you’ll need to build and save it first in order to apply limited filters in your dashboard. Whereas with Mouseflow, you can build your funnels and apply filters dynamically to evaluate how different conditions affect your conversions.
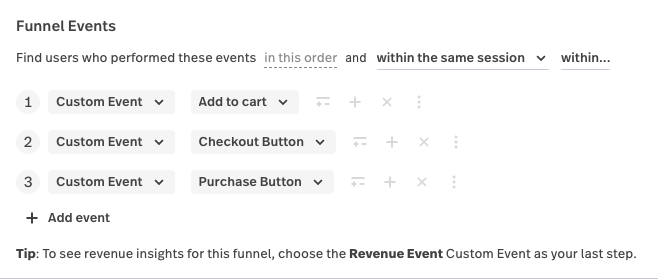
FullStory does a stupendous job with Funnels. However, it can become very complex fast. Visualization is clean and offers different types of chart formats. It offers you the opportunity to mix and match conditions for each step of the funnels, like funnels from page visit to the click of a button right from the funnel builder. You will need, of course, to know your way around your data layer to ensure you are picking the right element.
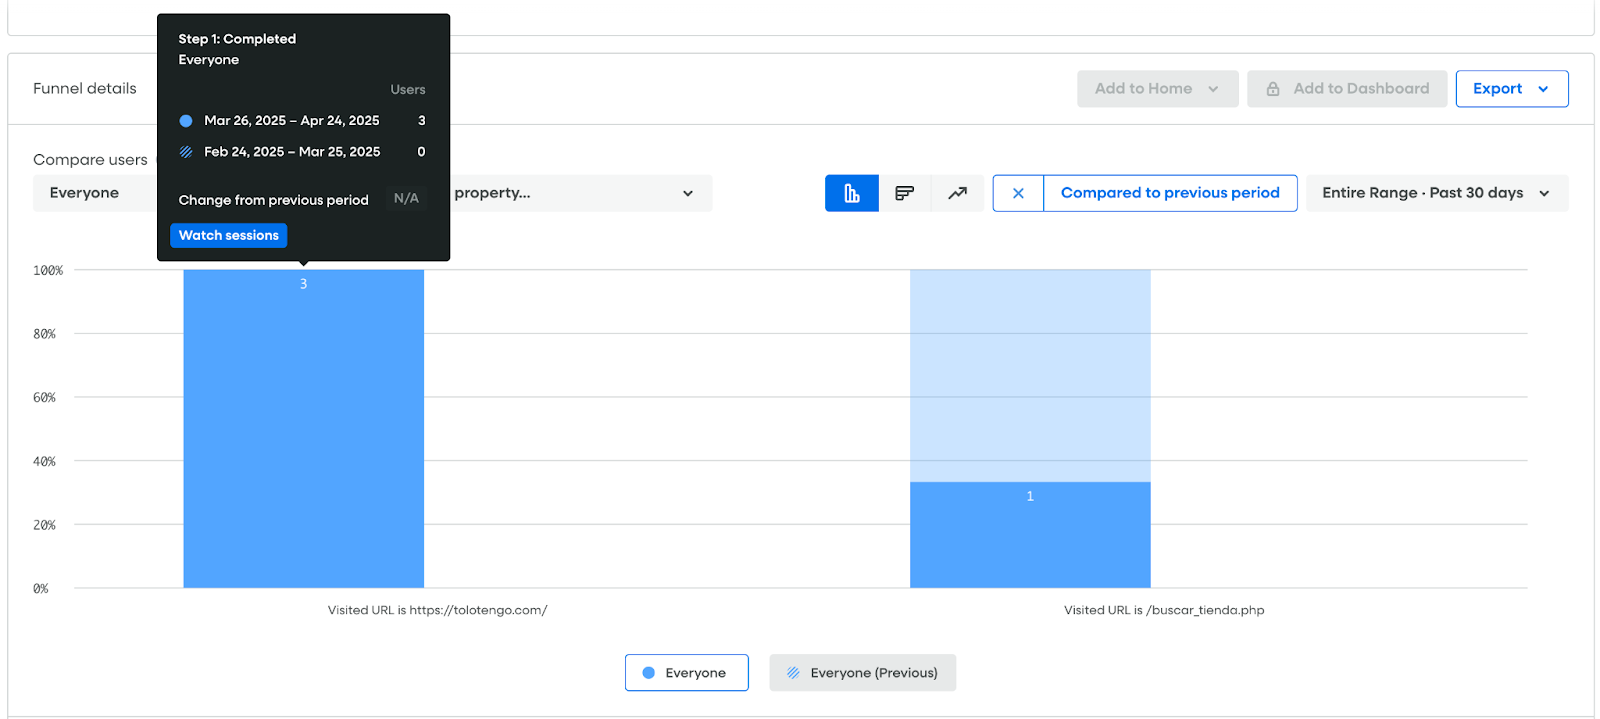
Funnel visualization in FullStory
Multi-funnel format in Fullstory
Additionally, FullStory offers advanced options to ensure accuracy in your funnel analysis like funnel analysis within the same or multiple sessions, as well as completing the funnel under a timeframe.
On the other hand, Mouseflow offers funnels based on URLs and access to the same level of filtering as with previous features. This is crucial when assessing this feature. For example, if you’d want to analyze a conversion funnel for your eCommerce based on UTM sources, you’ll be able to quickly do so with Mouseflow, whereas this is not something you can do with FullStory. The same concept applies to Friction Score and friction events.
A view of conversion funnels in Mouseflow
Form Analytics
| Fullstory | Mouseflow | |
|---|---|---|
| Users Captured | Not available | All (not-sampled) |
| Form results data | Not available | Always. Set up and analyze when needed, even retroactively |
| Filters | Not available | 100+ filters URL, Country, Tags, Page Count, Device, Browser, OS, Screen resolution, HubSpot User ID, Friction Score, Friction Event, Duration, Traffic Source, Returning visitor, Custom Variables, Custom Behavior Tags |
This comparison is rather simple. Mouseflow has form analytics and FullStory doesn’t. Which makes it a great FullStory alternative.
Setting Mouseflow form analytics is straightforward. Just located the page where the form is embedded, and Mouseflow will recognize all its fields. It will then give you the option to select the fields you’d like to consider in the funnel and once you are done it will show you something like this:
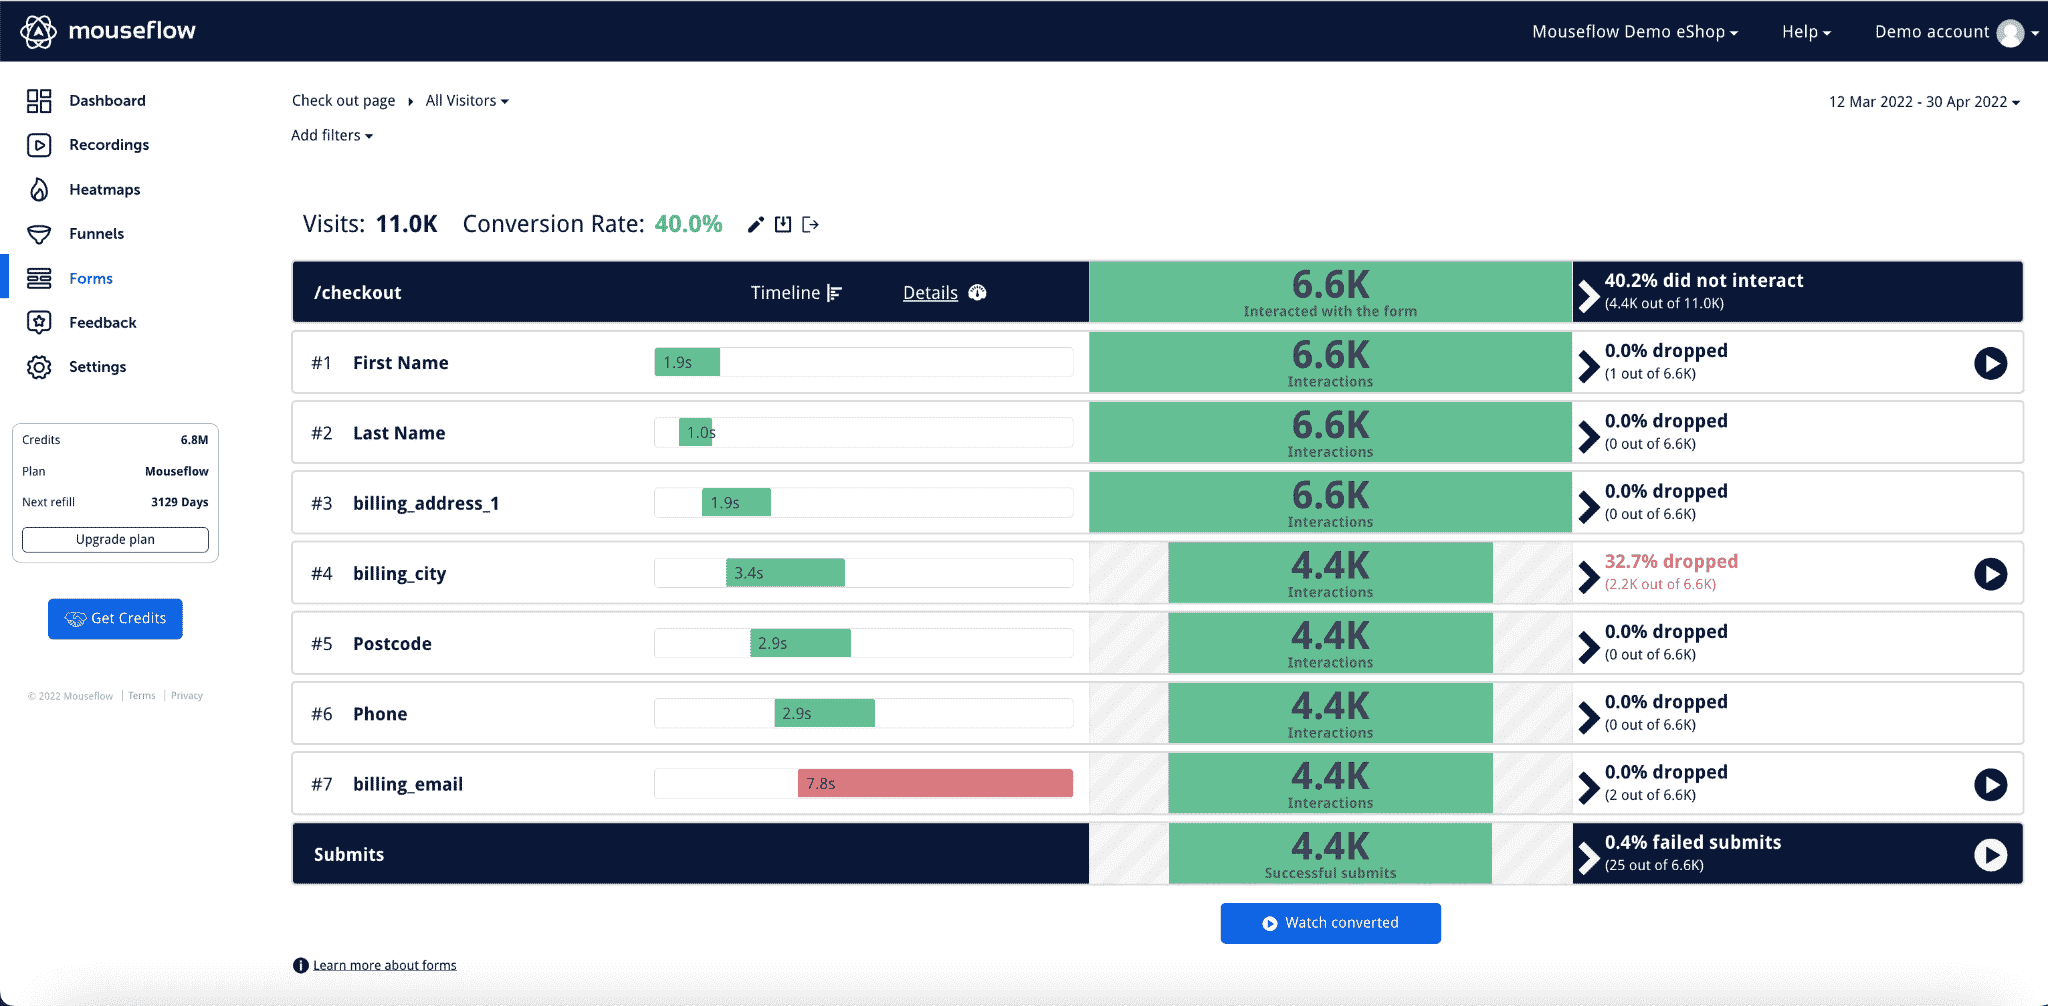
Mouseflow’s form analytics view
You’ll be able to apply filters and see how the form performance changes depending on the conditions you select. Furthermore, you can watch session replays from people who abandon the form at any step, or those who complete the journey.
Note: there is an option with FullStory to watch replays from abandoned forms.
User Feedback and Surveys
| Fullstory | Mouseflow (Available in all plans) | |
|---|---|---|
| Available | No | Yes |
| Watch session replays from respondents | No | Yes |
| Trigger on click rage, click error or inactivity | No | Yes |
| Multiple question formats | No | Yes |
An important aspect of conducting qualitative research is speaking to customers to find quantitative trends that can inform strategy. FullStory does not have feedback surveys to satisfy the need to speak to customers during their website visit, but they integrate with great survey options like Survicate and Qualtrics ($$$).
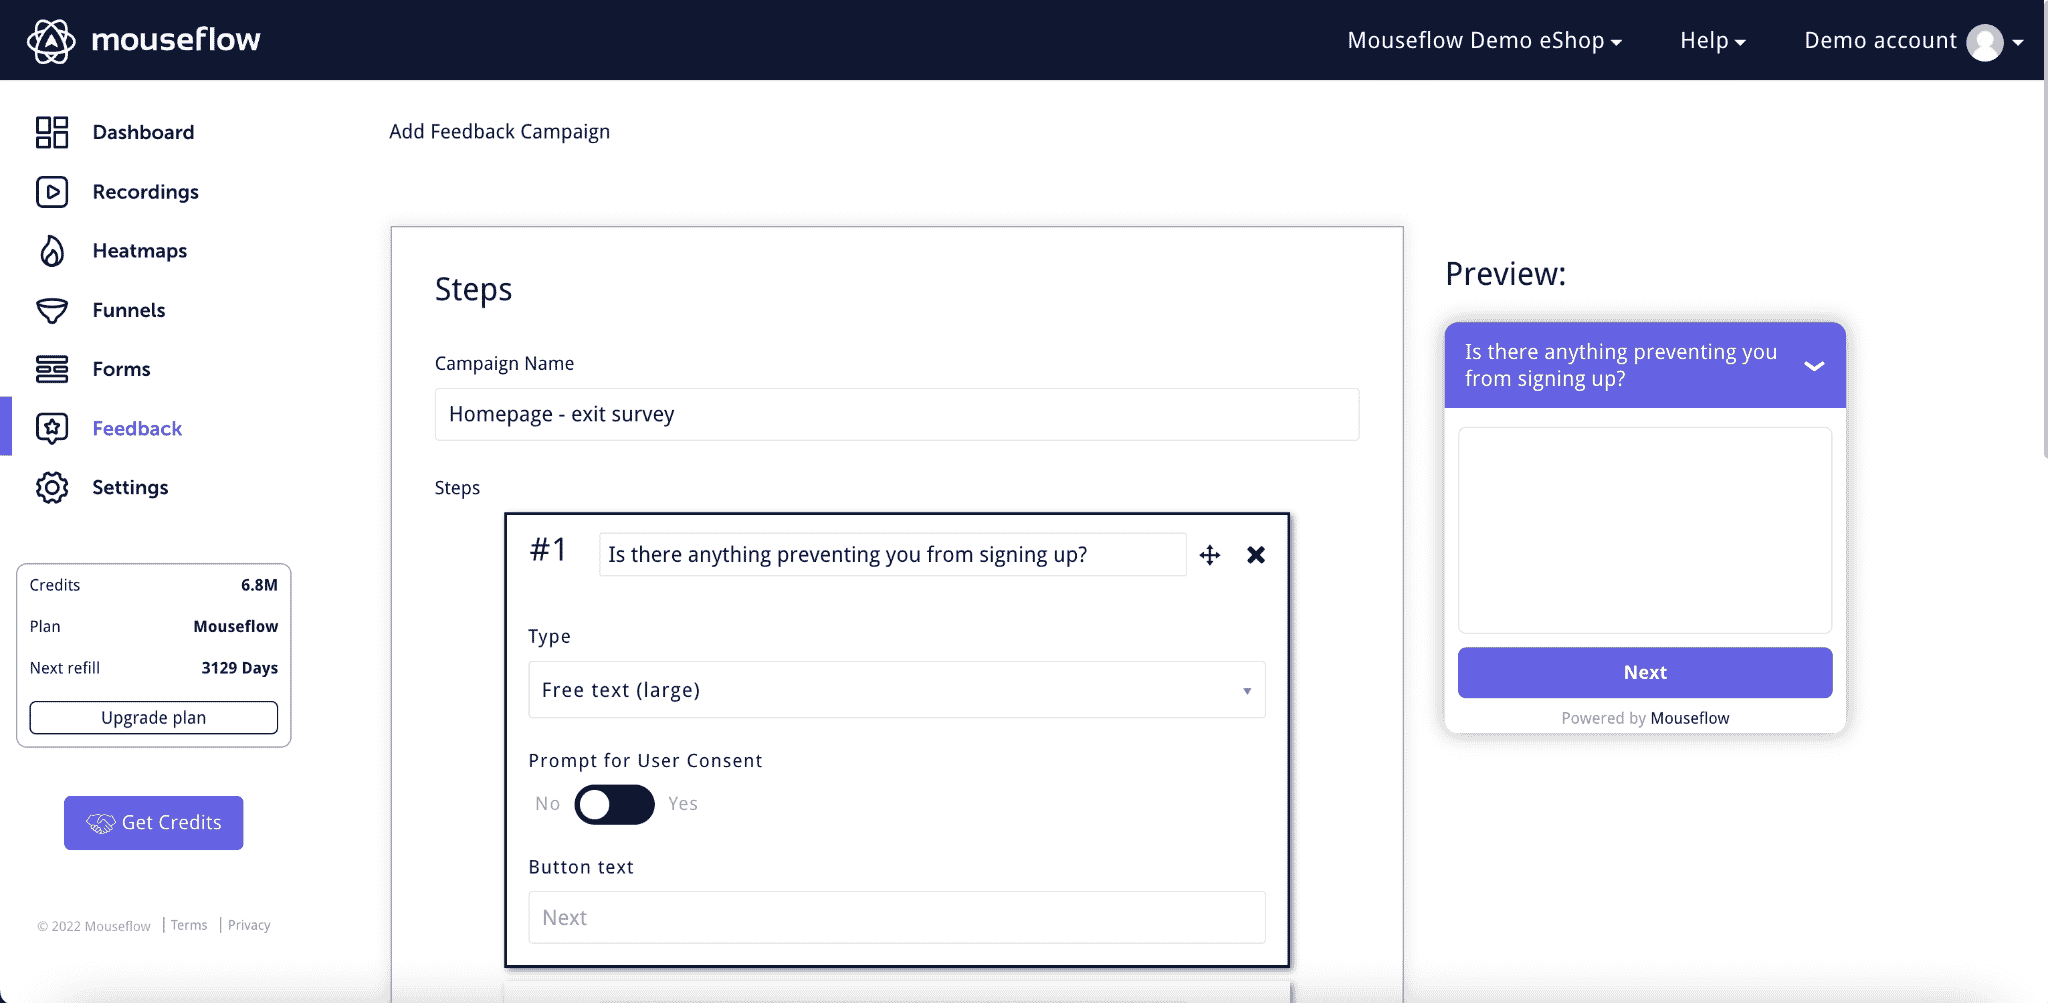
Mouseflow’s feedback campaigns builder
Mouseflow includes built-in user feedback tools, seamlessly blending qualitative and quantitative data. It allows you to assess NPS, ask multiple choice questions, free text, and ranking/rating questions to get more qualitative data to enrich your research. You can then use the reporting feature to get more insights on your survey results.
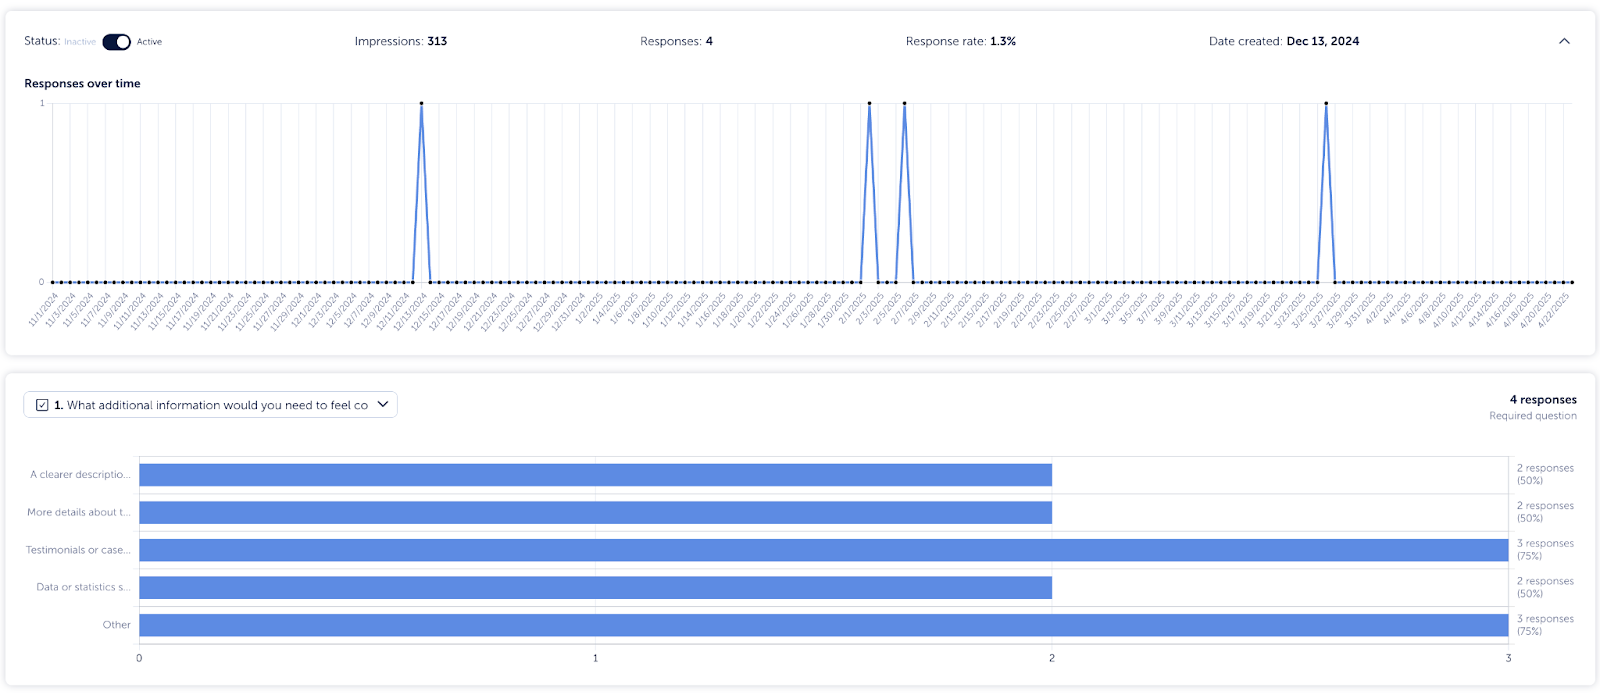
Mouseflow’s Feedback Survey feature
Mouseflow’s Feedback Survey feature also has logic to build complex surveys, and multiple triggering options to address moments head-on as they happen. For example, you could potentially recover lost conversions by firing a survey the moment somebody experiences click-rage, or when they trigger a click error. You can even fire a survey on a form-submission event! This is all done natively in-app and at no extra cost.
Integrations and Compatibility
Both platforms offer wide-ranging integrations. Mouseflow integrations are user-friendly and straightforward. Fullstory’s integrations are comprehensive but technical, requiring dedicated resources.
Compliance and Data Privacy
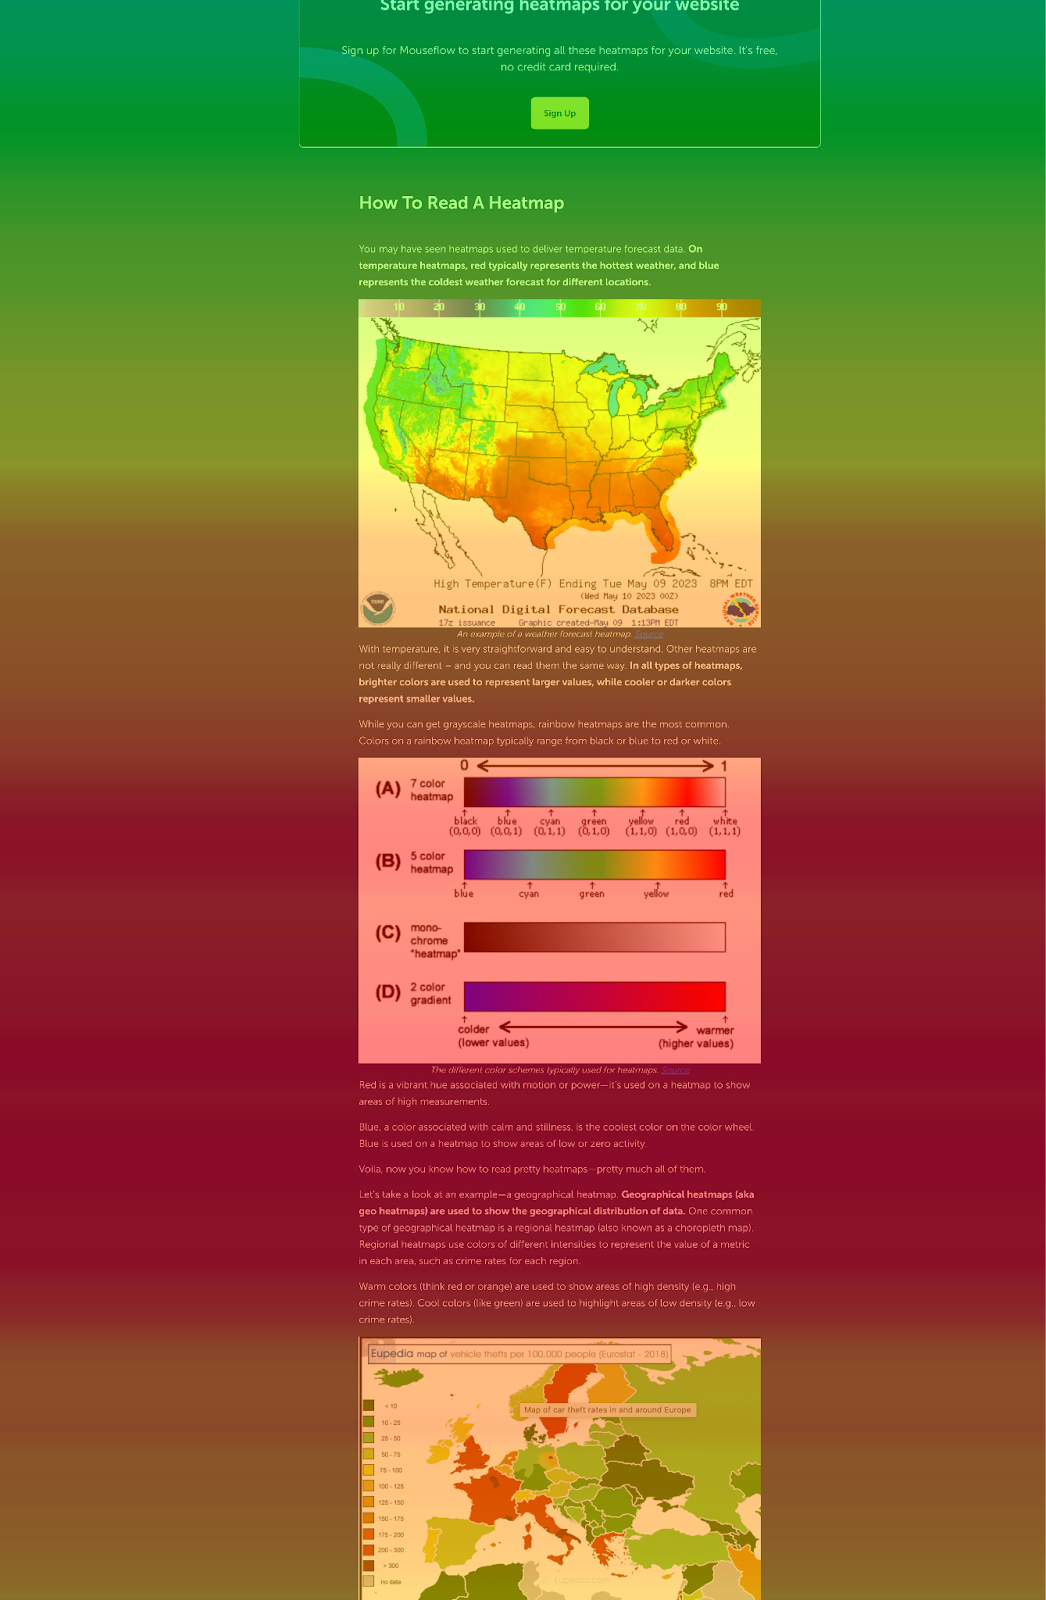
Both tools are GDPR-compliant, with Mouseflow hosting data in the EU and Fullstory in the US. Depending on your data residency requirements, one may suit your business better.
Is Mouseflow or Fullstory better for your team?
Choose Mouseflow if you:
- Need fast, out-of-the-box insights with minimal setup
- Want 7 auto-generated heatmaps, form analytics, and feedback tools—all built-in
- Prefer an intuitive interface designed for marketers, CROs, and UX teams
- Work with tight budgets or need transparent pricing (starting at $39/month)
- Care about GDPR compliance with EU-hosted data
- Are focused on website projects (not mobile apps)
Choose FullStory if you:
- Have a dedicated technical team familiar with data layers and segmentation
- Need enterprise-level flexibility with revenue impact modeling
- Rely on DevTools and deep debugging capabilities
- Want event-based funnels and friction-to-revenue features (on premium plans)
- Are willing to invest $20K+ annually for customizable, large-scale analytics
In summary, Mouseflow delivers rapid value for teams that want clear answers and conversion insights without a heavy lift. FullStory provides deep customization and advanced tracking, best suited for enterprises with the technical resources to match.