Platform Overview
Discover the full suite of digital experience analytics tools
Know what your users are doing, what they need, and most importantly, what you need to convert them.


See exactly what your users are doing, from a single user to a segment to all of them
Watch replays of your users’ sessions and ask Mina AI exactly what they do and don’t do.
Explore Session Replay and Mina AI
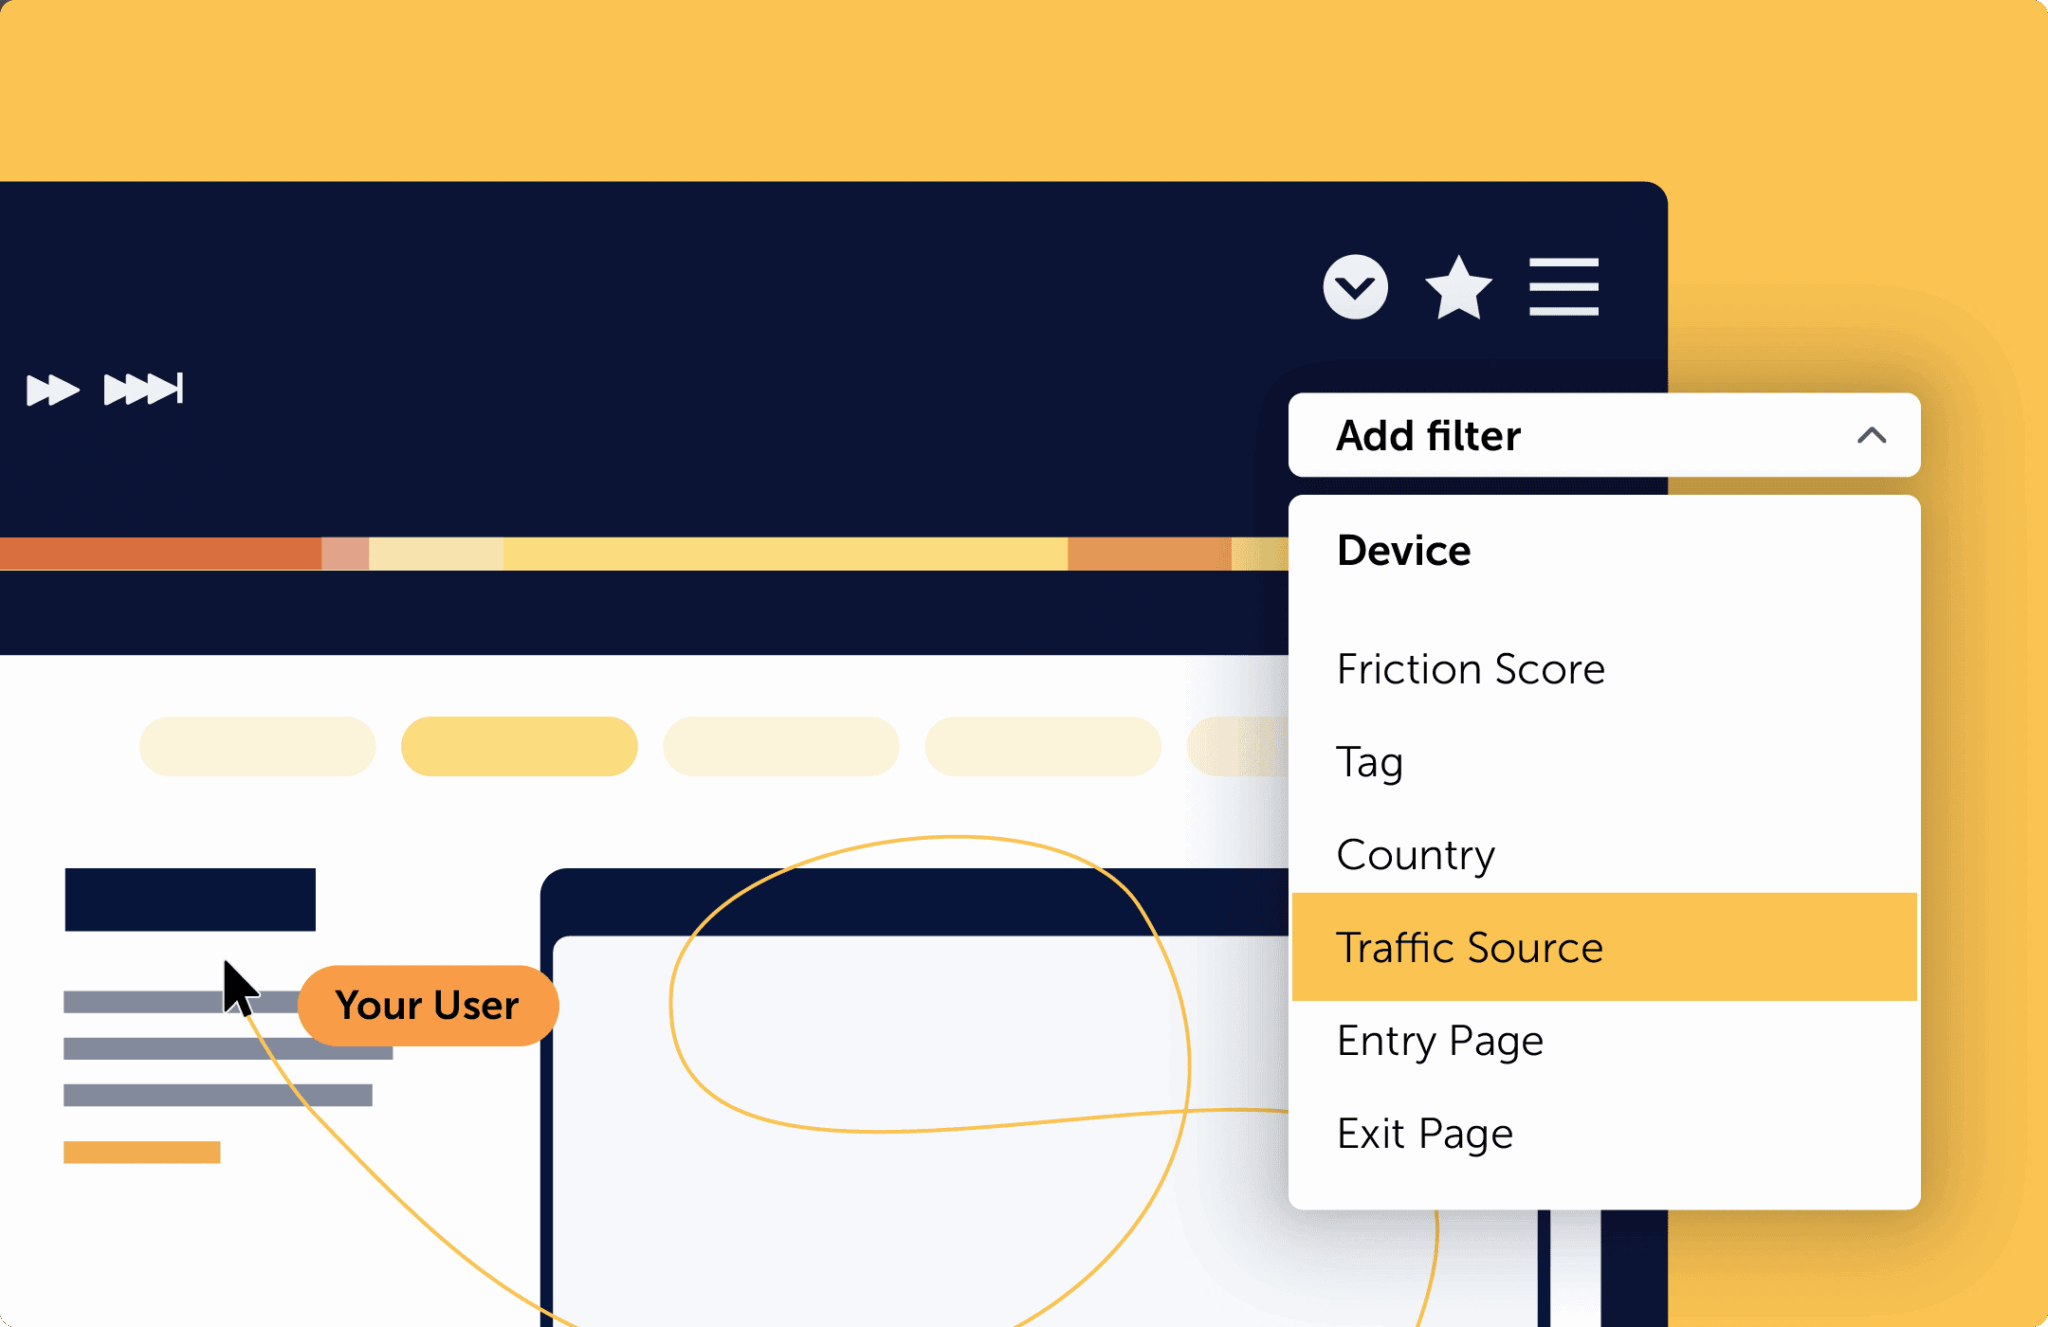
Discover where users click and scroll, when friction happens, or compare two heatmaps in a split view.
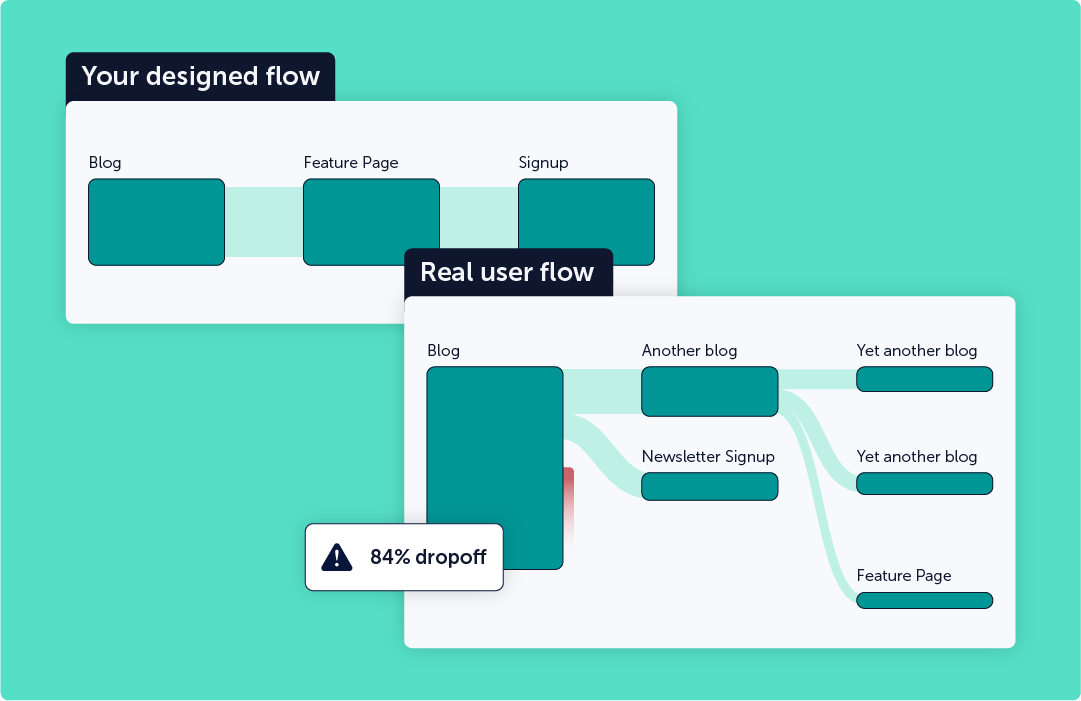
Understand the full journey, spot drop-offs and detect friction
See the step-by-step journey that your users take, when they drop off, and what areas to optimize first with our Journey Analytics.
We automatically score your users from very unhappy to happy based on their behavior. Easily filter for friction and spend your time and budget where it matters.


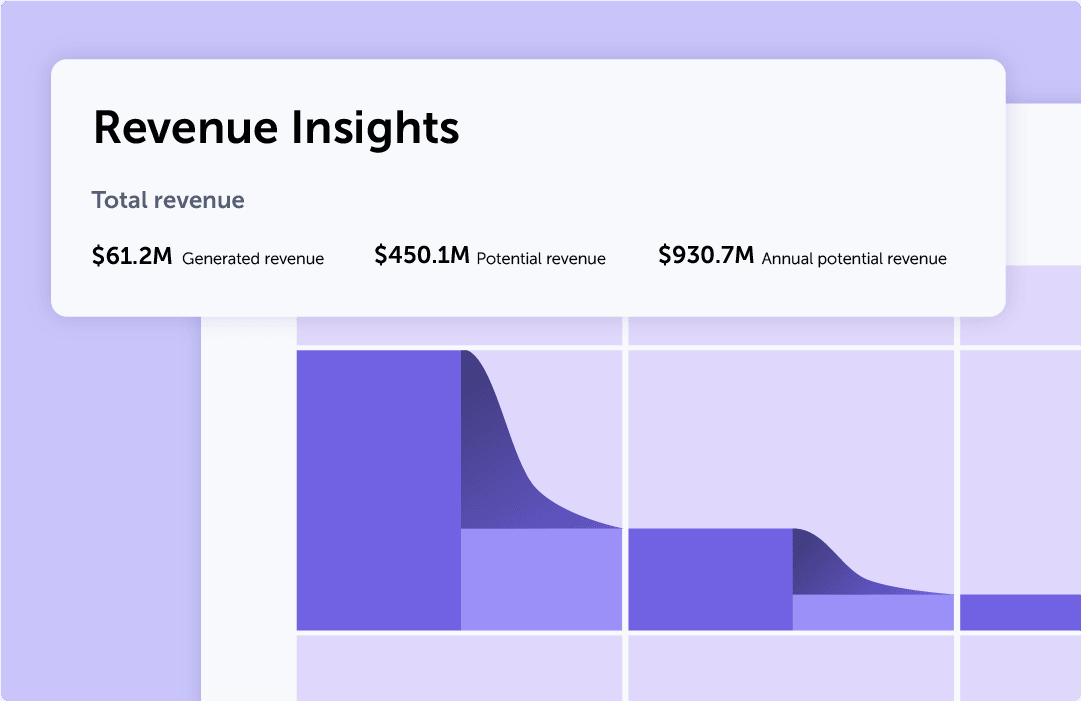
Analyse your funnels and discover revenue insights in seconds
From setup to reporting, our funnels are quick and easy to use. With their predefined steps, it’s easy to see where the biggest drop-offs happen, and with revenue insights, you’ll be able to make data-informed decisions like never before.
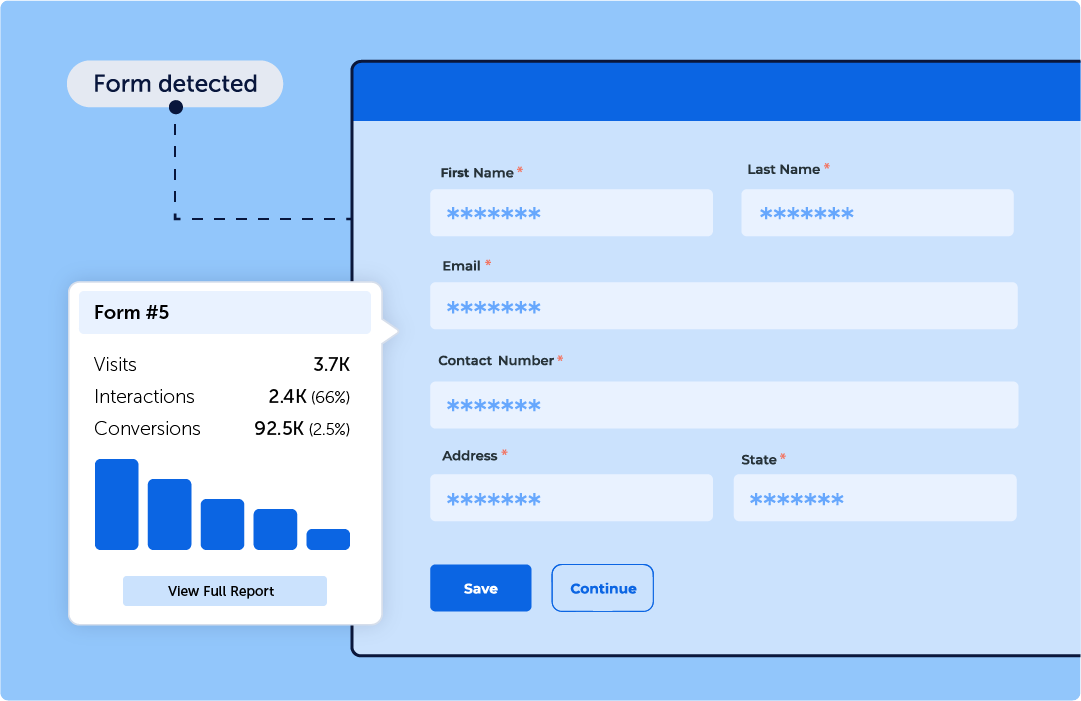
Optimize your forms & directly ask your users for feedback
Even a single form field can mess up your whole flow – quickly analyse which fields makes users drop off and see those conversions soar.
Get feedback where and when it matters most. Our custom, interactive surveys allow you to target a specific audience in seconds.


Discover revenue-driving user insights with ease
See how users interact with your site and spot friction early.
Schedule a demo or sign up for a free 14-day trial today.
Schedule a demo or sign up for a free 14-day trial today.

See how it works
Get a guided walkthrough of Mouseflow’s key features and how our top customers are using them.

Try for free
No credit card required. Get full access to premium features for 14 days.