Validate A/B Tests Beyond the Numbers
Understand what users actually do in each test variation – even when results aren’t statistically significant.

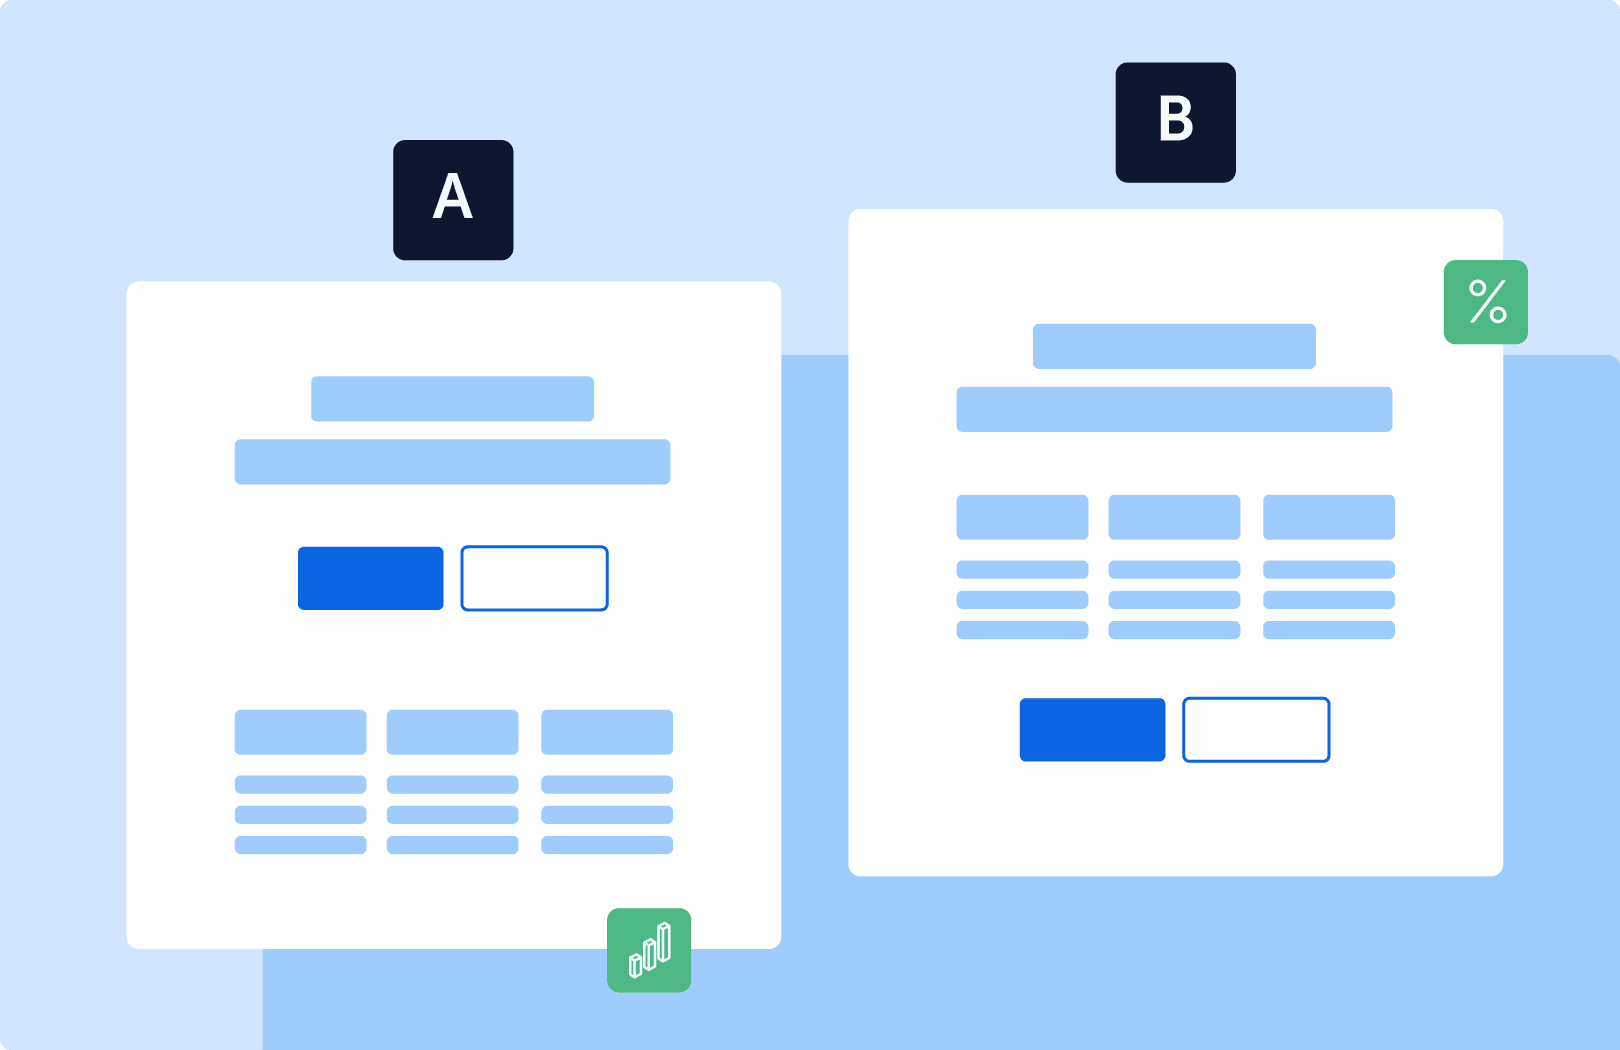
Visualize Behavior by Experiment Variant
Use Optimizely’s experiment and variation names to filter heatmaps, replays, funnels, and more.

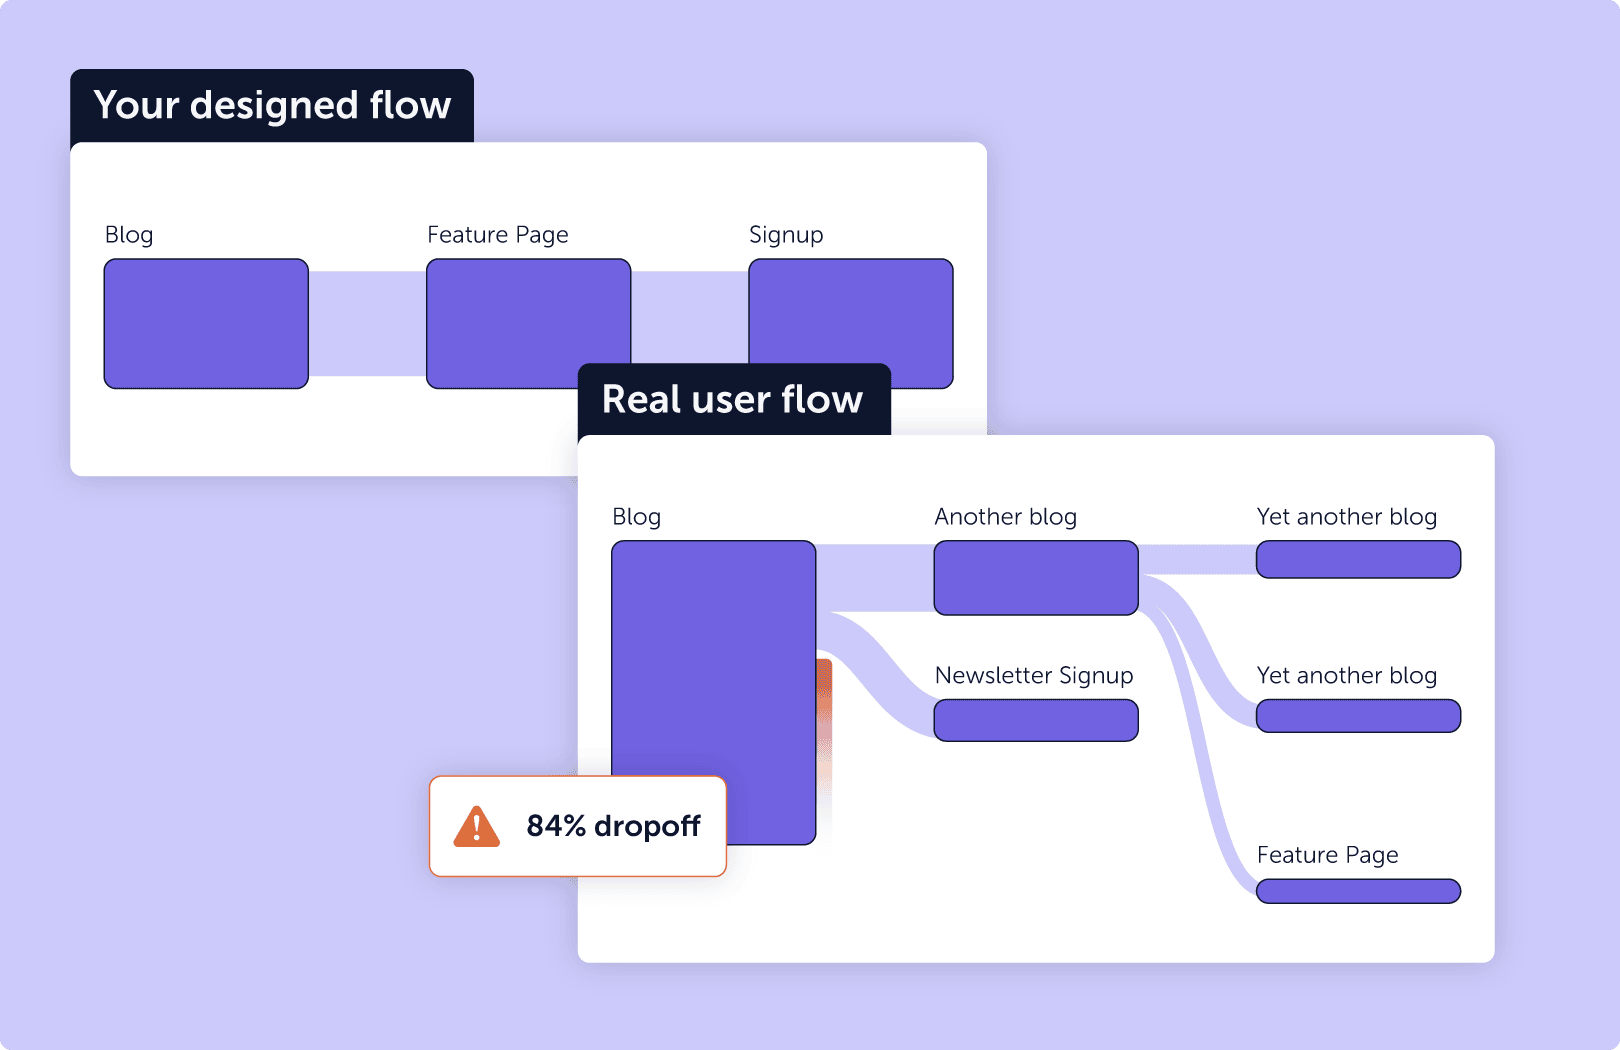
See What Moved the Needle
Understand how subtle UI or copy changes influence user paths, attention, and conversions.
Turn A/B Testing Into a Behavioral Goldmine
Testing is powerful – but numbers alone don’t tell the whole story. With the Mouseflow + Optimizely integration, you can bring behavioral context into your experiments. Each session is tagged with the Optimizely experiment and variant the user saw, letting you break down behavior by experience. Was your new CTA ignored? Did layout B reduce rage clicks? These are the kinds of answers Mouseflow reveals – helping you get more value from every test.
No More Guesswork in Picking a Winner
Not every test reaches statistical significance, especially on low-traffic or low-conversion pages. But that doesn’t mean the results are useless. Mouseflow shows you the how behind the outcome: how people interacted with the variants, where they dropped off, what they clicked, and how they moved through your site. Combine that with your analytics data to choose the true winning experience – with confidence, not guesswork.