Fintech Analytics
Customer Analytics & Behavior Insights for Finance & Insurance
In finance and insurance, every click tells a story. Mouseflow reveals the real behavior behind user engagement, helping you optimize what matters and build trust with every interaction.
Book a demo
1-1 personalized gold
Take an interactive tour 

22% increase
in conversion rate for Curative by optimizing high-value flows with Mouseflow.
Read Curative's Story22% increase
65% more form submissions
after mapping and refining user journeys for employer and broker audiences.
Explore the full journey65% more form submissions
78% increase
in conversion rate for MEGABAD after reducing checkout friction.
Read MEGABAD's story78% increase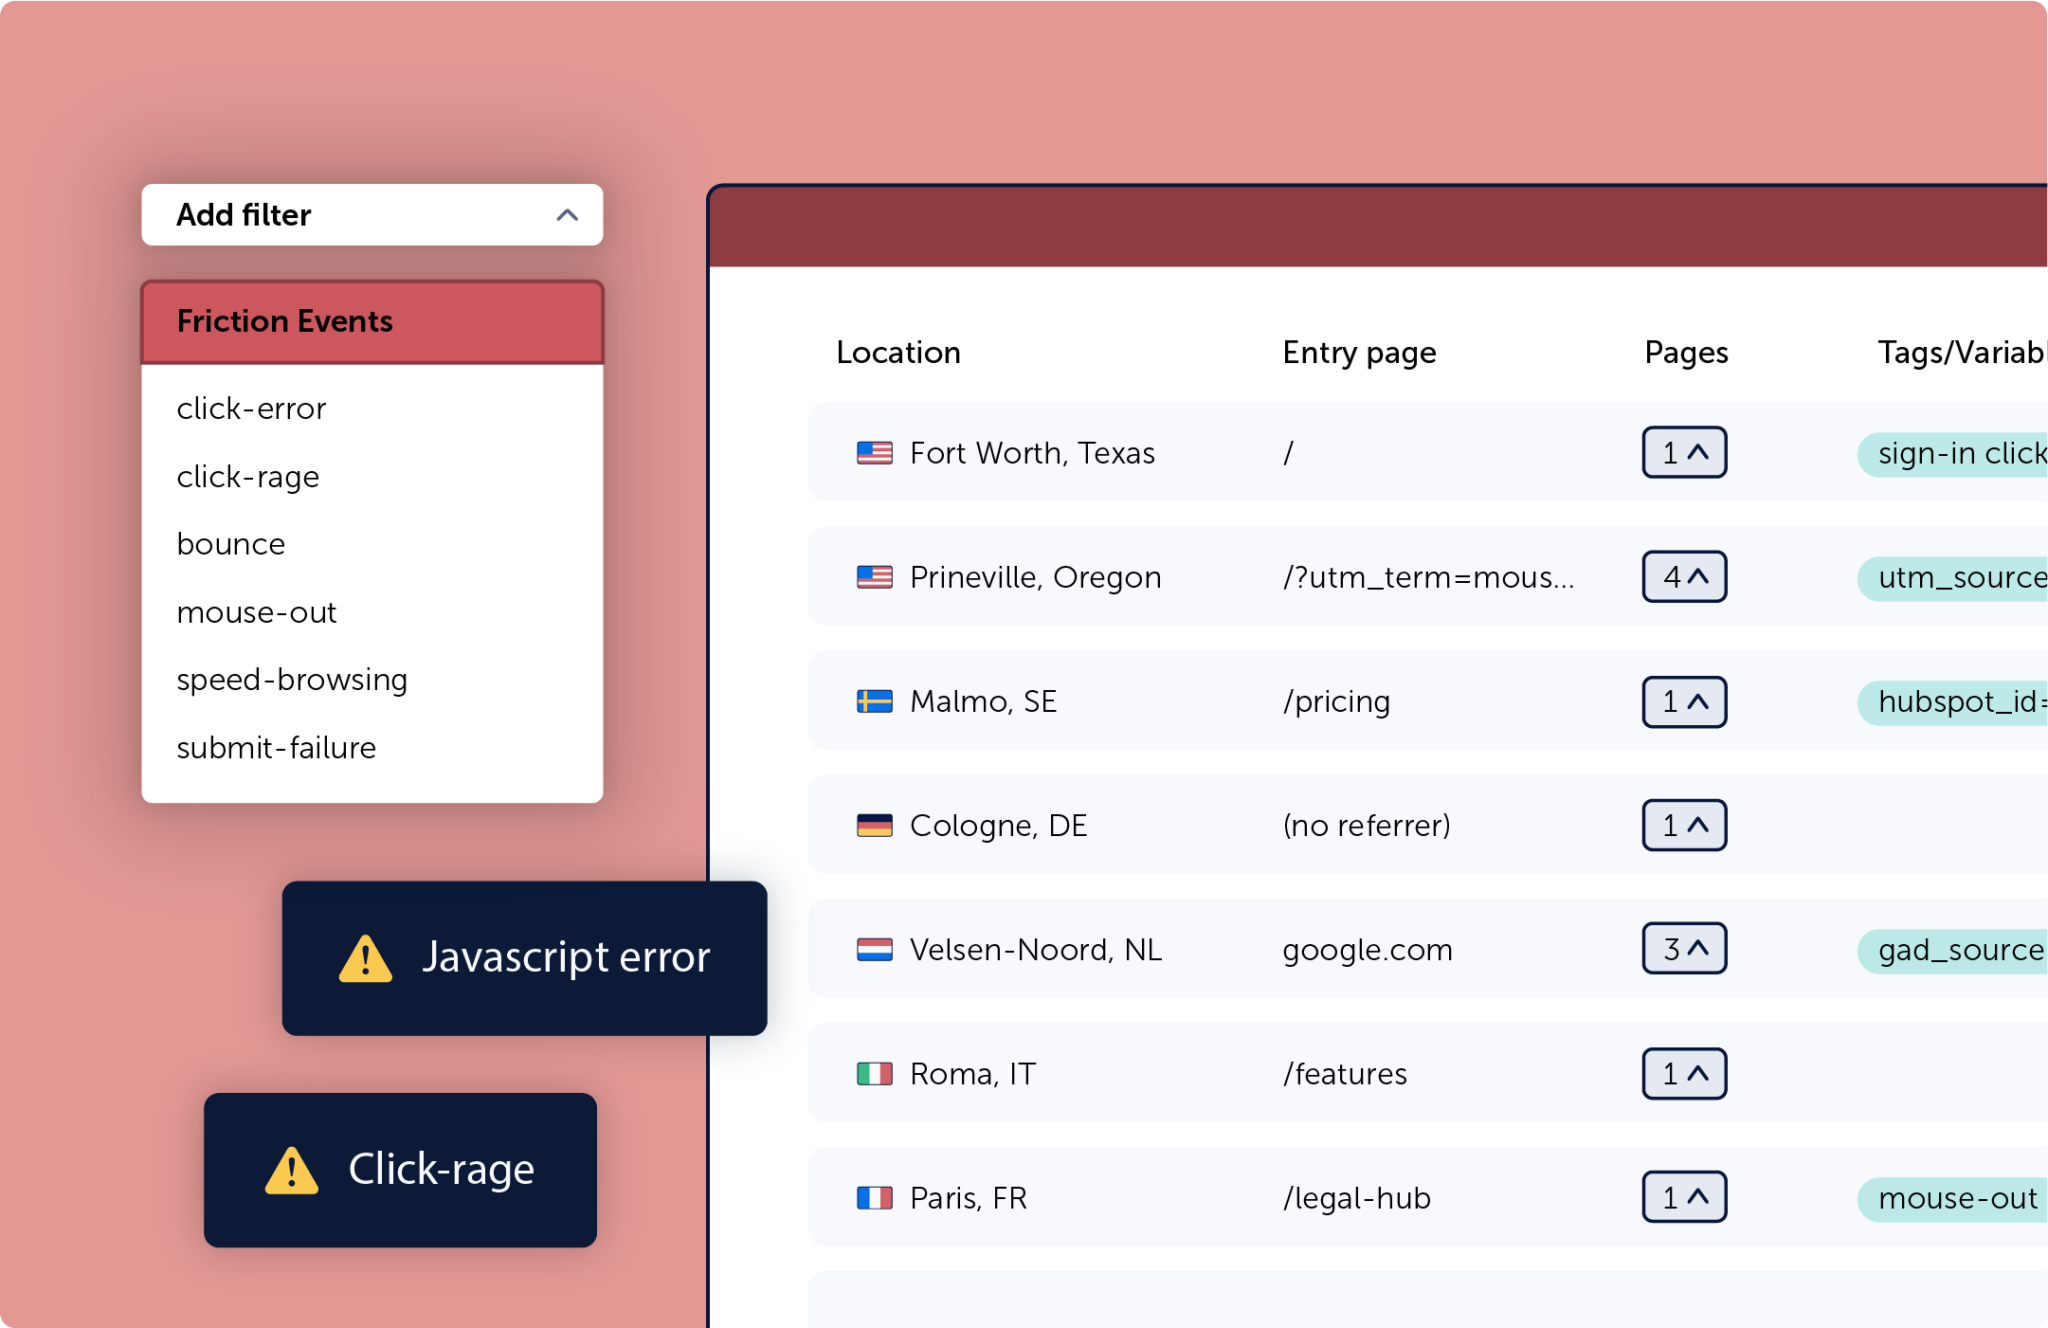
Spot friction where trust and revenue are on the line
When users apply for coverage, seek quotes, or compare financial products, confidence matters. If a page feels slow, overwhelming, or doesn’t feel secure, they leave without warning.
Mouseflow helps you identify the exact steps where users hesitate or abandon. Track behavior on pricing pages, sign-up forms, and logins to fix blockers before they hurt conversion. Whether it’s banking or insurance, trust starts with a great user experience.
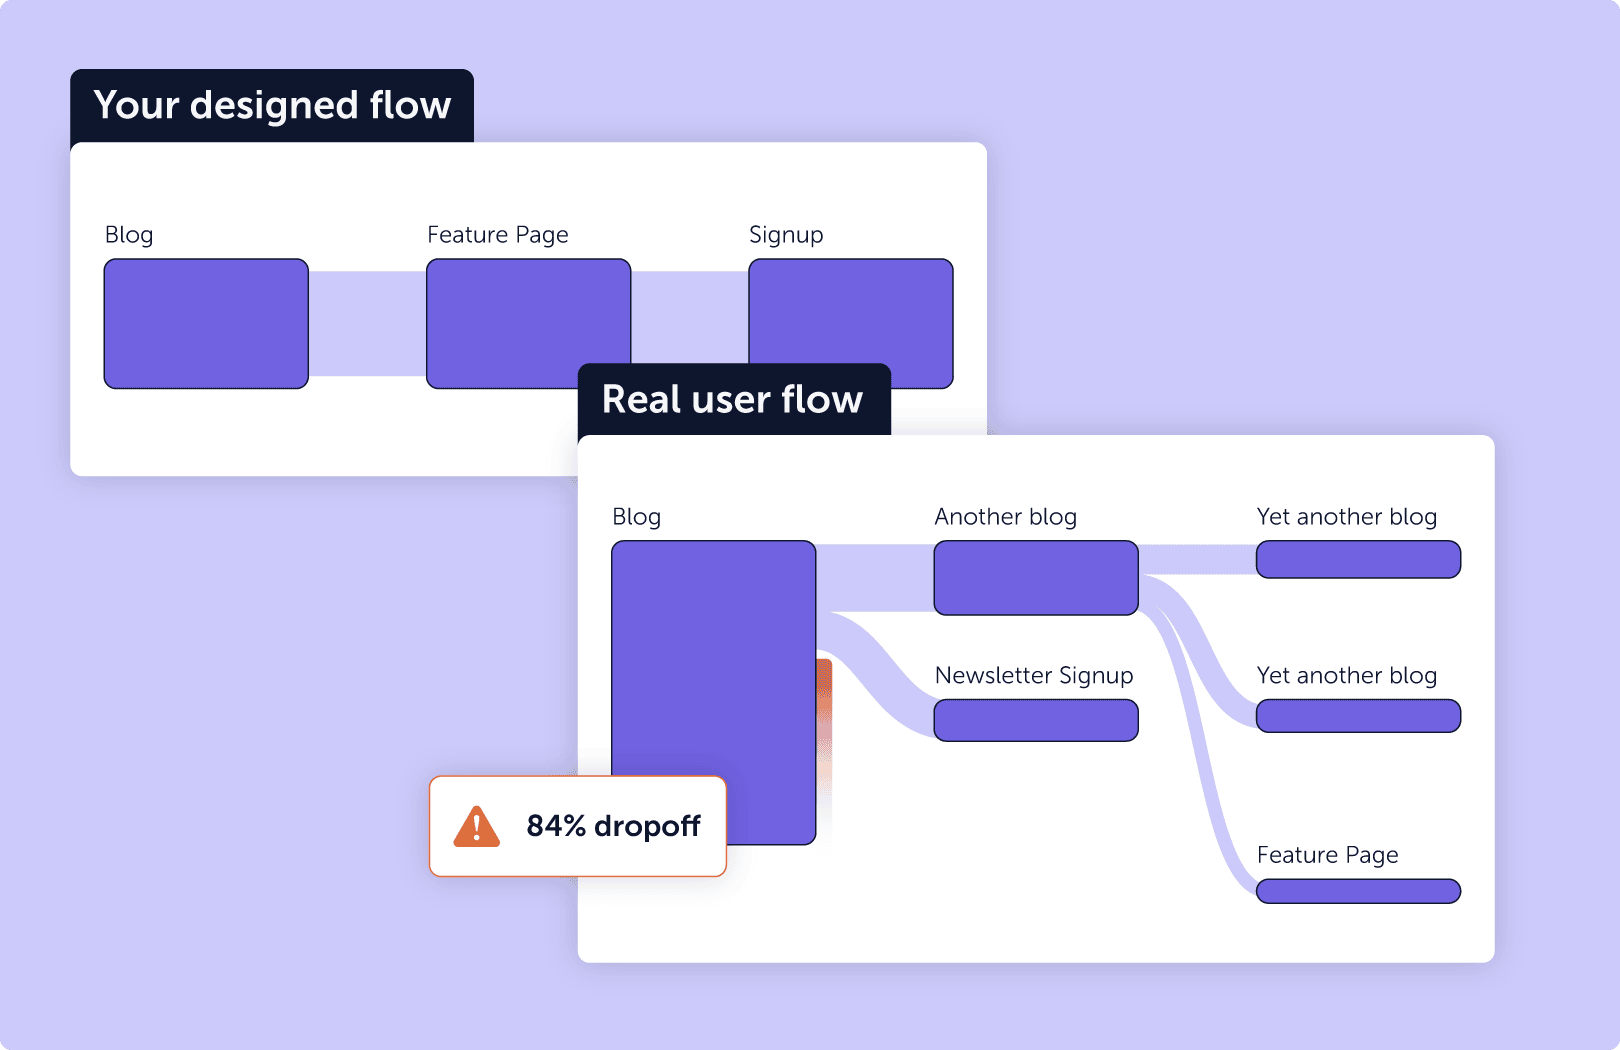
Map the full customer journey, not just isolated events
Behavior isn’t linear, especially on financial and insurance sites. Visitors jump between support pages, FAQs, and content before applying for a loan, requesting a quote, or opening an account. If you only look at isolated events, you miss the bigger picture which can quietly lower your conversion rate.
Mouseflow’s Journey Analytics helps you see how users navigate across touchpoints. With heatmaps, you can track scroll depth, engagement zones, and attention drop-offs. Find stale content, spot high-value articles, and support journeys with more intuitive linking. Your content strategy becomes not just informative, but action-driving.
Get customer analytics without the complexity
You don’t need another dashboard. You need answers that drive action. Mouseflow provides visual, secure insights to understand how users interact with your site.
Whether you’re focused on insurance customer analytics or online banking UX, Mouseflow helps teams prioritize improvements that reduce churn, improve satisfaction, and support compliant digital growth.

Integrations
Integrate with the other industry-leading software in your stack
Mouseflow connects with the tools your finance and insurance teams already rely on. From analytics platforms to CRM and marketing systems, it fits right into your stack to help you improve digital journeys and make smarter, faster decisions.
See all integrations Integrate with the other industry-leading software in your stack


Level up your finance & insurance company
FAQ
What is Mouseflow and how does it help finance and insurance websites?
Mouseflow is a behavior analytics tool that shows how people interact with your website. You can watch session replays, view heatmaps, and track user journeys to understand where visitors get stuck or drop off. It helps financial and insurance providers improve pages like quotes, sign-ups, and pricing flows.
Can Mouseflow help us understand why people abandon forms or leave mid-application?
Yes. Mouseflow shows where users drop off or hesitate on critical forms, such as quote calculators or signup flows. This helps teams in banking and insurance reduce friction and improve conversion rate optimization and overall form performance across the site.
What’s the value of customer analytics in insurance & finance?
It reveals how policyholders and prospects behave across your website. These insights help teams optimize journeys, claims pages, and support portals, leading to higher engagement and conversion.
How is Mouseflow different from Google Analytics?
Google Analytics provides metrics while Mouseflow goes deeper by showing real user behavior. With session replays and heatmaps, teams in banking and insurance can uncover exactly what users are doing and why. This makes Mouseflow a better fit for customer analytics in banking and improving the user experience across insurance platforms.
Can I track how users move between pages, like from landing pages to FAQs to forms and educational content?
Yes. Mouseflow’s Journey Analytics reveals how users move through your site, not just the pages they visit. It’s especially valuable for analyzing complex online banking user experiences or navigating lengthy insurance comparison flows, where understanding drop-off points and behavior patterns is critical.
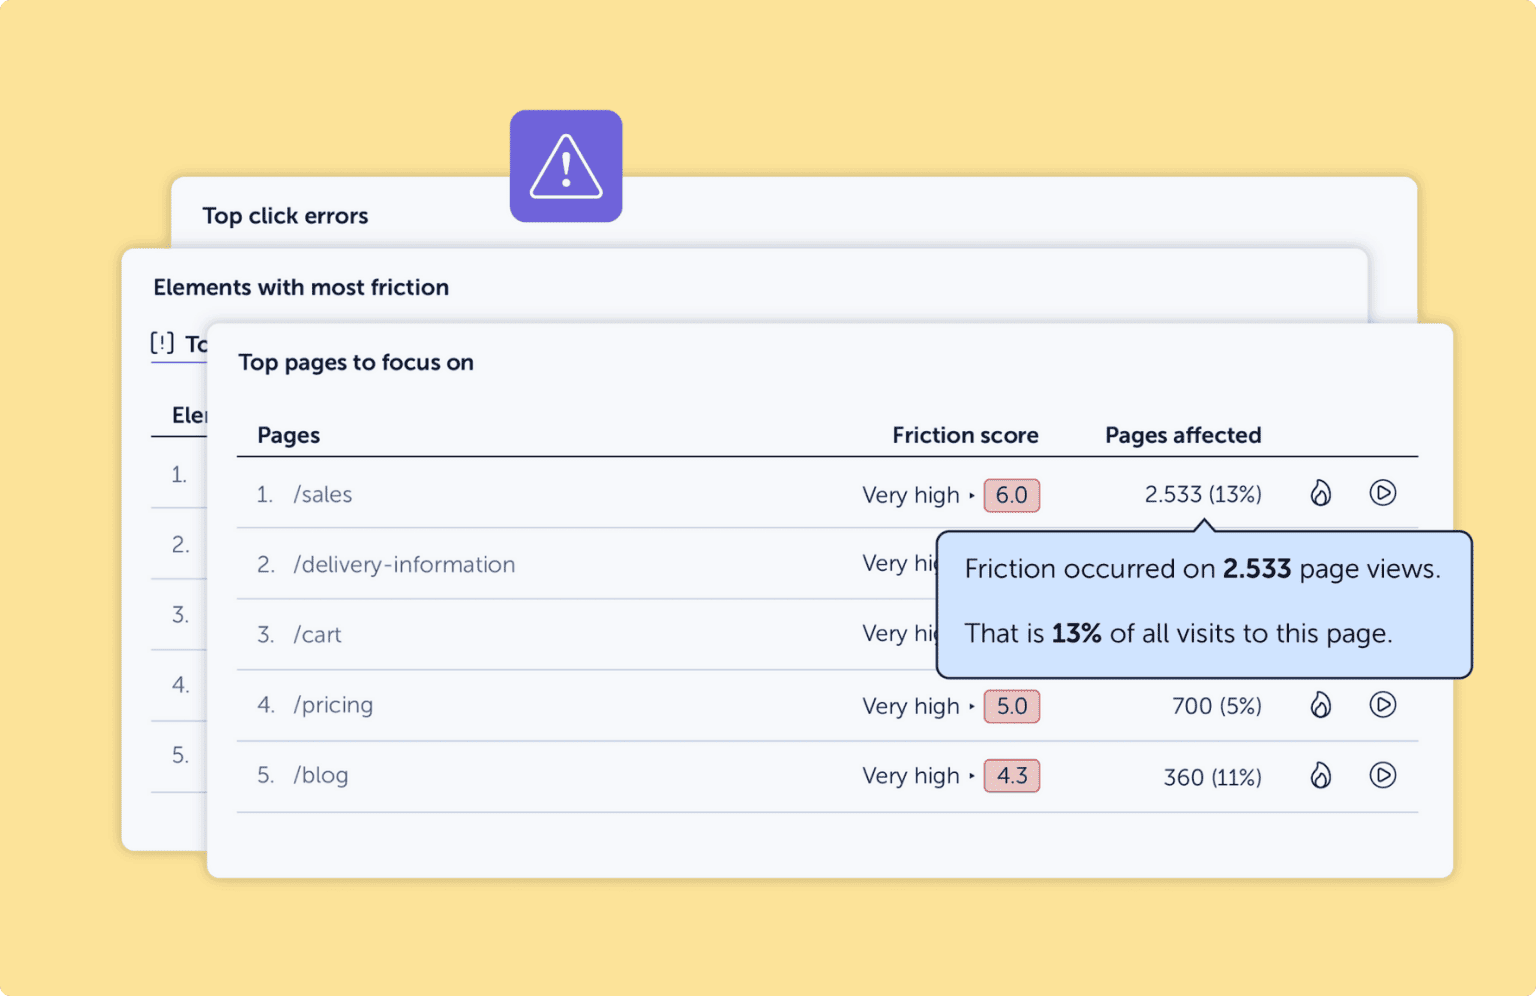
How does Mouseflow help with content performance?
Mouseflow tracks scroll depth, attention zones, and clicks – helping teams spot outdated or underperforming pages. With these insights, you can enhance support content, blog posts, and landing pages to boost user education and drive better results in finance website optimization.
Will Mouseflow help us improve paid campaign results?
Absolutely. You can segment traffic by campaign, keyword, or source to see which users engage or bounce. This enables better conversion rate optimization for financial services, helping you double down on high-performing campaigns and eliminate spend on traffic that doesn’t convert.
Is Mouseflow useful for quote tools or pricing calculators?
Yes. You can track how users interact with any element on your website. Mouseflow shows whether people complete them, where they get stuck, and if they leave before finishing.
Can I use Mouseflow for user journey mapping across different audiences?
Yes. Mouseflow lets you track how different audiences, like customers, brokers, or partners navigate your site. You can filter by user type, traffic source, or behavior to see how each group interacts, even when journeys are non-linear. These insights support banking customer analytics and help you tailor digital experiences for every audience segment.
Is Mouseflow secure and compliant for finance and insurance?
Yes. Mouseflow offers privacy features such as keystroke masking and field blocking to support your compliance with the GDPR and US privacy laws. It can be safely used in regulated industries without capturing sensitive data. We also sign a DORA Addendum with Enterprise Customers subject to the Regulation.
How fast is Mouseflow to implement?
Most teams are up and running in under an hour. Installation is simple – especially with platforms like Google Tag Manager – and Mouseflow starts collecting data immediately. That means faster insights for banking customer analytics and quick wins in website performance.