For better UX and Web Experience
The UX Analytics Tool for Smarter Tracking and Better Design
With Mouseflow’s UX tracking, your team sees what worked, what failed, and why – so you can fix fast and design smart.
Book a Demo Create free Account
No credit card required


Checklist
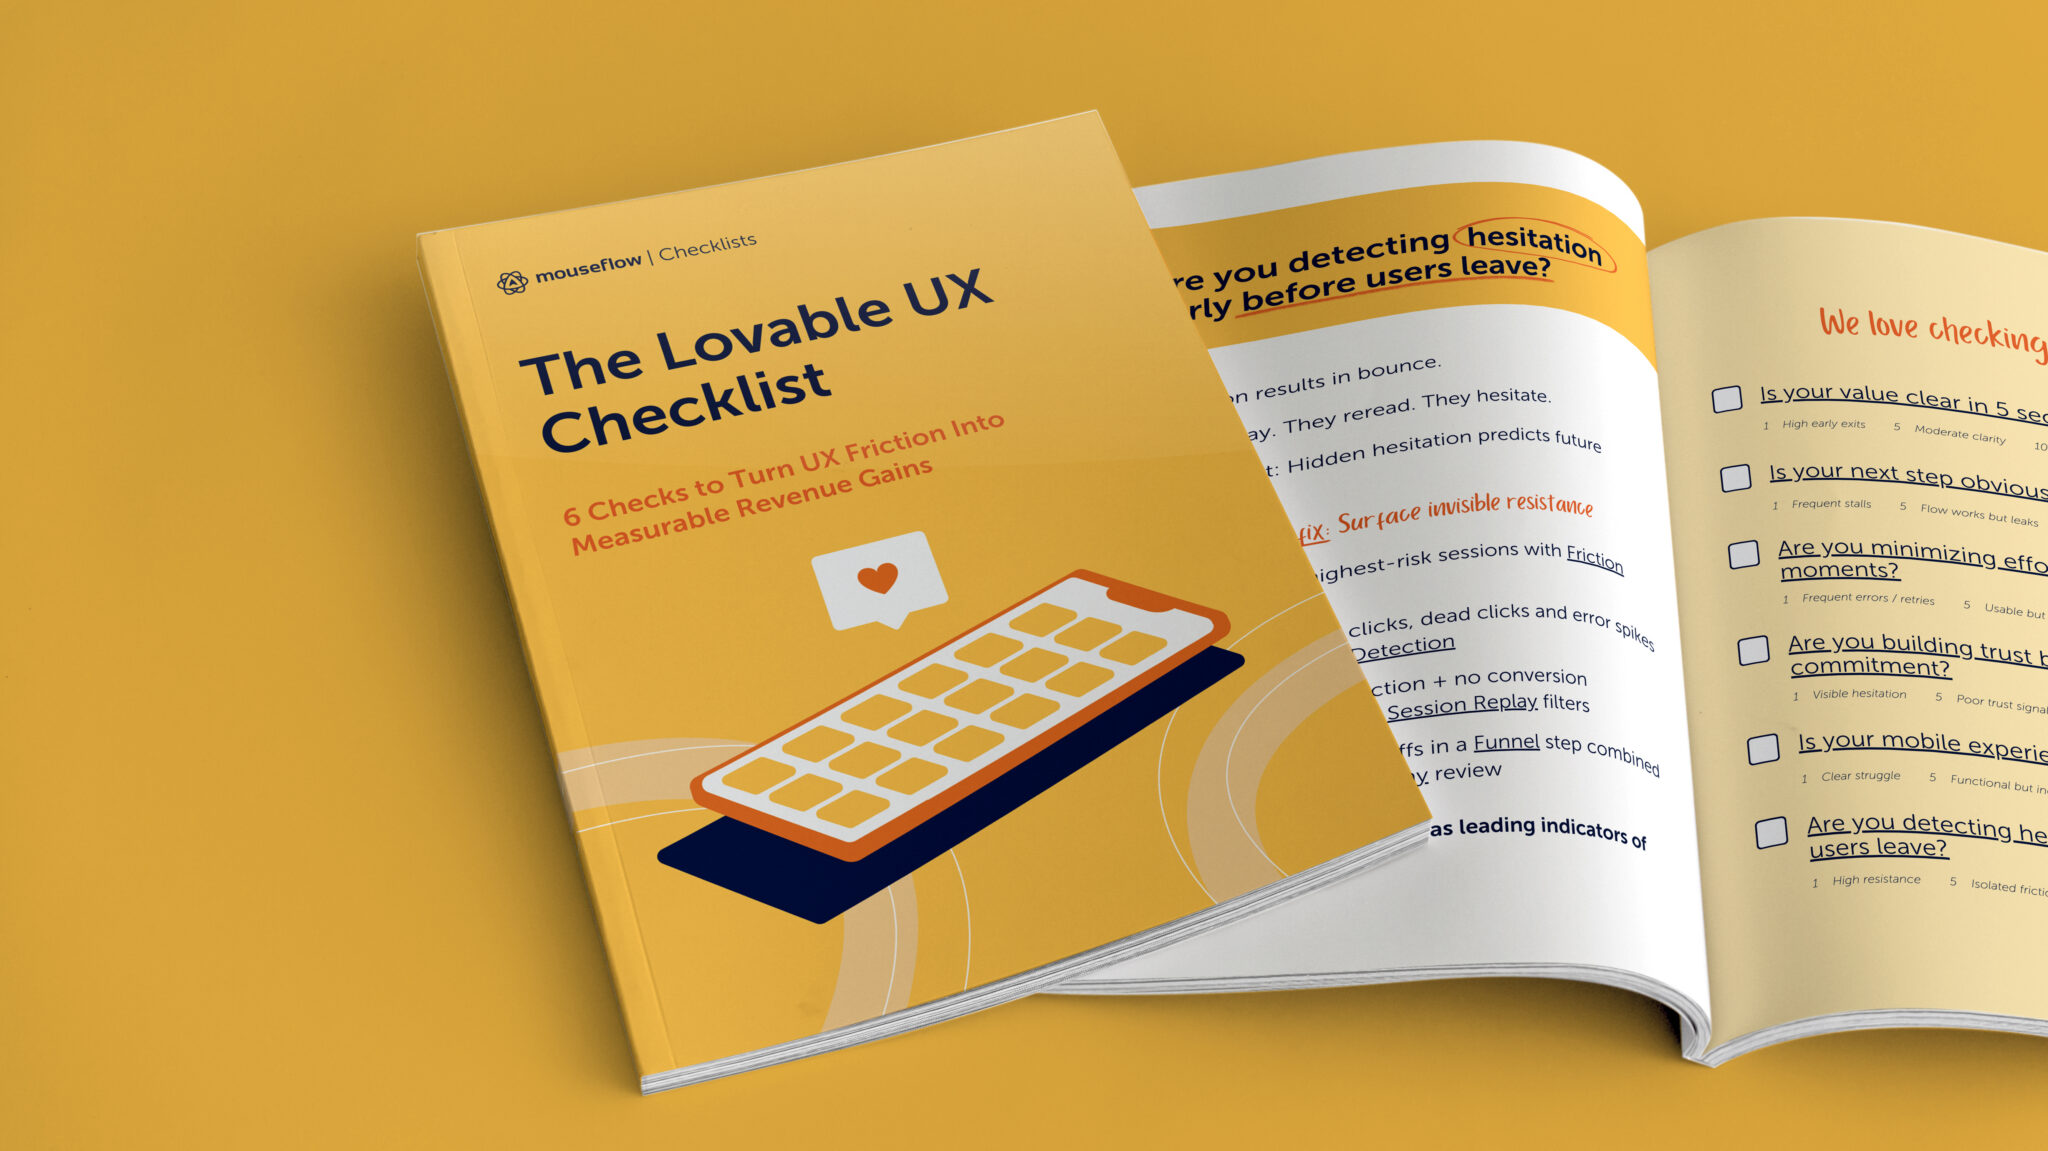
The Lovable UX Checklist
This guide helps teams move beyond surface-level metrics and understand what users actually experience on their website.


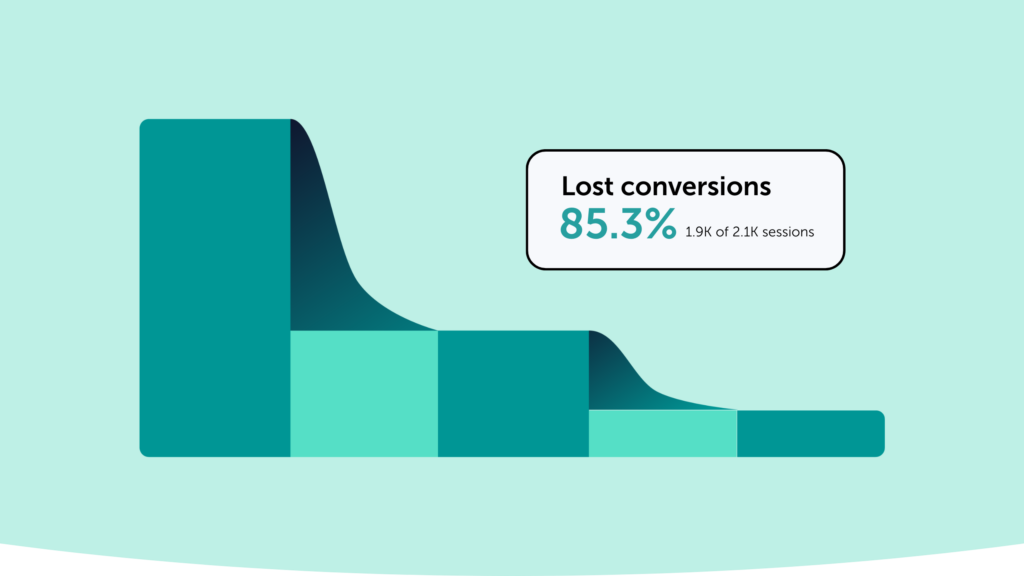
See Why Shoppers Abandon Carts
Watch real sessions to uncover friction and fix cart abandonment.


Try for free
It’s free, no credit card required. Get full access 14 days.
Mouseflow Insights and Assistant
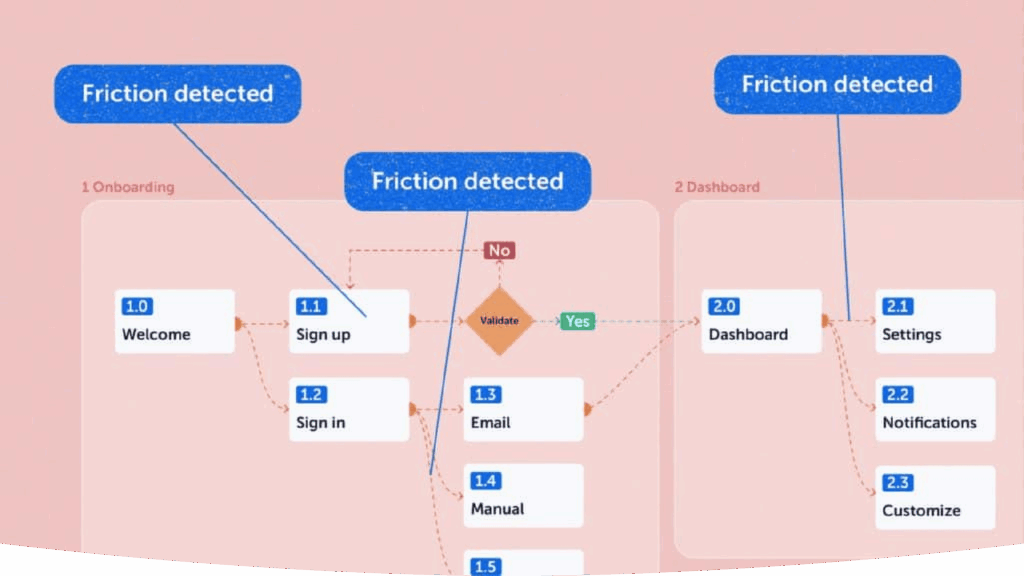
Mina AI, Your Instant Insight Engine for User Behavior
Turn session recordings into instant, actionable insights with AI that works automatically with your analytics, understands natural language questions, and surfaces user friction and behavior patterns in seconds.
