




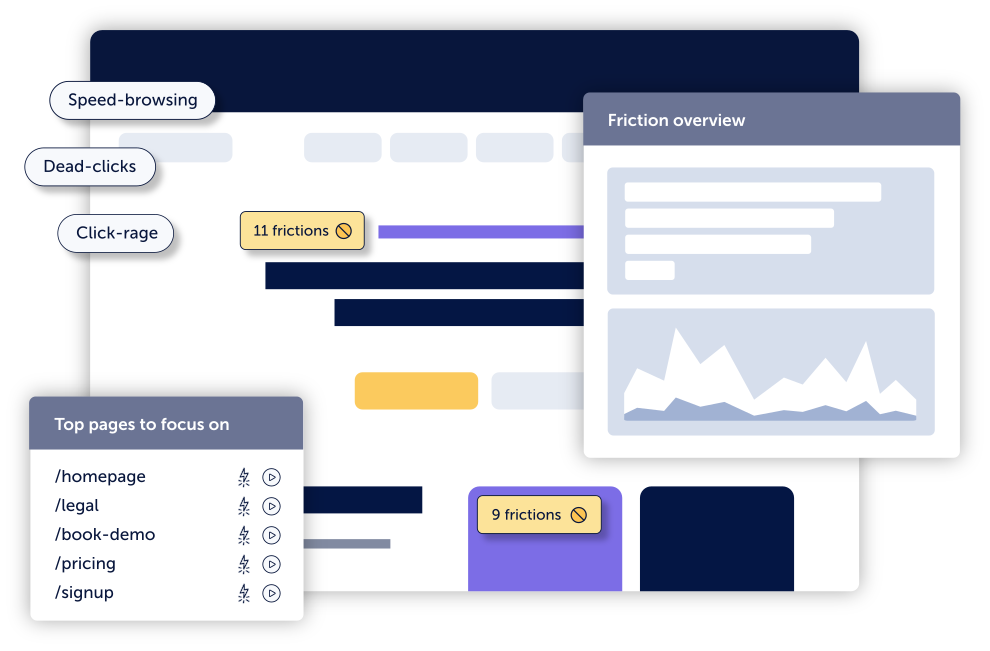

Track key friction events across every session as they happen, visualize them directly on your site, and align with the team on improvements. No manual setup required.

Even just a 1-second delay in load time can kill your conversions by 7%. See exactly where frustration is happening, and stay organized with the fixes that matter most.

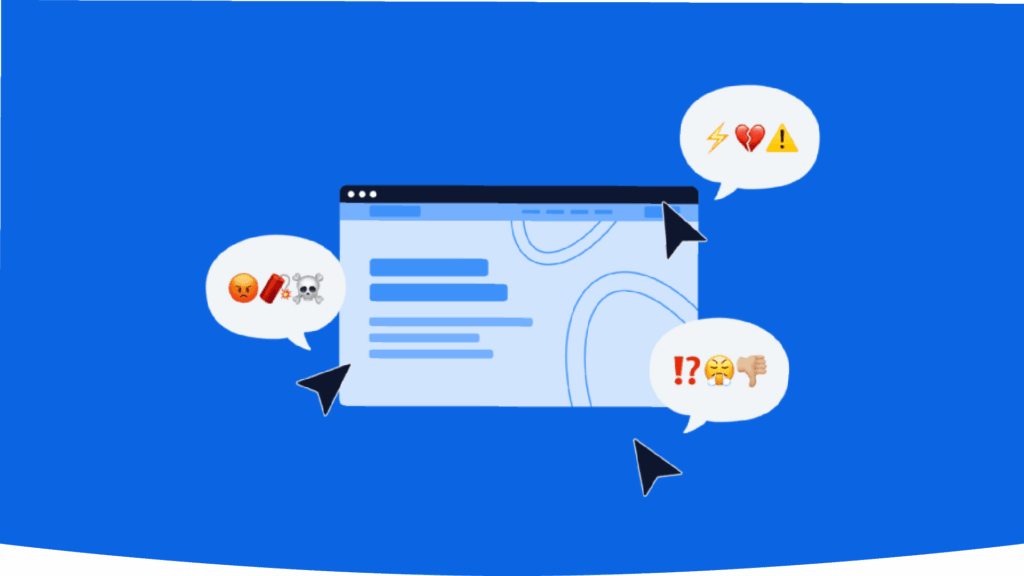
Get notified whenever we detect rage clicks, dead clicks, or error clicks – so you can eliminate confusing design before it drives visitors away.
Click errors happen when users click on buttons or elements on your site that might be broken or malfunctioning.
Click rage usually signals frustration and a repeated attempt to interact with something unresponsive.
Dead clicks highlight areas where users may be confused or disappointed by unresponsive elements.
A 404 error is a “Not Found” HTTP status code that occurs when a requested webpage can’t be located and can negatively impact SEO.
Bounce events track sessions where a page is viewed but no interaction takes place before exit.
Speed browsing is detected when a user rapidly clicks through multiple pages or actions in quick succession.
A customizable tag that gives you the flexibility to apply to any event that you consider a sign of user friction.
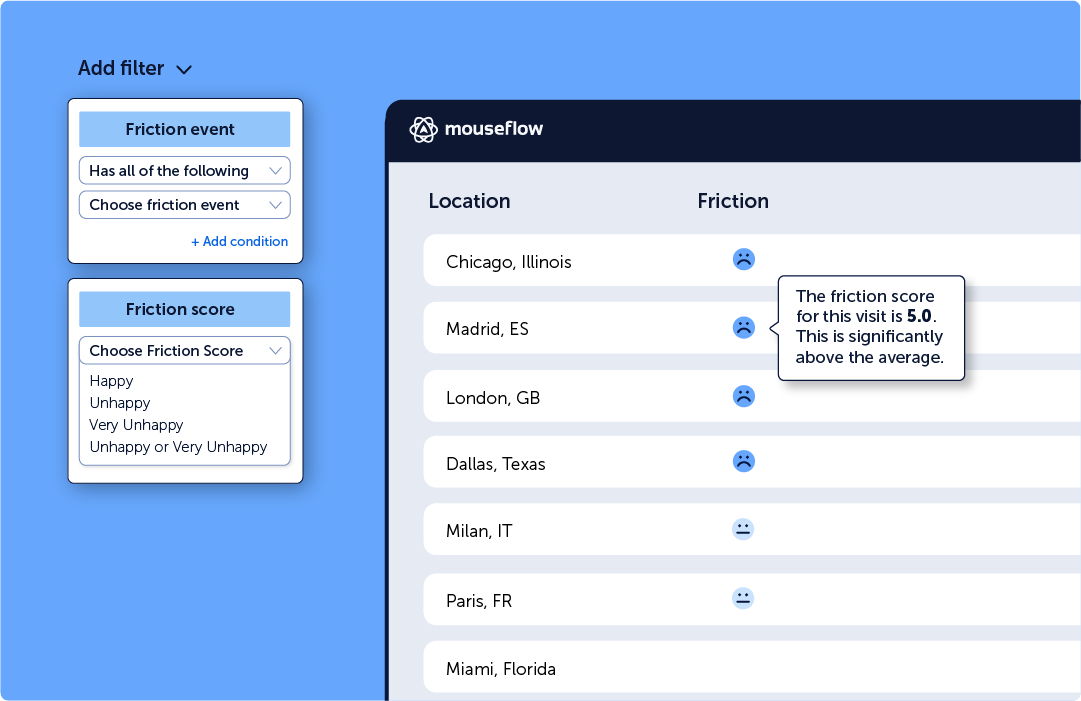
Friction is automatically detected and attached to all our features, highlighted in session replay and heatmaps lists, every step of your funnels, and much more.
Filter all your data by Friction Score and Friction Events to see where issues occur, understand how they impact conversions, and focus on what matter most.
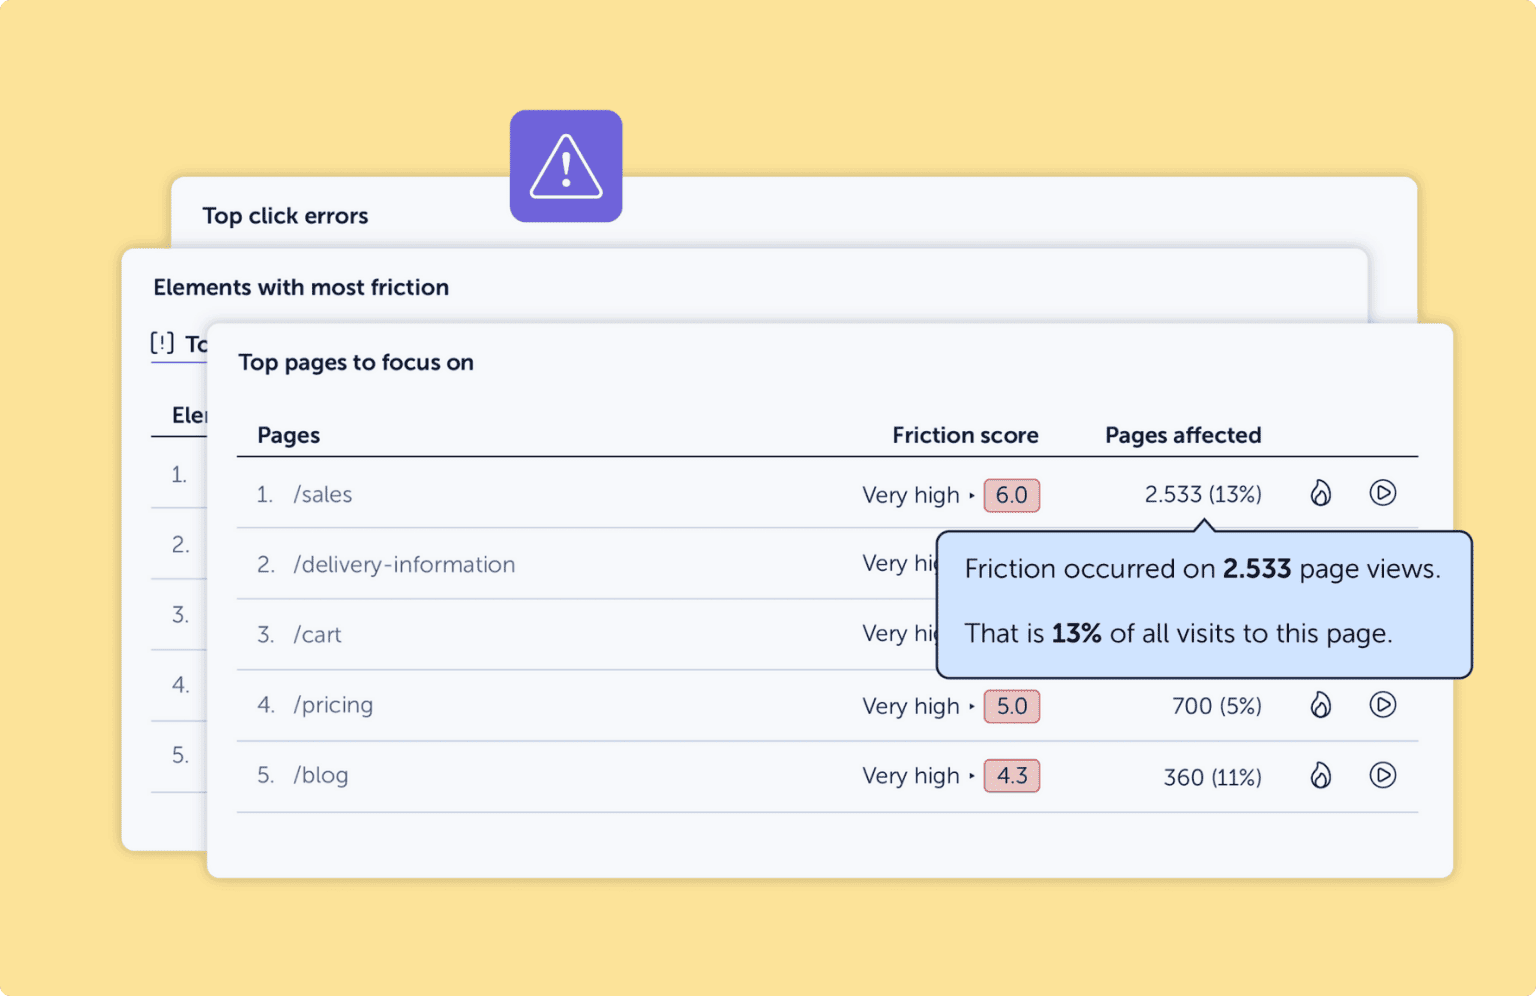
Get a clear snapshot of where users struggle most and a ranked list of the areas where fixing friction will deliver the fastest ROI.
Friction Insights combines behavioral signals, performance metrics, and AI-based recommendations into one simple view, so you can focus on changes that actually grow revenue.
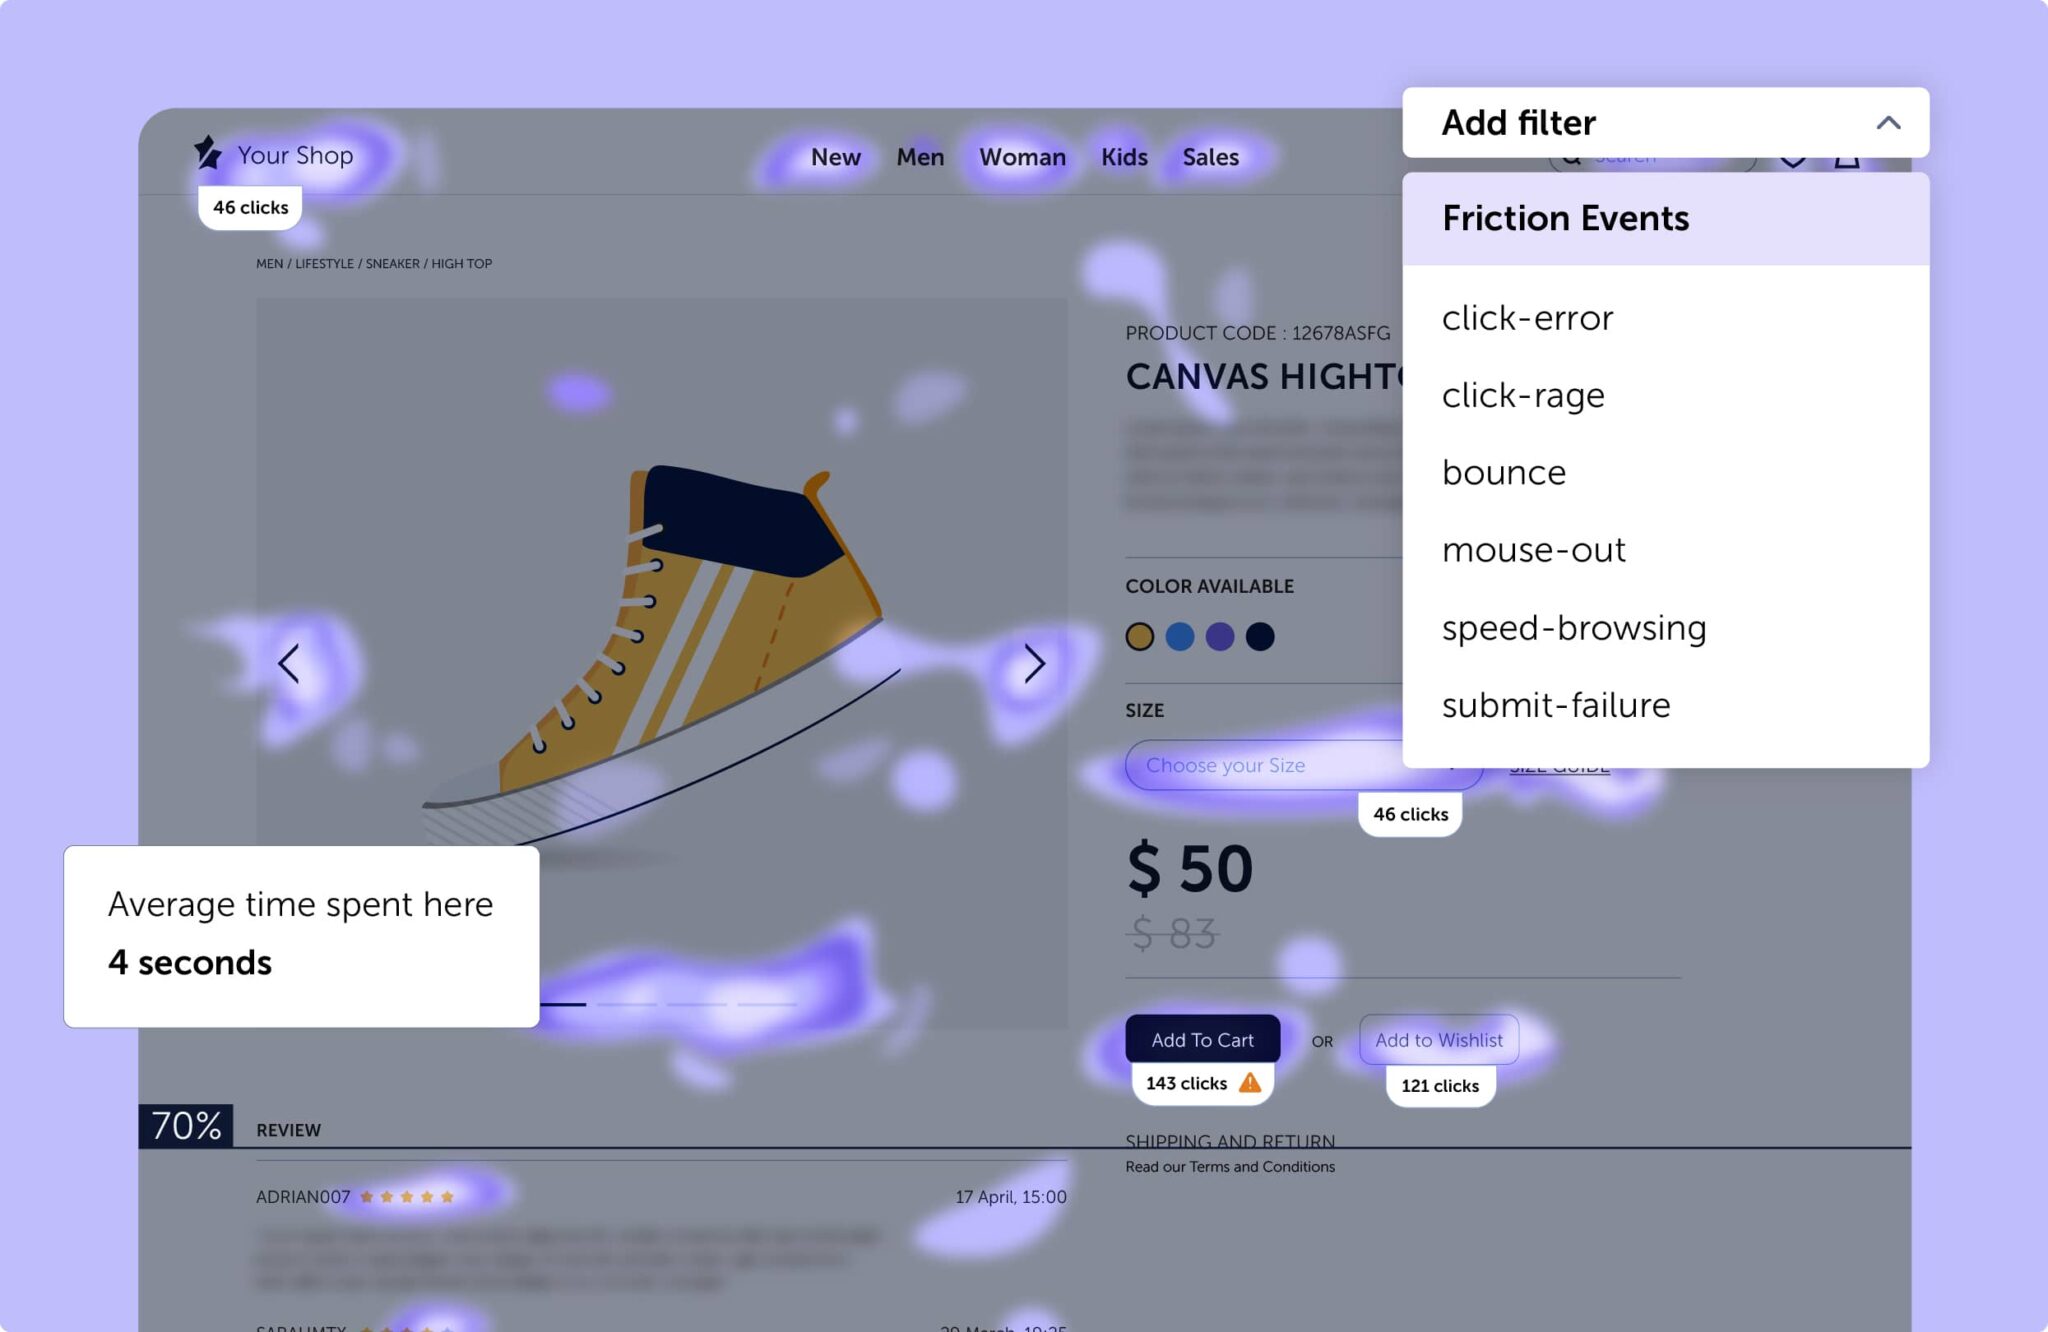
The Friction Map is overlaid directly on your website, showing you where friction events like rage clicks, dead clicks, and failed interactions happen in real time. By combining dashboard data with a visual heatmap, you don’t just spot the symptoms, you uncover the root cause, and recommendations on how to fix it.
Top-rated Behavior Analytics Platform
All-in-one tool for teams who need answers, not just data

Rated higher than Hotjar, FullStory and Microsoft Clarity


Mouseflow’s Friction Score is a proprietary value that quantifies the user’s level of frustration from their website experience. It is calculated based on the occurrence of friction events like click-errors, click-rage, bonce etc.
Friction Insights is the set of tools and visualizations that help you understand and act on those scores. This includes the Friction Dashboard (a clear overview of where and to what extent friction occurs), Smart Ranking (which prioritizes pages and elements based on impact), and the Friction Map (a visual representation of friction hotspots). While the Friction Score tells you how much frustration exists, Friction Insights shows you where it happens and helps you decide what to fix first.
You can find out more about different friction events in this article.
The average Friction Score is different depending on the type of website. You can learn the industry average Friction Score for your website type with Mouseflow.
Simply add a trend view tile on your dashboard, and on the bottom right corner you will see the Industry Avg. Friction Score for your website type. Hover over it to see how your website compares.
Knowing where you stand can help you determine if your website experience is optimized or if users are encountering too much friction.
Mouseflow highlights Friction Score for each of the recorded sessions and individual pages on your website. You can find the respective scores
If an ‘Unhappy’ smiley appears next to a session, or if a heatmap page has a high friction score, it means urgent UX issues are impacting your website experience and need to be addressed.
Fixing click-rage, dead clicks, and bounces removes friction that hurts user experience and conversion rates. Click-rage occurs when users click unresponsive elements — fixing these boosts engagement. Dead clicks mislead users into thinking something is clickable; improving UI clarity streamlines navigation. High bounce rates signal unmet expectations; optimizing content, speed, and interactivity keeps visitors engaged.
Using Mouseflow’s Friction Score helps identify and fix these blockers — one eCommerce site saw a 12% conversion lift and 18% lower bounce rate after resolving rage clicks.
Friction Score helps you identify and fix UX issues that hurt conversions. Filter heatmaps and recordings by Friction Score to spot high-friction sessions, pinpoint frustration hotspots, and analyze funnel drop-offs. Combine this with feedback surveys to uncover user insights and make data-driven UX improvements that boost engagement and conversions.
Check out the help center to find out more about leveraging Mouseflow’s Friction Scores in recordings and in heatmaps.
To reduce website friction, focus on clear navigation, intuitive interactions, and relevant content. Ensure clickable elements behave as expected and users can easily move between pages. Regularly review your site’s Friction Score to spot and fix UX issues that impact engagement.
You can find out more about the website navigation best practices that reduce website friction on our blog.
Eliminating website friction points and thus reducing the frustration can help you create a better user experience for your users. A better user experience means that it’s easier for the users to achieve their goals on your website.
If your goals are aligned with the users’ goals, improving the website Friction Score helps you drive conversions to signups, demos, cart completions, etc.
Different behavior analytics tools use different names for the score they calculate based on the various website friction or user frustration events that get recorded during a session. The way the score is calculated also varies, so the numbers from different tools cannot be directly compared. Different scores take different events into account. Mouseflow uses its proprietary technology to calculate Friction Score.
Friction Score, digital experience score, frustration score – or whatever the other names for it are – is a value that gives you an idea about how smooth the user’s experience is while browsing your website.
Filtering out recordings or heatmaps with high friction or low can highlight the pages or elements where the users have the most issues, and where their frustration level was quite high.
Mouseflow’s Friction Score is based on a variety of friction events, taking into account not only click-rage and scroll patterns, but also events such as mouse-out, speed-browsing, and JavaScript error tracking that are not considered in some other scores. This makes Mouseflow’s Friction Score a comprehensive solution to understand visitors’ behavior and the problems they face.
What really makes Mouseflow’s Friction Score stand out is that you can set up custom friction events that are most relevant to your particular website, be it facing a 404 page, custom JavaScript errors, or something else. Customizing friction events is unique to Mouseflow, and it allows you to get exactly the data you want from your users’ website interactions.
No, Mouseflow users can only see the level of Friction Score for the sites they’ve added to Mouseflow, and the industry average Friction Score for the respective type of websites. It is not possible to see your competitor’s Friction Score, and it’s just as well not possible for them to see yours.