
Ever wish you could peek over your visitors’ shoulders to see how they really explore your website?
We all look at traffic numbers and conversion rates, but those stats leave out one big piece of the puzzle: what happens in the moments between the clicks.
Are people gliding smoothly toward your CTA… or zigzagging around like they’re searching for buried treasure?
That’s where mouse movement heatmaps come in. They shine a spotlight on the hidden dance of cursors across your pages, revealing patterns that help you understand how visitors explore your content and interact with key elements.
Movement heatmaps are part of a broader set of website heatmaps used to analyze user behavior and on-page engagement. If you want a complete overview of how these tools work together, explore our guide to website heatmaps.
Curious? Let’s uncover how Movement heatmaps work and why they’re one of the most underrated secrets in website optimization.
What Is a Movement Heatmap?
A mouse movement heatmap – known as a movement map – is a visual tool that lets you track mouse movement on your website and see where users move their mouse the most while browsing.
Instead of tracing individual cursor paths, Movement Maps display density zones where many users’ cursors have hovered, glided, or shifted around. Bright colors like red and yellow highlight areas of frequent motion, while cooler blues and purples mark quieter zones.
Think of it as a heat signature of your visitors’ curiosity:
- Do they explore your navigation bar thoroughly?
- Do they hover around CTAs, unsure whether to click?
- Do they drift toward images or product details?
Movement maps make these hidden behaviors visible so you can understand your users on a deeper level.
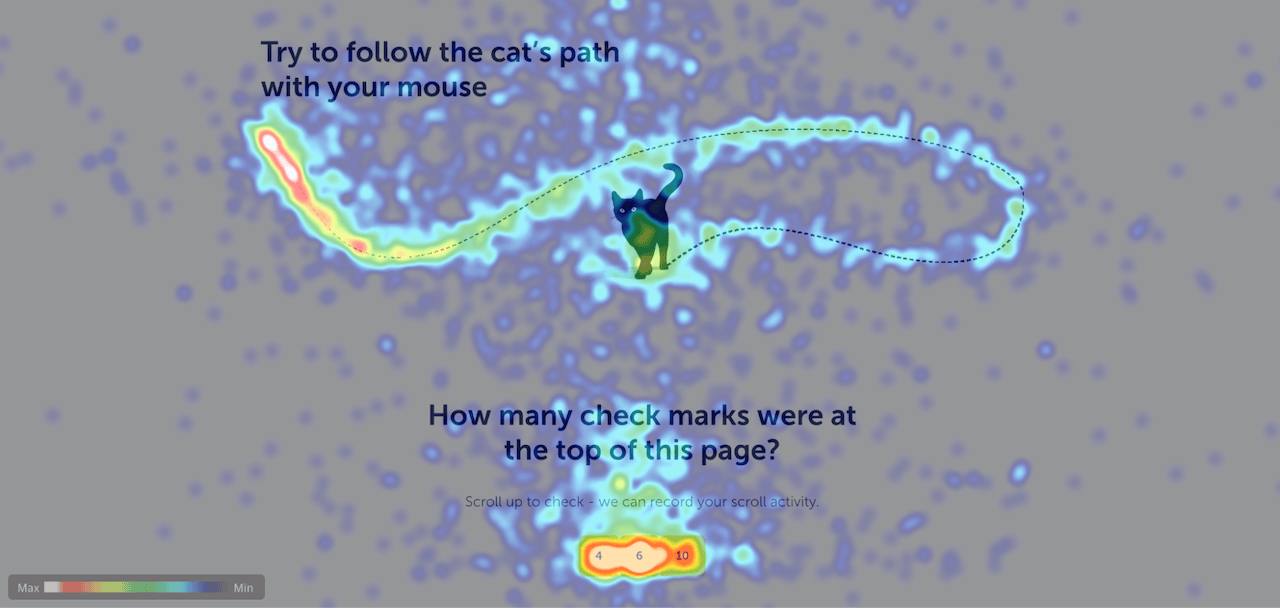
An example of a movement heatmap
The Hidden Value of Movement Maps
So why should you care about how people move their mouse? Because those subtle movements can tell you a lot about how visitors experience your website—even before they click a single button.
Mouse movement heatmaps uncover the “silent conversations” users have with your content. Smooth, steady motions across a page suggest that your layout makes sense and your messaging feels clear. But frantic zig-zags or repeated hovering might indicate confusion, hesitation, or uncertainty.
For example, if visitors keep swirling their mouse around your pricing table, they could be debating whether your offer fits their needs—or perhaps searching for more information you haven’t provided. If they hover endlessly over your navigation menu, it might signal that your site structure isn’t intuitive enough to guide them forward.
Equally valuable are the “dead zones” that Movement Maps reveal. Areas with almost no mouse movement could mean that certain parts of your page are invisible or unimportant to users. That’s a cue to reconsider whether that content belongs there at all or if it needs to be repositioned.
This goes deeper than curiosity – it directly impacts your business. Movement Maps help you answer questions like:
- Are users finding what they need quickly?
- Is anything on the page distracting them from your primary goals?
- Do layout choices guide visitors toward conversions—or create obstacles?
While click maps and scroll maps show definitive actions, movement maps shine a light on the subtle behavior that happens in between. And that’s often where the most valuable optimization insights are hiding.
Are Movement Maps Related to Eye Tracking?
A question that often comes up is whether a website eye tracking heatmap and a mouse movement heatmap show the same thing. It’s a fair question – and the answer is: sometimes.
Research indicates there’s a significant correlation between where users move their mouse and where they direct their gaze. People frequently steer their cursor toward elements they’re reading or considering, especially during tasks like comparing products, studying details, or deciding where to click next.
That said, a movement map is not a substitute for eye-tracking hardware. Eye tracking captures fleeting glances and split-second focus shifts that the mouse never reveals. But for most digital teams, dedicated eye-tracking studies are expensive and impractical. Mouse movement heatmaps provide a pragmatic, cost-effective way to approximate where attention gathers on a page—and they’re far more actionable because they tie directly to real interactions on your website.
So while movement maps aren’t a perfect mirror of eye movements, they’re an excellent tool for revealing how users physically navigate your pages and for spotting friction points before they hurt conversions.
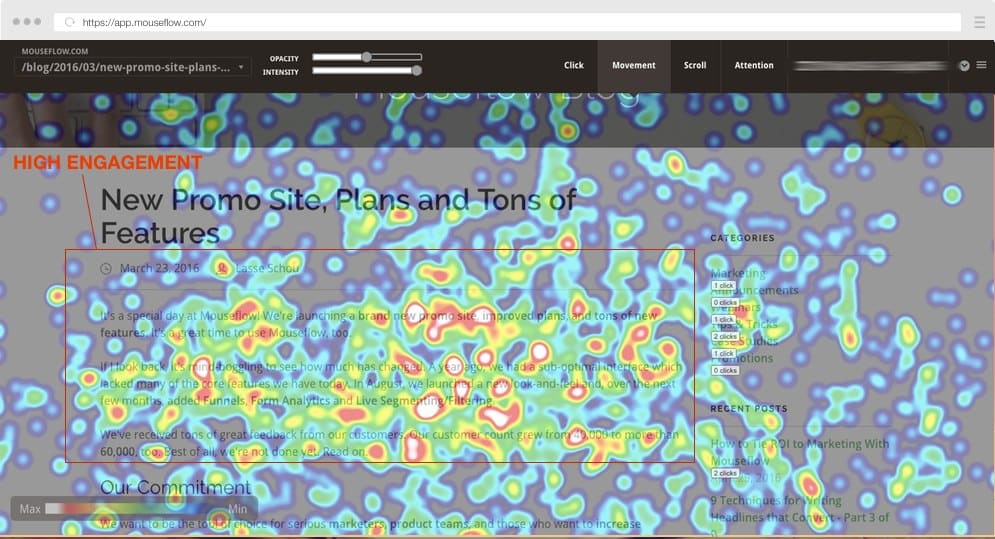
Example of movement heatmap with high engagement
How Mouseflow’s Movement Maps Turn Insights Into Action
Mouseflow’s movement maps turn visual patterns into practical insights that drive real changes.
Unlike some tools that only show static heatmaps, Mouseflow lets you segment movement maps by traffic source, country, or visitor type. This way, you can explore how different audiences interact with your pages and spot patterns that might stay hidden in broad averages.
Even more valuable is how seamlessly movement maps tie into session replays. If you spot an unexpected hotspot, you’re just one click away from watching a real visitor’s session and understanding the behavior behind the data. That connection saves time and helps you move quickly from analysis to action.
It’s important to know that movement maps are designed specifically for desktop traffic. Since they visualize how users move a physical mouse across the screen, they’re less relevant for mobile experiences where visitors tap and swipe instead. For mobile insights, Mouseflow offers other tools like click maps and scroll maps that capture taps, gestures, and scroll behavior.
Across all these tools, privacy and compliance remain a priority. Mouseflow ensures that data is gathered responsibly and in line with regulations like GDPR, so you can analyze user behavior with confidence.
For marketers, UX teams, and product managers, this means fewer blind spots—and more informed decisions about how to refine your website experience.

Use Cases and Optimization Tips
Mouse movement heatmaps become truly powerful when you connect them to concrete actions. Here are some ways businesses put them to use:
- Polish page design: Notice heavy cursor movement around complex sections? Simplify layouts to reduce hesitation.
- Test content placement: If users ignore certain areas, consider moving important content higher on the page.
- Eliminate confusion: Identify decorative elements causing unnecessary cursor activity and refine your visuals.
- Speed up decisions: Use Movement Maps after website changes to confirm whether user behavior has shifted in the right direction.
Movement Maps vs Other Mouseflow Heatmaps
Movement maps are part of a broader suite of heatmap tools designed to help you see your website from your users’ point of view. While they focus on the paths users trace with their mouse, other heatmaps offer different perspectives:
- Click heatmaps show where people click or tap on your pages.
- Scroll heatmaps reveal how far users scroll, helping you place key content.
- Attention heatmaps highlight where visitors spend the most time and engagement.
- Friction heatmaps pinpoint areas of frustration, like rage clicks or erratic movement.
- Interaction heatmaps track clicks on dynamic elements like menus, sliders, or tabs.
- Geo heatmaps display where your visitors are located around the world.
Each of these heatmaps provides a piece of the puzzle. But mouse movement heatmaps are uniquely valuable because they reveal the journey between clicks – the moments when visitors are deciding, exploring, or hesitating. They help you see not just what users do, but how they move through your pages.
Final Thoughts: Is a Movement Map Right for You?
If your goal is to understand your visitors on a deeper level—to move past surface-level metrics and uncover the subtle behaviors that influence conversions, then movement maps are a powerful ally.
They help you spot friction that traditional analytics can’t reveal, fine-tune your layouts for smoother user journeys, and ultimately turn uncertainty into confident, data-backed decisions. Whether you’re an ecommerce team seeking to reduce checkout drop-offs, a UX designer refining page layouts, or a marketer optimizing engagement, movement maps offer insights that translate directly into real-world results.

