If your website was a book, how far would people read before they lose interest?
Mouseflow’s scroll heatmap helps answer that question.
As one of our six powerful heatmap tools, scroll maps show you exactly how far users scroll down your pages. They help marketers, designers, and product teams understand which sections grab attention – and which get ignored. Let’s explore what scroll maps are, how they work, and why they matter for your site’s performance.
Wait, What’s a Scroll Map?
Think of scroll maps as your website’s attention X-ray; it visualizes how far down a webpage users scroll. Unlike click maps that show where users click, or movement maps that track cursor paths, scroll maps focus on vertical engagement, showing you what percentage of users reach each part of a page.
Scroll heatmaps use a color gradient to visualize engagement:
- Red/orange areas at the top indicate high visibility.
- Yellow and green zones mark where fewer users are engaged.
- Blue or no color means most users didn’t scroll that far.
With color-coded insights, scroll maps make it painfully obvious which parts of your page are getting seen, and which are getting skipped.
So yeah, if your CTA is in a cold blue zone, that’s a problem.
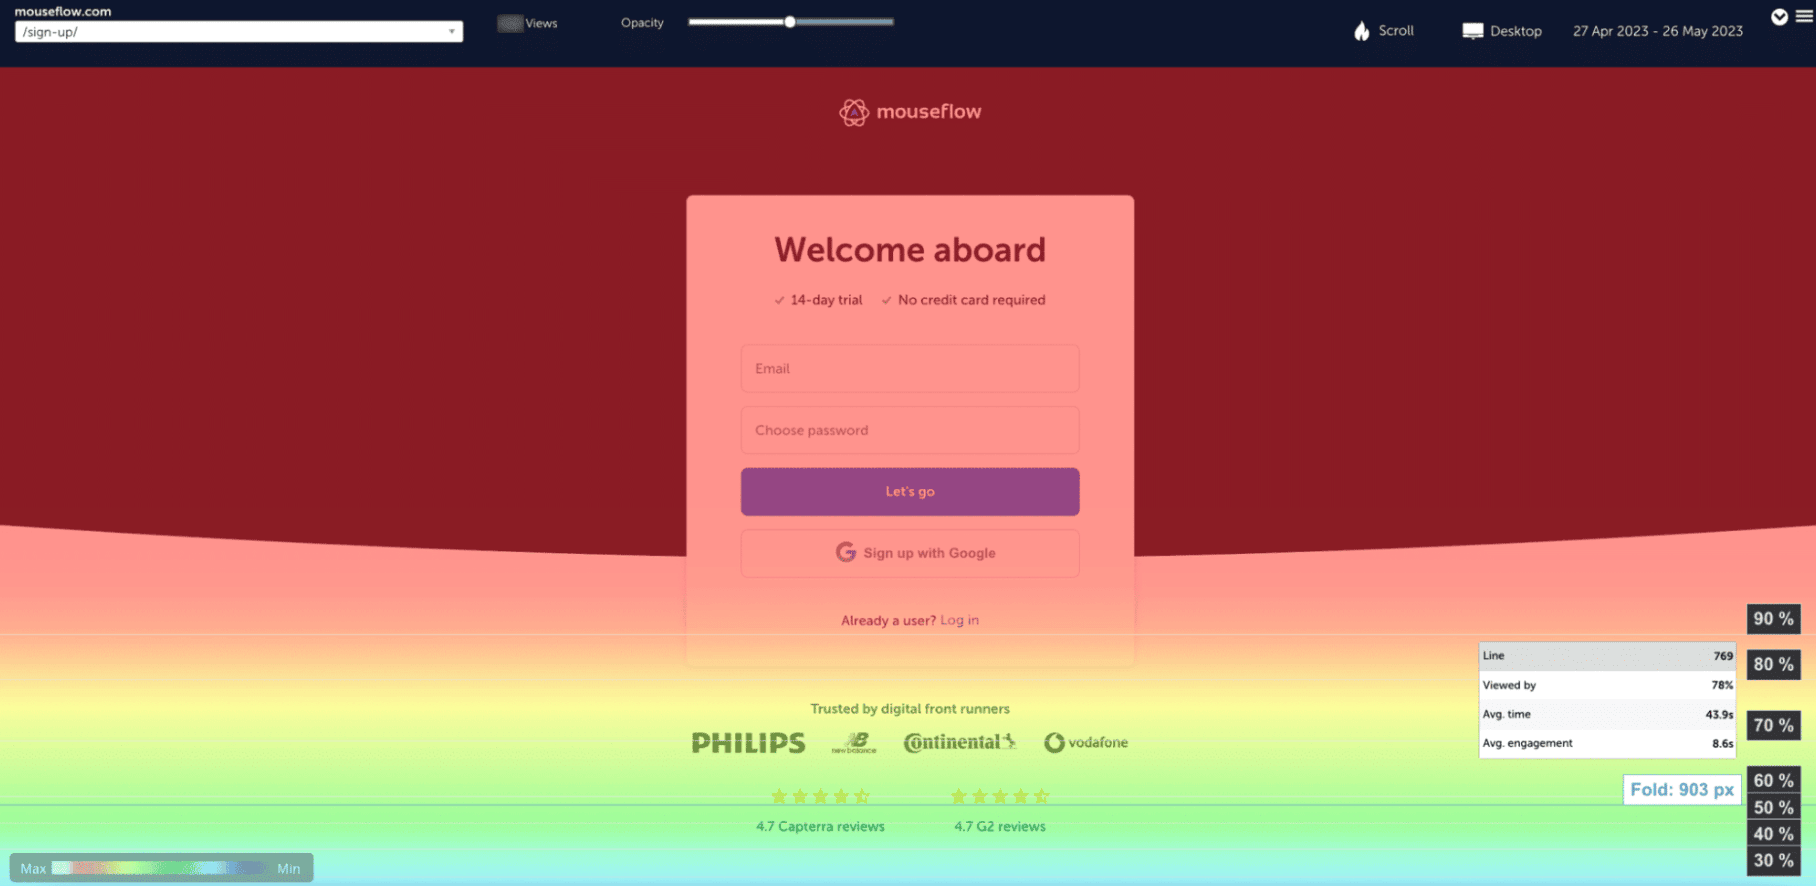
A scroll heatmap by Mouseflow
Why Scroll Maps Matter (More Than You Think)
Scroll maps cut through the noise. No vague “engagement scores.” No guessing if your layout works. Just raw, visual data about how people actually navigate your page. Here’s why they’re so effective:
1. Spot the “Fold”
The fold is the point on your page that users see without scrolling. With scroll maps, you can see where the fold lands on different screen sizes and adjust your content placement accordingly.
2. Catch Drop-off Points
If users consistently stop scrolling before reaching a key CTA, product detail, or form—your scroll map will show it. That’s your cue to either move important content higher up or improve flow and engagement.
3. Expose “False Bottoms”
Sometimes, users think they’ve reached the end of a page when there’s more content below. Scroll maps can reveal these “dead zones,” helping you fix layout or spacing issues that interrupt the experience.
How Mouseflow’s Scroll Maps Work (Spoiler: You Don’t Have to Lift a Finger)
Setting up scroll heatmaps in Mouseflow is effortless. As soon as Mouseflow tracks your pages, scroll maps are automatically generated. They’re updated in real time and available across all your site’s pages. No setup. No guesswork. Just insights.
Part of the Package. Better With the Rest
Scroll maps are part of Mouseflow’s comprehensive heatmap suite, which includes:
- Click maps
- Movement maps
- Attention maps
- Geo maps
- Interactive maps
- Friction maps
You can pair scroll map insights with session replays to see why users drop off. Are they distracted? Confused? Did something break? Replays give you the context to act.
See Scroll Behavior by Device, Source, or Segment
Narrow down your scroll data by device, traffic source, or user behavior. For example, you might find that mobile users scroll less on your pricing page – an insight that could guide your mobile UX redesign.

Use Cases and Optimization Tips
Here are some ways businesses should use scroll heatmaps to improve their sites:
- Move important content above the fold: If users aren’t scrolling to your CTA, move it higher. You don’t need A/B tests to figure that out—your scroll map already told you.
- Optimize long-form pages: If attention drops halfway through your blog, maybe you don’t need that 1,000-word intro. Trim the fluff, tighten your message, and keep readers moving.
- Tailor for mobile vs desktop: Different devices = different scroll behavior. Mouseflow shows you what’s working (or flopping) on mobile, so you can adjust layout and content accordingly.
- Combine with replays: Scroll maps say where users stop. Replays show you what happened before they bailed. Together, they give you a complete picture.
Who Should Use Scroll Maps?
Honestly? Pretty much anyone with a website.
But especially:
-
Marketers placing CTAs and lead forms
-
UX teams working on content flow
-
Ecommerce managers optimizing product pages
-
SaaS teams mapping long-form landing pages
If part of your job is getting users to take action, scroll maps help you put the right content in the right place.
Final Thoughts: Scroll Maps Don’t Guess. They Show.
You don’t need to wonder if users saw your pricing. Or clicked “Read More.” Or made it to your killer testimonial at the bottom.
With scroll maps, you know.
Mouseflow makes it dead simple to see how users engage with your content—and where they stop paying attention. And once you know that? You can fix it.

