
Picture this: Your website is buzzing with visitors, but do you know where they’re all coming from?
Maybe your product pages are blowing up in Berlin. Or your checkout flow is quietly winning over shoppers in Sydney. Without knowing your visitors’ locations, you’re leaving powerful insights (and revenue) on the table.
That’s where geo heatmaps come in. Unlike other heatmaps that show clicks, scrolls, or attention, geo heatmaps reveal your audience’s geographic footprint. They transform invisible data into colorful maps that show exactly which regions are driving traffic, and which ones might need a little love.
Geo heatmaps are part of a broader set of website heatmaps used to analyze visitor behavior from different perspectives. If you want a complete overview of how these tools work together, explore our guide to website heatmaps.
Ready to see your traffic in a whole new light? Let’s explore how geo heatmaps turn location data into your next big advantage.
What Is a Geo Heatmap?
A geo heatmap, sometimes called a geolocation heatmap or geographic heatmap, is a visual tool that shows where your website visitors are located around the world.
Instead of tracking clicks, scrolls, or mouse movements, geo heatmaps layer your traffic data onto an interactive world map. Different regions glow in warm or cool colors depending on how many visitors come from each area. Bright, intense colors mean high traffic; lighter shades indicate fewer visits.
It’s one of seven powerful heatmaps in Mouseflow, each answering a unique question about user behavior. While tools like click heatmaps reveal what users do on your site, geo heatmaps show you where they’re coming from, giving you a whole new perspective on your audience.
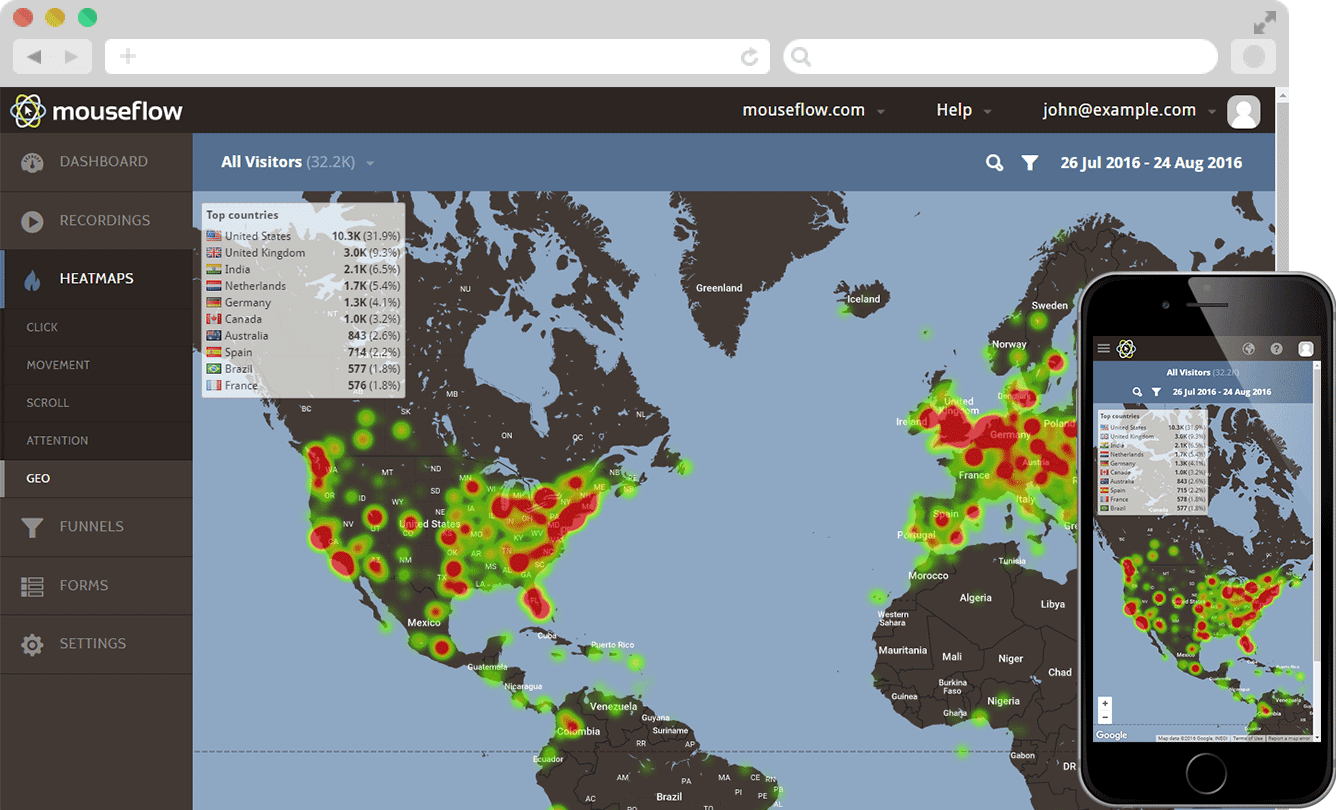
An example of a geo heatmap
How Geo Heatmaps Work: From IP Data to Colorful Maps
Here’s how a geographic heatmap comes to life:
- Data Collection: When someone visits your website, Mouseflow captures their IP address. This data is anonymized and mapped to a general location, such as country, region, or city.
- Visualization: Mouseflow transforms this data into a color-coded map, instantly revealing visitor hotspots. You’ll see a world view, or zoom into specific regions, to spot your strongest markets.
- Privacy & Compliance: Mouseflow ensures compliance with privacy regulations, keeping location data aggregated and anonymized so you can stay informed without risking personal privacy concerns.
The result? A beautiful, visual snapshot of where your visitors are coming from, no spreadsheets required.
How to Read and Interpret a Geo Heatmap
Seeing a sea of colors on your geo heatmap is exciting, but how do you know what it means?
Start by scanning for regions glowing with intense color. These indicate areas driving significant traffic. But high traffic alone isn’t always good news. Compare those regions to key engagement metrics: Are visitors from those areas converting, or bouncing away quickly?
Next, look for unexpected low-traffic regions. These might be places where you have growth potential, or where local barriers are keeping users from engaging.
Finally, remember that geo heatmaps are most powerful when paired with other analytics. Use them as a jumping-off point for deeper investigation with tools like session replays, funnels, or journey analytics. That’s how you transform your geo heatmap from a pretty picture into strategic insights.
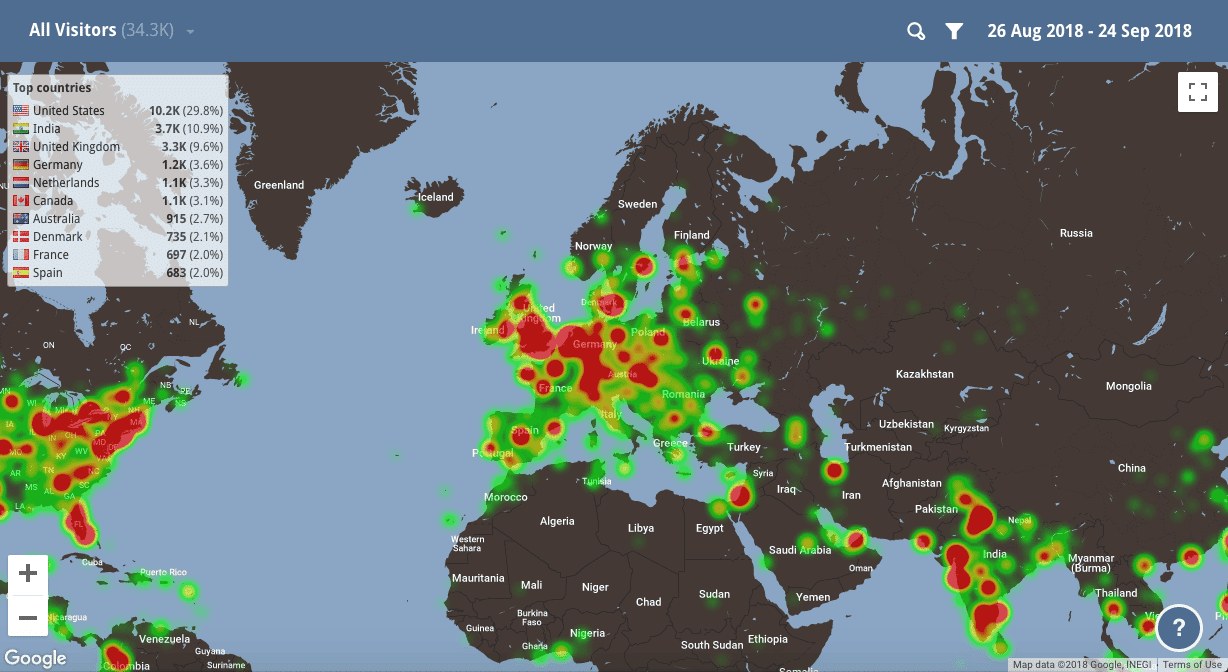
Example of a Mouseflow geo heatmap
Why Geo Heatmaps Should Be Part of Your Analytics Toolkit
Now that you know what geo heatmaps are, and how to read them, let’s look at why they’re so powerful for your business. Here are three big reasons to make geo heatmaps a core part of your analytics strategy:
Spot Untapped Regional Opportunities
Maybe your site sees thousands of visitors from California, but you’ve never noticed strong interest bubbling up in Texas. Or perhaps a region you’re targeting isn’t delivering the traffic you expected. A geo heatmap uncovers these insights quickly.
Instead of guessing where to expand, you’ll know precisely where opportunities exist. That’s critical for ecommerce brands considering local promotions or SaaS companies targeting new regions for growth.
Localize Content and Campaigns for Higher Impact
Users in different regions often respond to unique messaging, currencies, shipping options, or languages. With geo heatmap data, you can tailor content, promotions, and experiences to resonate locally.
Imagine a fashion retailer discovering that visitors from Germany linger longer on winter coat pages, while Spanish users spend more time exploring summer dresses. That’s a chance to personalize your marketing and increase conversions.
Maximize Your Marketing Budget
Digital marketing isn’t cheap. The last thing you want is to invest budget in regions delivering little traffic or revenue. Geo heatmaps show you exactly where your audience is, so you can focus ad spend on high-value locations.
Whether you’re running PPC campaigns or localized SEO efforts, your budget goes further when it’s targeted by real data, not guesswork.

Use Cases and Optimization Tips
Geo heatmaps become truly powerful when you connect them to real business actions. Here’s how businesses across industries put them to work:
- Ecommerce: Run localized promotions, adjust shipping options, and stock region-specific products based on visitor trends.
- SaaS: Prioritize sales outreach in countries showing strong traffic.
- Travel & Hospitality: Discover interest from new markets and tailor packages accordingly.
- Compliance: Know where users are coming from to ensure you’re following region-specific privacy laws like GDPR or CCPA.
- Focus your budget: Redirect ad spend to high-traffic regions that convert best.
- Spot new markets: Identify surprising regions sending engaged visitors and explore local opportunities.
- Tailor your messaging: Localize product pages, promotions, and content to match regional interests.
- Solve mystery drop-offs: Combine geo heatmaps with session replays to discover why visitors from certain areas leave without converting.
Geo Heatmaps vs. Other Heatmaps: How They All Fit Together
Geolocation heatmaps are unique because they show where your audience comes from. Other heatmaps, like click, scroll, or movement heatmaps, reveal how users behave once they’re on your site.
Each heatmap in Mouseflow’s toolkit shines a light on a different question about your users:
- Click heatmaps uncover where people click and tap most.
- Scroll heatmaps show how far down visitors scroll on your pages.
- Attention heatmaps highlight where visitors spend the most time and engagement.
- Friction heatmaps pinpoint areas of frustration, like rage clicks or erratic movement.
- Interactive heatmaps track clicks on dynamic elements like menus, sliders, or tabs.
- Movement heatmaps reveal how users navigate with their mouse or cursor.
Together, these heatmaps give you a complete picture of your audience’s journey — from where they come from to every move they make on your site.
See the Bigger Picture with Geo Heatmaps
Your website visitors aren’t just numbers on a dashboard, they’re real people from real places around the world. And knowing where they come from can transform how you market, design, and grow your business.
Geographic heatmaps turn invisible location data into vibrant, actionable insights. Whether you’re chasing new markets, refining your messaging, or maximizing your marketing budget, this powerful tool helps you make smarter decisions backed by real-world data.
And the best part? Geo heatmaps are just one piece of Mouseflow’s powerful heatmap suite. Together, they give you a complete picture of your users, and the insights you need to keep them engaged.

