
Choosing the right behavior analytics tool can feel straightforward at first. Mouseflow and Smartlook both offer session recordings, heatmaps, funnels, and more. However, Mouseflow also includes Mina AI, which adds an extra layer of analysis by helping teams surface behavior patterns and friction more quickly through session replay insights.
Depending on your goals (web UX vs. product analytics, desktop vs. mobile), one will fit you better.
In this guide, we’ll compare Mouseflow and Smartlook across web and mobile coverage, session replay quality, heatmap insights, funnel capabilities, journey mapping, and more, so you can decide which tool fits your needs best.
TL;DR: Mouseflow vs. Smartlook
Here’s a quick side-by-side comparison to help you decide which tool better supports your team’s goals.
| Feature | Mouseflow | Smartlook |
|---|---|---|
| Platform focused | Web-first, UX optimization | Web and mobile product analytics |
| AI assistance | Yes, with Mina AI, an Insights & Navigation Assistant that helps teams explore and navigate session replay data using natural-language questions. | No native AI assistance |
| Session replays | Full HTML replays, real-time recordings, no sampling, friction score, waterfall view | Screen recording, rage clicks, crash logs, no full HTML DOM, limited segmentation |
| Heatmaps | 6 automatic types: click, Scroll, Attention, Movement, Interactive, Geo, Friction maps. Side-by-side comparison. | Click, movement, scroll only |
| Funnels | Yes (page-based), with drop-off analysis and session linking and revenue attribution. | Yes (event-based), with revenue attribution |
| Friction detection | Automatically detects 7+ types of frustration signals (rage clicks, dead clicks, click errors, JavaScript errors, 404s, bounces, mouse-outs, speed browsing). Includes a Friction Score per session and page, plus a Friction Map and dashboards that surface trends over time. | Detects rage clicks, dead clicks, and click errors. It does not include a session-based friction score or a visual friction overlay. |
| User journey mapping / behavior flows | Yes, maps complete journeys across multiple steps with deep insights (e.g. homepage → product → cart) | Yes, but limited to shorter flows (e.g. product → checkout) and with less filtering and flexibility. |
| Feedback tools | Yes, built-in (surveys, NPS) | No, requires integration |
| Form analytics | Yes, built-in (errors, abandonments, hesitation) | Not available |
| Crash reports | No | Yes |
| Native app tracking | No | Yes (SDK based) |
| Integrations | 40+ tools, including Google Analytics, HubSpot, Shopify | Good selection, supports JS APIs |
| Free plan | 500 sessions/month, but paid plans start at a lower price point. | 3,000 sessions/month |
| Support | In-house support | Outsourced (APAC) |
Mouseflow and Smartlook are both top-tier behavior analytics platforms designed to help you understand user behavior and optimize digital experiences. While they overlap in core functionality, they’re built for slightly different teams and needs, making Mouseflow a strong Smartlook alternative for many businesses.
Mouseflow is a mature platform focused on website UX, optimization, and CRO. It automatically creates 7 types of heatmaps (friction, click, scroll, movement, attention, geo, and live), including a side-by-side comparison mode, captures all sessions without sampling, and includes tools like user journey mapping, form analytics, feedback surveys, friction detection, and Mina AI, which helps teams explore and navigate session replay data more efficiently. It’s trusted by over 190,000 companies, from startups to enterprises.
Smartlook, on the other hand, is a flexible product analytics tool for teams working across web and mobile. Like Mouseflow, it records 100% of user sessions and automatically tracks clicks, inputs, rage clicks, and errors. It also includes native app SDKs, crash logs, event-based filtering, and path analysis, making it ideal for cross-platform product teams. However, Smartlook does not currently offer native AI-based assistance for exploring or interpreting session replay data.
If your focus is on website UX, conversion funnels, and form optimization, Mouseflow is the better fit.
If you need to track app behavior and product usage across platforms, Smartlook may suit you better.
Feature-by-feature Comparison
Let’s compare Mouseflow and Smartlook across their major features:
Session Replays (Session Recordings)
| Feature | Mouseflow | Smartlook |
|---|---|---|
| Full resolution, HTML session video recordings | Yes | No |
| Recording all user sessions right out-of-the box, no further setup required | Yes, Non-stop | Yes, Non-stop |
| Recording all users, no sampling | Yes, but may stop after monthly cap | Yes, but may stop after monthly cap |
| Recordings instantly available for preview | Yes, no need to set up and includes Friction Score | Yes, real-time |
| Automatic friction event tracking | Yes, no need to set up. | Yes, includes rage click & error events |
| AI-assisted session exploration | Yes, Mina AI helps teams explore and navigate session replays easily | No native AI assistance |
| Waterfall view (Break down of recording by time on each page) | Yes | Not available |
| Can download session recordings | Yes | No |
| Can filter recordings by user actions/events | Yes, based on clicks, pages, friction, utm parameters, etc | Yes, all events searchable |
| Mobile session replays (native apps) | No | Yes |
| Crash reporting | No | Yes |
When it comes to understanding how users behave on your website, session replays are a must-have. Both Mouseflow and Smartlook offer them, but the way they support analysis, filtering, and insights varies. Here’s how they stack up.
Mouseflow captures full-resolution HTML5 session replays that show you exactly what users saw and did, every mouse movement, scroll, and click (minus any sensitive data). As soon as the tracking script is installed, recording starts. No extra setup. No dev team dependency.
Now, with Mina AI, Mouseflow shifts the focus from manually digging through recordings to guided analysis. Instead of guessing which sessions matter or building complex filters from scratch, Mina lets you ask natural-language questions and then recommends relevant filters, friction tags, and next steps based on what it sees in your session replay data.
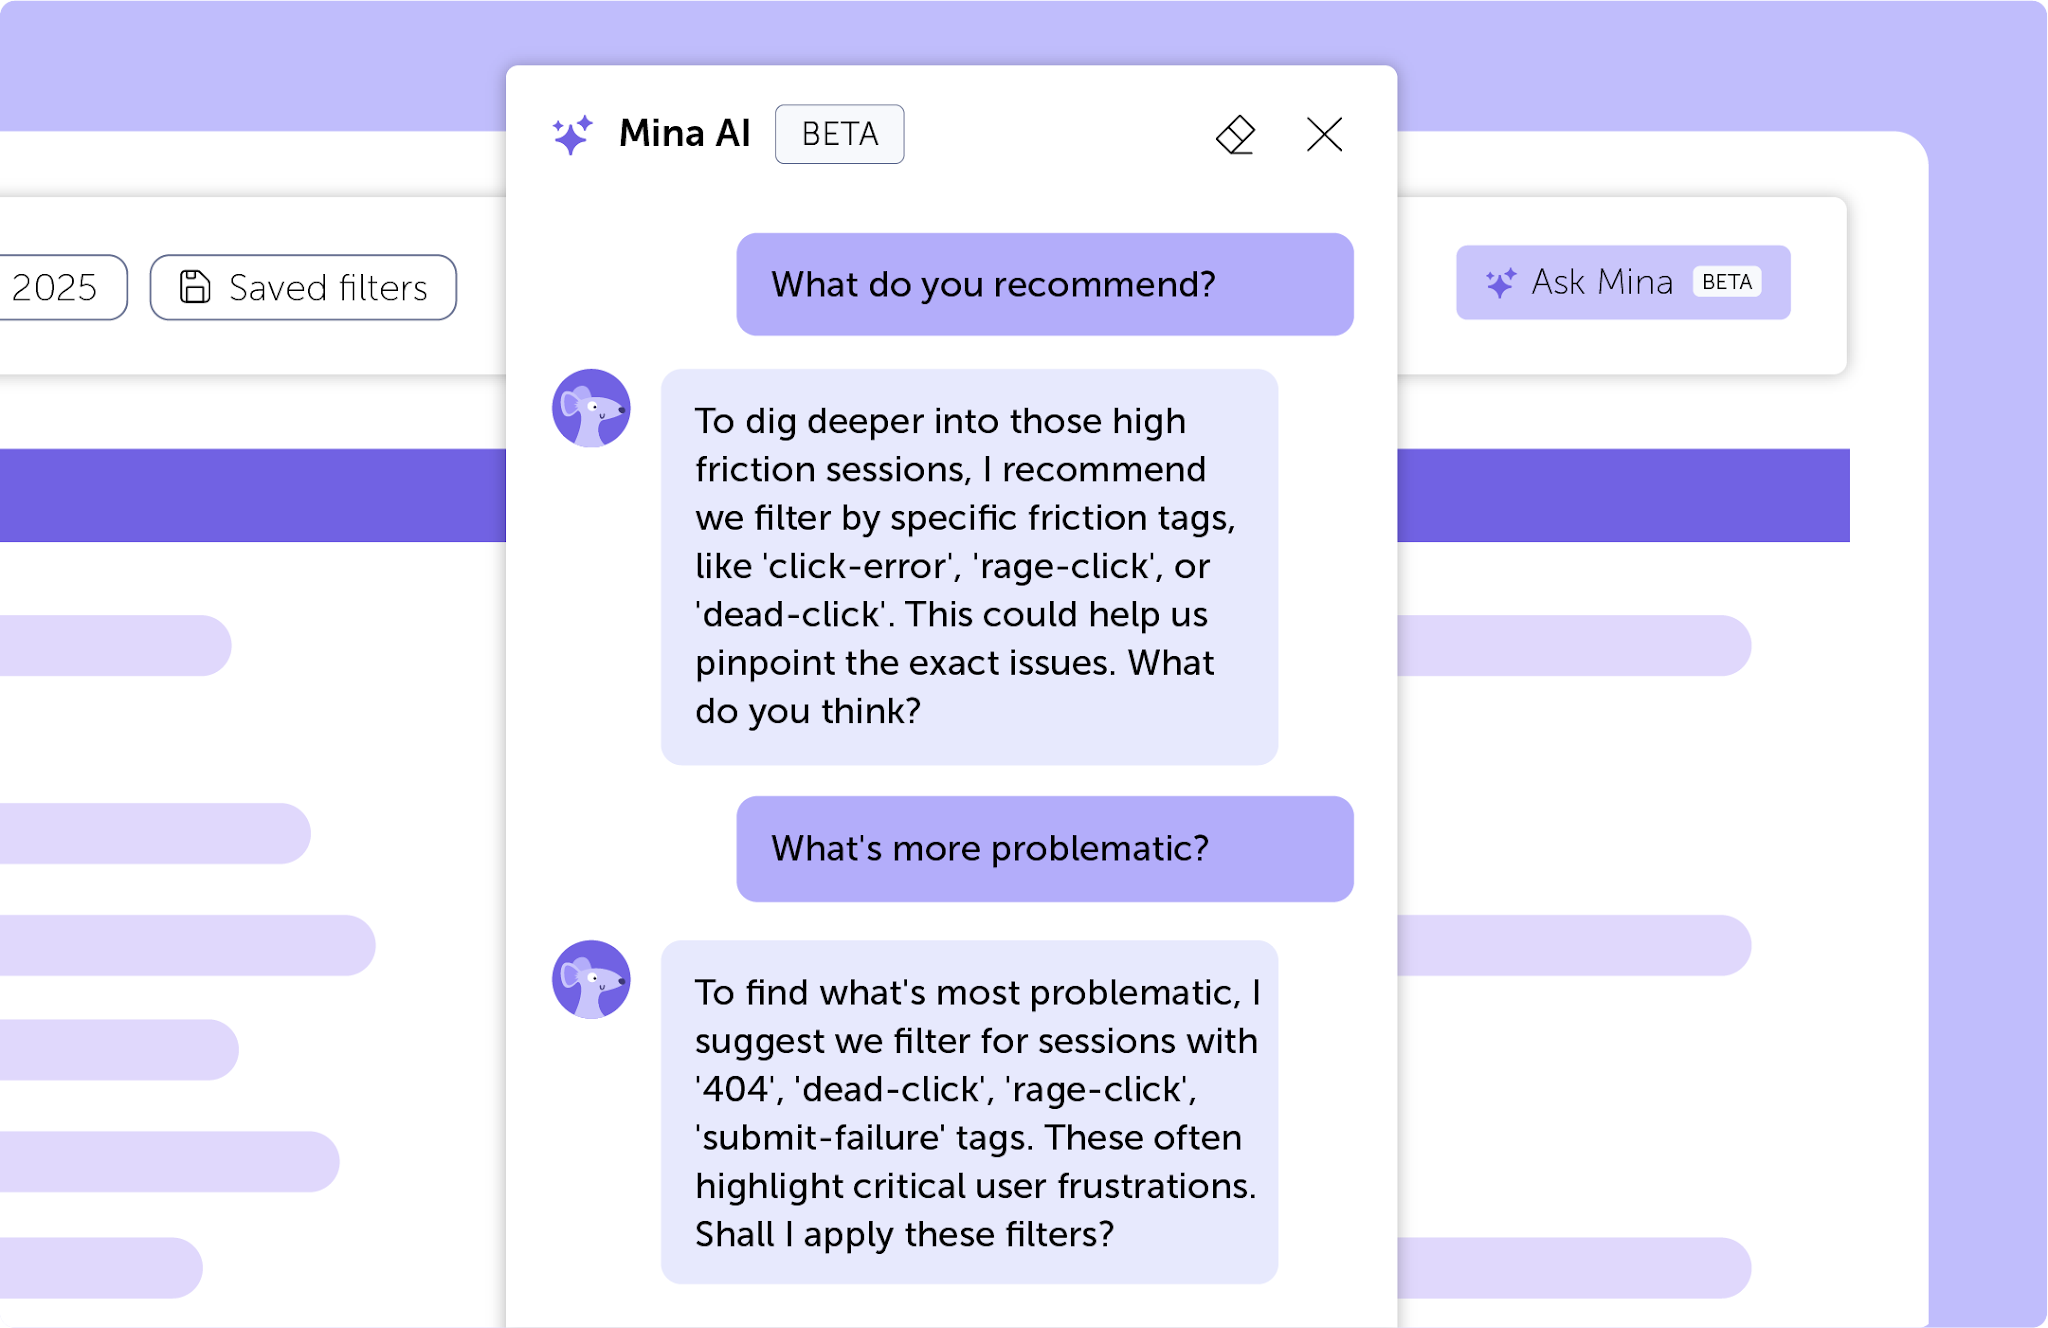
Mina AI helps teams analyze sessions intuitively and efficiently
Mina helps teams narrow in on high-friction sessions by suggesting filters like rage clicks, dead clicks, click errors, or 404s, and then guides them toward the recordings most worth reviewing. The result is a more focused, intentional way to explore session replays, without watching recordings at random or relying purely on manual trial and error.
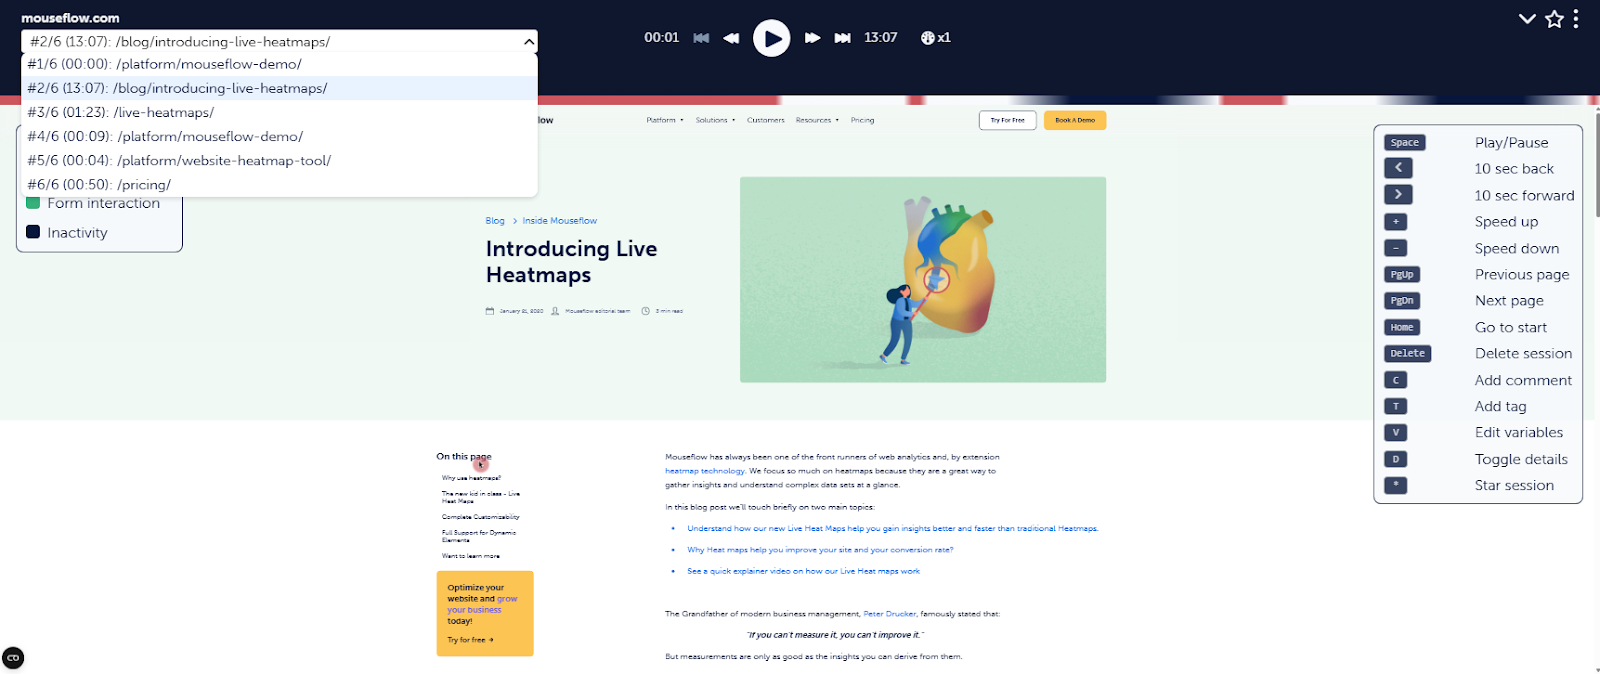
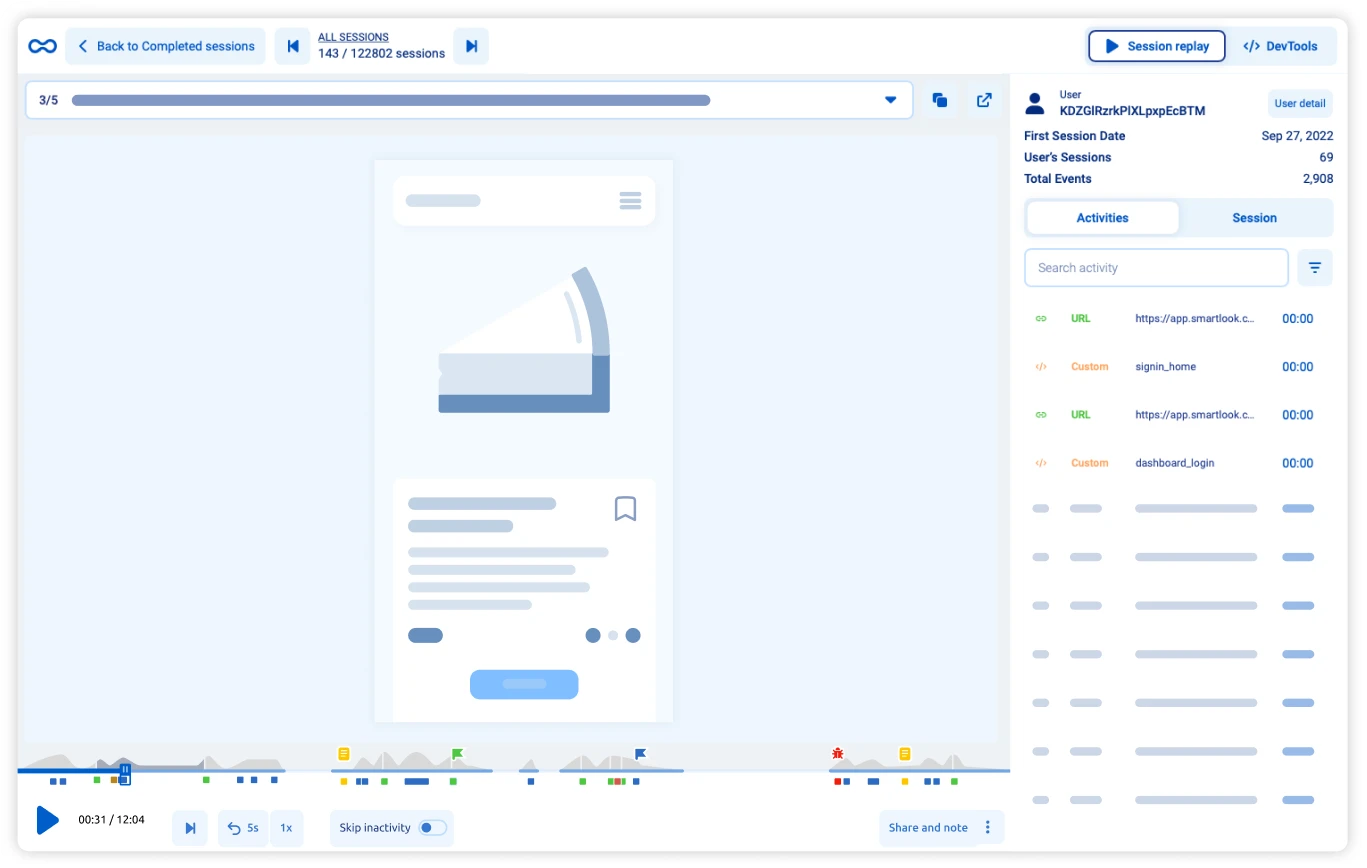
Mouseflow’s Session Replay Player
Beyond AI-assisted navigation, Mouseflow’s Session Replay Player gives you a detailed, high-fidelity view of each session. Recordings include a full visual replay of the page, user interactions, and friction signals tied directly to what the user experienced.
One of the standout features is Mouseflow’s Waterfall view. It breaks each session into page-by-page timelines, so you can quickly see:
- How long someone stayed on each page
- Where they encountered friction (rage clicks, JS errors, bounces)
- How they interacted with key content or navigated your site
You even get a Friction Score per session to help you prioritize which ones to investigate first. Mina AI complements this by helping teams navigate those high-value session replays more efficiently.
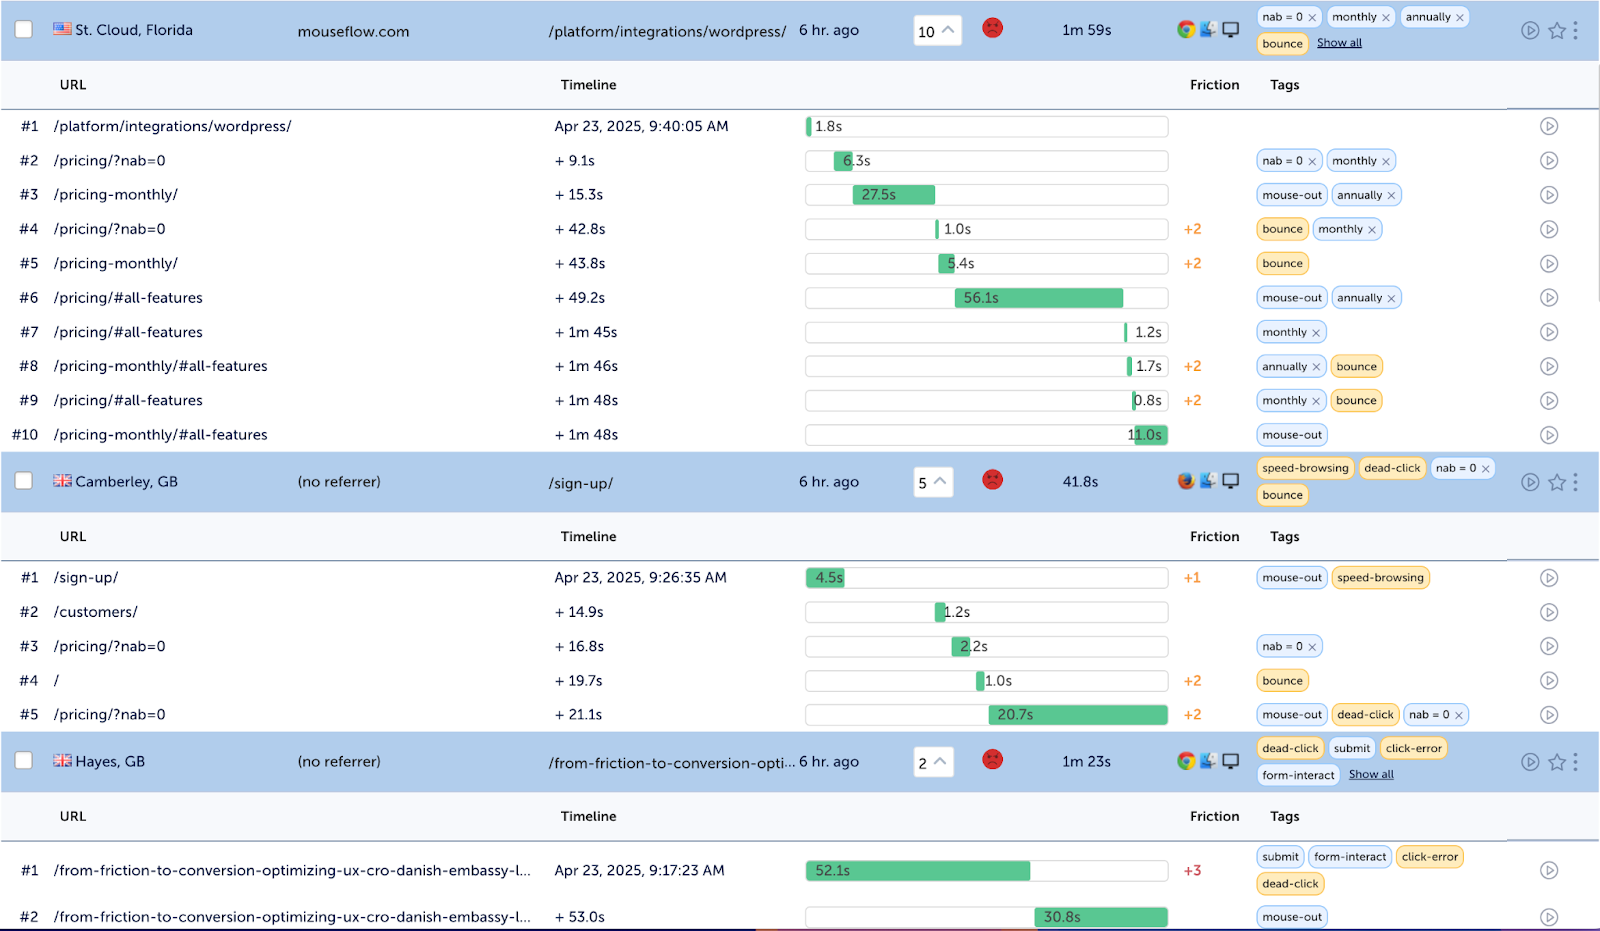
Mouseflow’s Waterfall View on Session Replay
You can also download sessions in Mouseflow, which is ideal for offline reviews or sharing with stakeholders. Something Smartlook doesn’t offer.
Sessions are recorded until you hit your monthly cap (depending on your plan). So while you don’t get unlimited replays, you get detailed, high-fidelity insights on the traffic that matters most. You can also view user session in real-time
Mouseflow also has a custom tag tool to help you narrow in on specific user actions, like “clicked the primary CTA” or “interacted with a slider”. It lets you tag any on-page element like buttons, menu items, CTAs, banners, and more, directly inside Mouseflow.
Once you’ve added tags, you can filter across all features in Mouseflow: heatmaps, funnels, dashboards, and session replays. This gives you a smarter way to analyze how users engage with high-priority elements on your site, without losing time (or needing help from dev).
Smartlook also captures full-resolution session replays and doesn’t sample sessions. It logs all users by default. Recordings begin right away, and you can view them in real-time as well.
Smartlook’s Session Recordings
Smartlook’s edge lies in its event-based filtering. You can filter sessions based on any user action, clicked “Add to Cart,” filled out a form field, experienced a JavaScript error, etc. This gives product and UX teams granular control when searching for behavior tied to particular interactions.
However, exploring these sessions in Smartlook is primarily a manual process. Teams need to decide which events to filter for and iteratively refine those filters to narrow down relevant recordings. There’s no built-in AI assistant to help guide session replay exploration or suggest next steps during analysis.
Unlike Mouseflow, Smartlook doesn’t allow session downloads. They’re stored in the cloud, and the retention window depends on your plan (typically 1 month unless on a higher tier). But you can mark key recordings as favorites to save them longer.
Heatmaps
| Mouseflow | Smartlook | |
|---|---|---|
| Click heatmap | Yes | Yes |
| Scroll heatmap | Yes | Yes |
| Movement heatmap | Yes | Yes |
| Attention heatmap | Yes | No |
| Geo-location heatmap | Yes | No |
| Real-time/Live heatmap | Yes | No |
| Mobile heatmap | No | Yes |
| Friction map | Yes | No |
| Auto-generated for all pages | Yes | Manual setup may be needed |
| Filter heatmaps by segment/device | Yes | Yes (basic) |
| Side-by-side comparison | Yes | No |
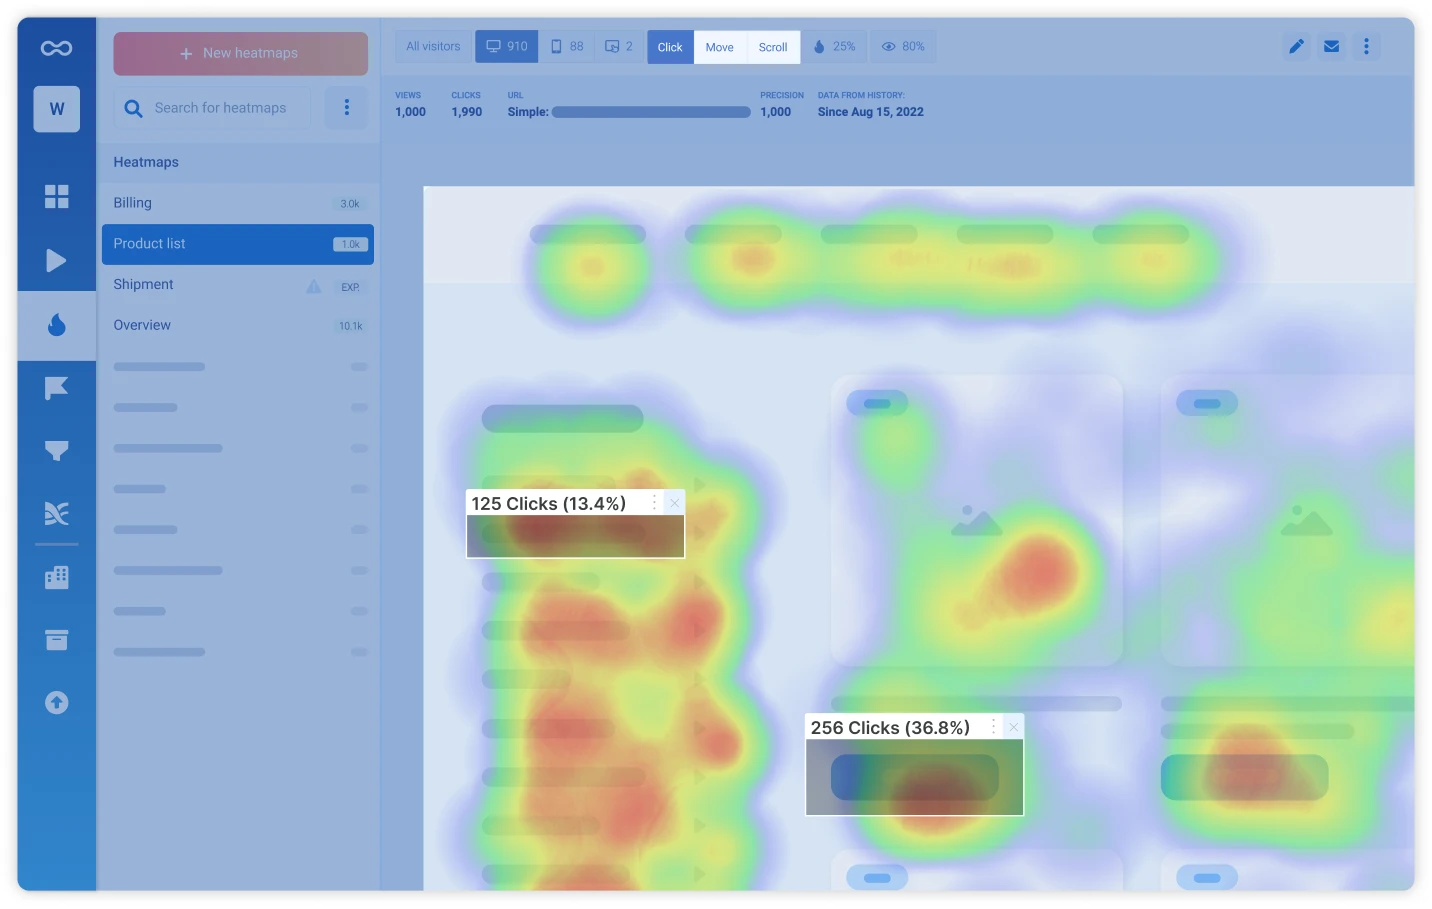
Now let’s take a look at heatmaps. Heatmaps are a strong suit of Mouseflow. It offers seven types of heatmaps out of the box: click, scroll, movement, attention, geo-location, live (also called interactive), and a friction map. These are automatically generated for every page that gets traffic, with no setup needed beyond installing the script.
Click maps show where users click most often. Scroll maps help you understand how far people scroll down a page. Movement heatmaps (or hover maps) show where users move their cursor, which can be a useful signal of what’s drawing attention. Mouseflow also has a dedicated attention heatmap that combines scroll depth and time spent to show which sections hold users’ focus the longest.
The geo heatmap reveals where your visitors are located. You can quickly spot which regions are engaging the most or underperforming, which helps if you want to localize your content or focus ad campaigns more strategically.
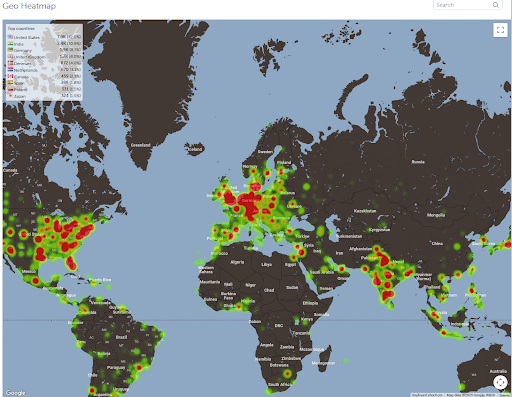
Mouseflow’s Geo Heatmap
Interactive or live heatmaps let you see how users interact with dynamic content like dropdowns, sliders, or tabs. Unlike static heatmaps, these adapt to the live state of the page so you can track behaviors on single-page apps or elements that change when clicked. We’ve made a quick comparison table below that shows how Live Heatmaps stack up against Static Heatmaps, and when each might be the right fit.
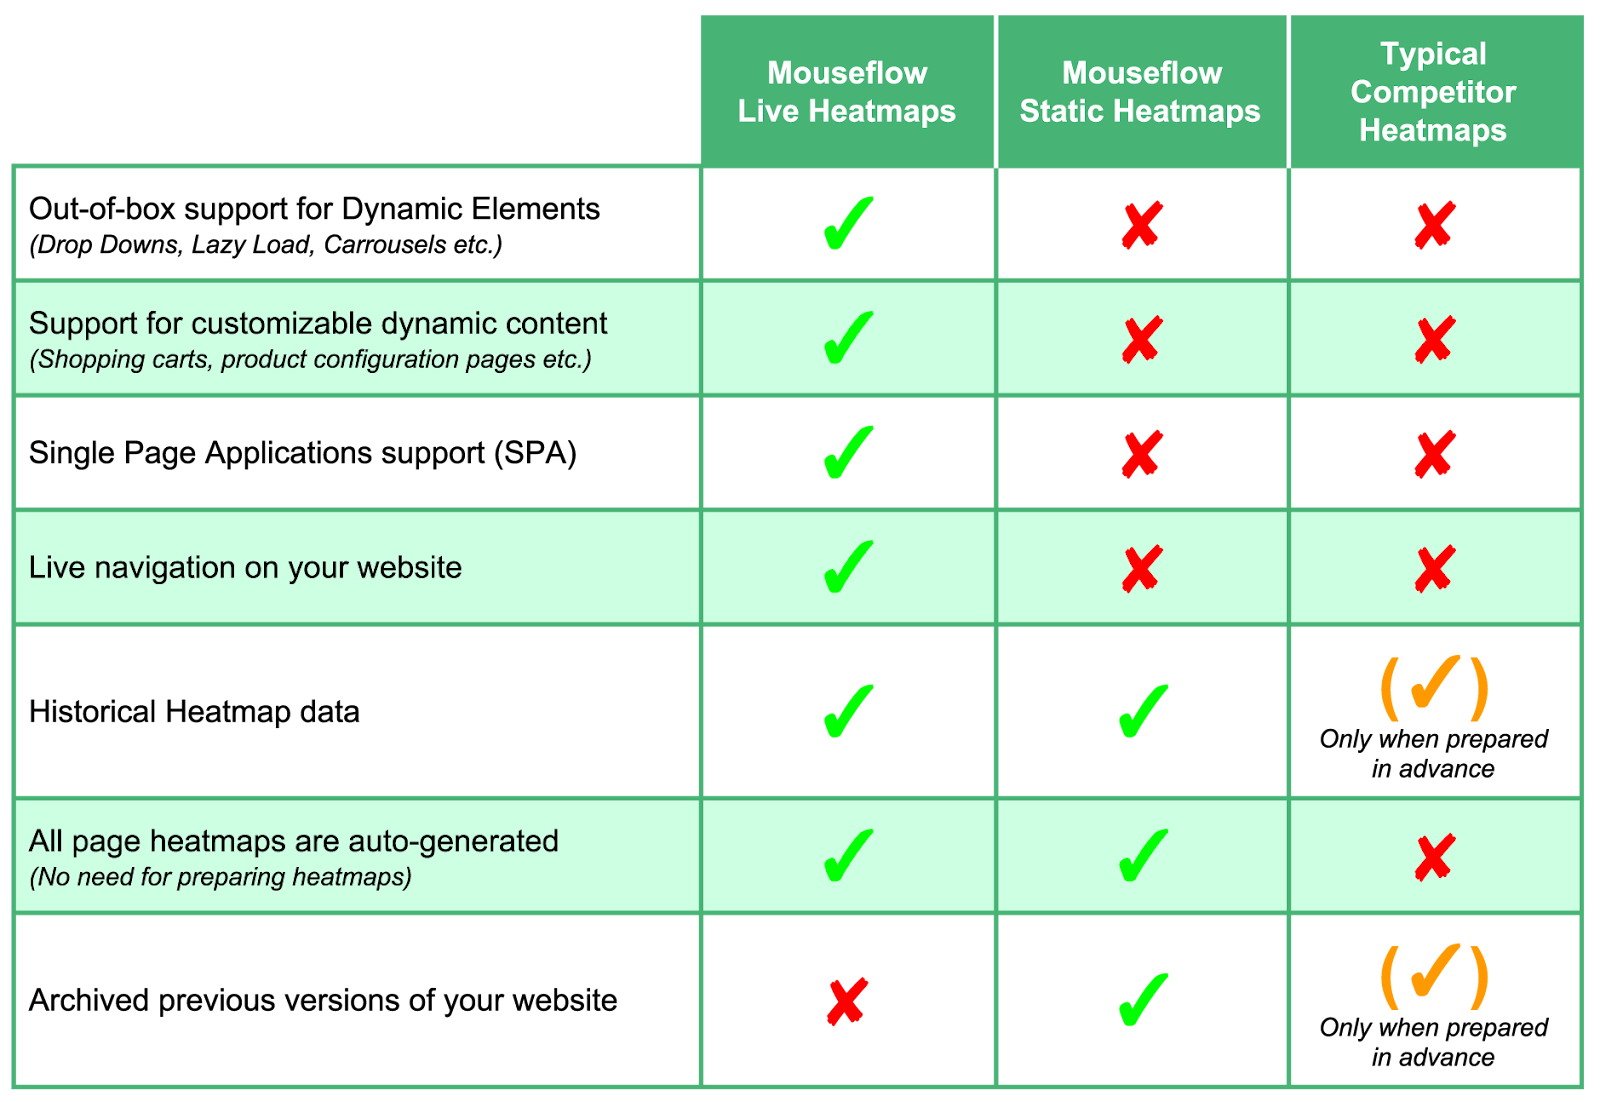
Comparison between Interactive (live) vs. Static Heatmaps
Then there’s the friction map. It overlays friction events like rage clicks, dead clicks, and click errors directly on your heatmaps. This helps you identify exactly which elements are frustrating your users. You can filter by friction type and focus on the areas that need attention.
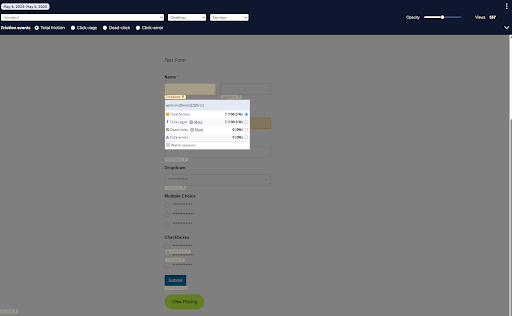
Mouseflow’s Friction Map Example
Mouseflow also includes a side-by-side heatmap comparison mode that lets you open two heatmaps simultaneously with independent controls for date range, segment, device type, heatmap type, and page. This makes it easy to measure the behavioral impact of a redesign, compare mobile vs. desktop patterns, or add visual context to A/B test results, all without switching between tabs. Smartlook does not offer an equivalent feature
Mouseflow also supports heatmaps on desktop, tablet, and mobile devices. Even though the mobile heatmaps apply to web pages rather than native apps, they still give a clear view of how mobile users interact differently from desktop visitors.
Smartlook supports the three basic types of heatmaps: click, scroll, and movement. These are not created automatically for every page by default – you need to generate them manually. But once set up, they give good insight into user behavior across both desktop and mobile views.
Smartlook’s Click Heatmap Example
That said, it doesn’t offer attention, geo, friction or live heatmaps. The lack of a live heatmap can be limiting if you’re optimizing dynamic components like megamenu hovers, carousels, or dropdowns, where interactions aren’t tied to static positions on the page. Mouseflow’s live heatmaps handle these elements in real-time, which can give you a clearer picture of how users interact with dynamic content.
Smartlook also doesn’t include a built-in friction overlay, so you’ll need to rely on session recordings or events to find problem areas.
In short, if you want advanced filtering, friction insights, and multiple heatmap types to guide UX or CRO work, Mouseflow gives you more depth. If you need quick visual insights across web and mobile, Smartlook would work for you.
Friction Detection & Crash Reports
| Mouseflow | Smartlook | |
|---|---|---|
| Rage click tracking | Yes | Yes |
| Dead click tracking | Yes | Yes |
| JavaScript error tracking | Yes | Yes |
| Quick bounce detection | Yes | No |
| Speed scrolling detection | Yes | No |
| 404-error detection | Yes | No |
| Combined friction score per session/page | Yes – calculates a numeric Friction Score per session | No |
| Friction dashboard overview | Yes – includes top pages, elements, and friction types | No |
| Friction map overlay | Yes – visualizes where friction events occur on-page | No |
| Custom friction rules | Yes – allows setting up tailored friction signals | No |
| Crash report logging (mobile) | No | Yes – logs native mobile app crashes and links to replays |
| Filter session replays by friction events | Yes | Yes |
Both Mouseflow and Smartlook help you uncover when and where users are struggling. You’ll find signals like rage clicks, dead clicks, JavaScript errors, and more. But the way each tool handles this data is quite different.
Mouseflow takes a structured approach. It doesn’t just flag individual issues. It turns them into a score. Mouseflow’s Friction Score gives every session and every page a number that reflects how frustrating the experience was for the user. It looks at things like rage clicks, dead clicks, JavaScript errors, rapid scrolling, bounces, and even 404 errors.
Instead of sifting through hundreds of random replays, you can filter by the highest-friction sessions and go straight to the ones where users likely ran into problems. This is a huge time-saver so you can prioritize the worst experiences so you can fix what matters first.
To make it even more visual, Mouseflow includes a full Friction Insights dashboard. It shows you the pages with the most frustration, highlights the elements causing repeated problems, and surfaces the most common errors. There’s even a Friction Map that overlays these issues directly on your pages so you can see what needs attention at a glance.
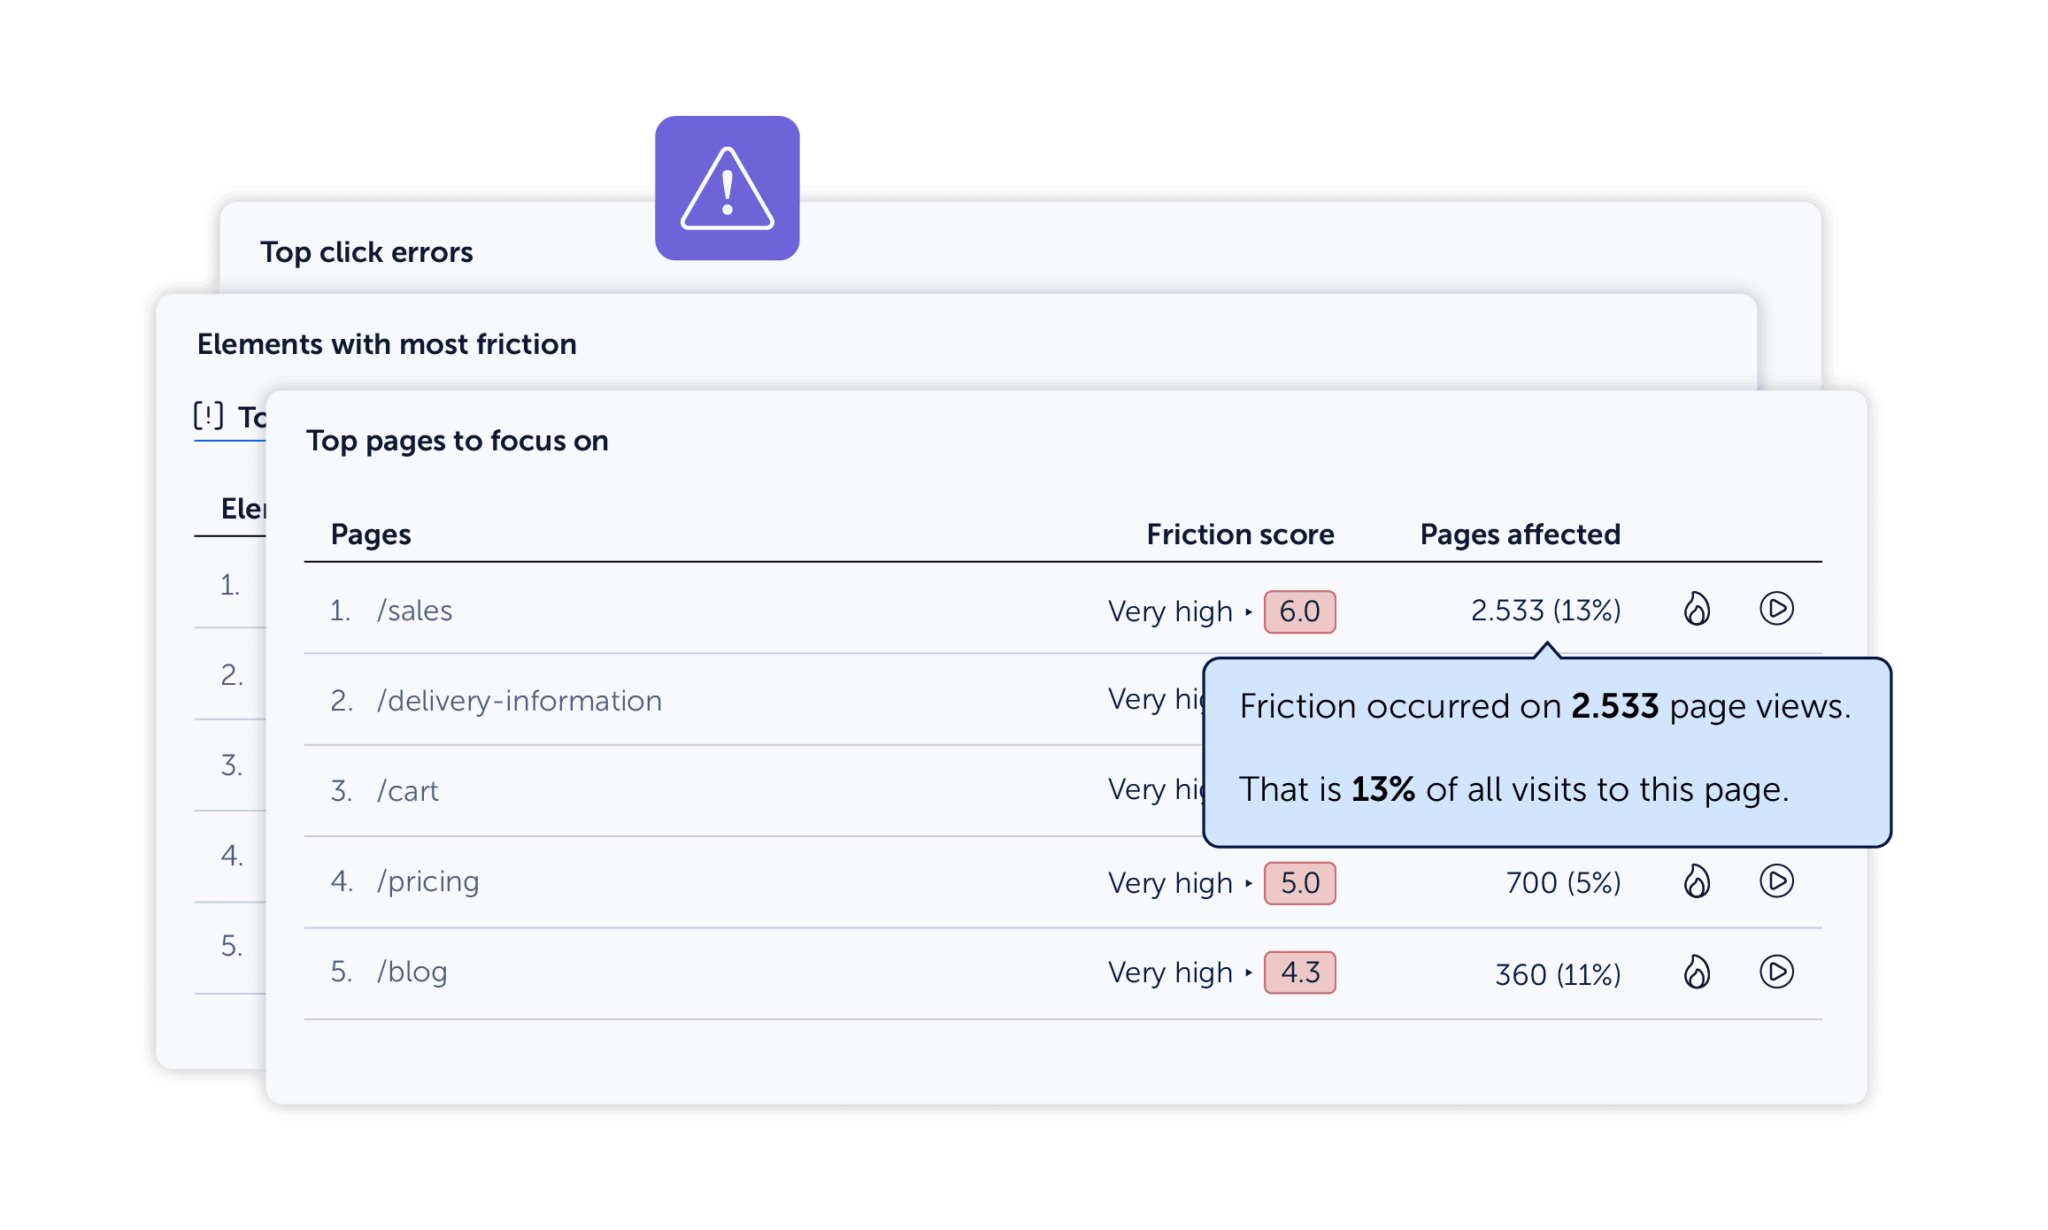
Mouseflow’s Friction Dashboard Example
Smartlook also helps you spot friction. It detects rage clicks, dead clicks, and JavaScript errors. You can filter replays by these events and dig deeper into what happened. However, Smartlook doesn’t group these events into a single score or central dashboard. That means you’ll need to piece together the story yourself.
Where Smartlook adds unique value is in mobile app monitoring. If your app crashes, Smartlook’s Crash Reports let you see what the user was doing right before the problem occurred. It links the crash to the exact session replay, giving mobile teams a clear view of the issue and how it unfolded.
Smartlook’s Crash Analytics Example
Smartlook collects device-level metadata (such as OS, app version, and device model) to help analyze crash patterns across specific user environments. Mouseflow also captures rich device and session data, though it doesn’t offer native crash reporting for mobile apps.
If you’re focused on optimizing your website’s user experience and want a faster way to surface and act on user frustration, Mouseflow’s friction score and visual tools give you that structure. You’ll know what to fix and where to start. This makes Mouseflow a great Smartlook alternative for teams prioritizing website optimization.
If you’re working on both web and mobile, especially native apps, Smartlook can fill the gap with mobile-specific insights like crash tracking. You’ll still see friction signals on the web side, but with a bit more manual effort required to connect the dots.
Both tools uncover frustration. Mouseflow just gives you the full workflow to act on it. Smartlook gives you the raw data, with added visibility for mobile teams.
Journeys & Behavior Flows
| Mouseflow | Smartlook | |
|---|---|---|
| Behavior flow visualization | Yes – via Journeys, shows full user paths across pages | Yes – via Paths, shows flows based on pageviews and events |
| Automatic page flow mapping | Yes – but you’ll need to set a focus step | Yes – but custom events require setup |
| Custom event-based flows | No – focused on page navigation | Yes – supports custom-defined events (e.g., add to cart, play video) |
| Mobile app journey tracking | No – web only | Yes – includes native mobile app journey tracking |
| Filtering options | Yes – filter by device, traffic source, tags, friction score, and more | Yes – filter by event properties, device, user ID, and custom attributes |
| Link to session replays | Yes – click any node to see filtered session recordings | Yes – direct jump from event or flow to session replay |
| Ease of use | Very easy – plug-and-play with a clean visual map | Flexible but more technical – works best with well-defined event setup |
| Use case fit | Best for web-based UX optimization and conversion path analysis | Best for product teams managing cross-platform (web + mobile) journeys |
Understanding how users move through your site or app is key to spotting drop-offs, bottlenecks, and surprising behavior patterns. Both Mouseflow and Smartlook offer tools that help you visualize this, but how they do it, and what insights you can draw, differ quite a bit.
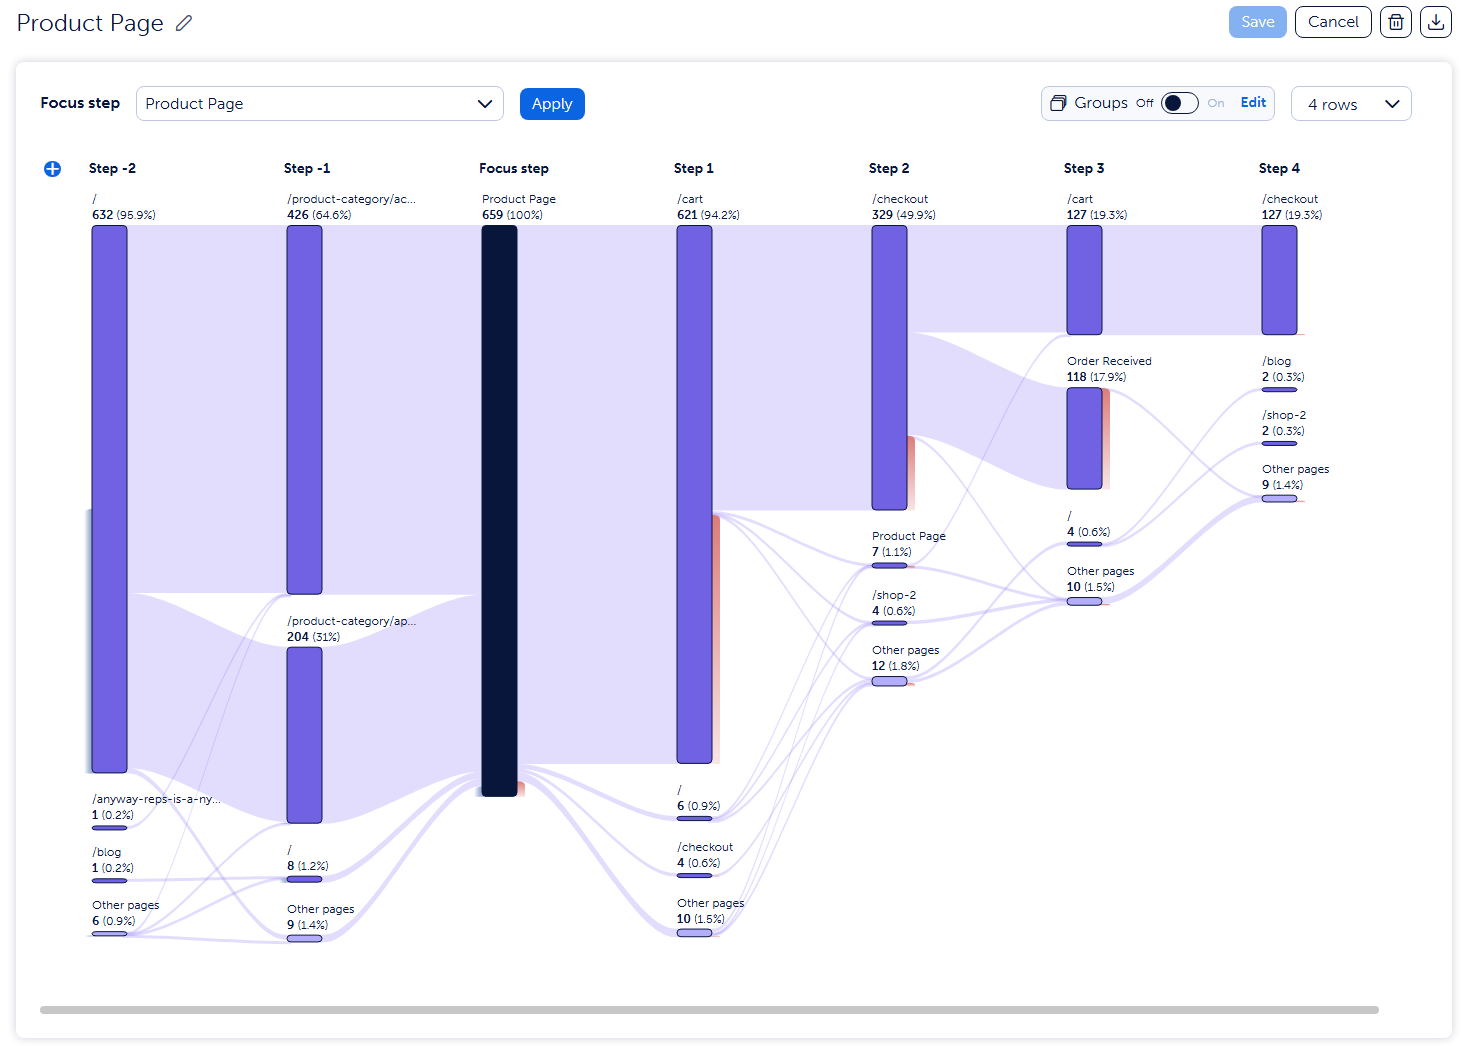
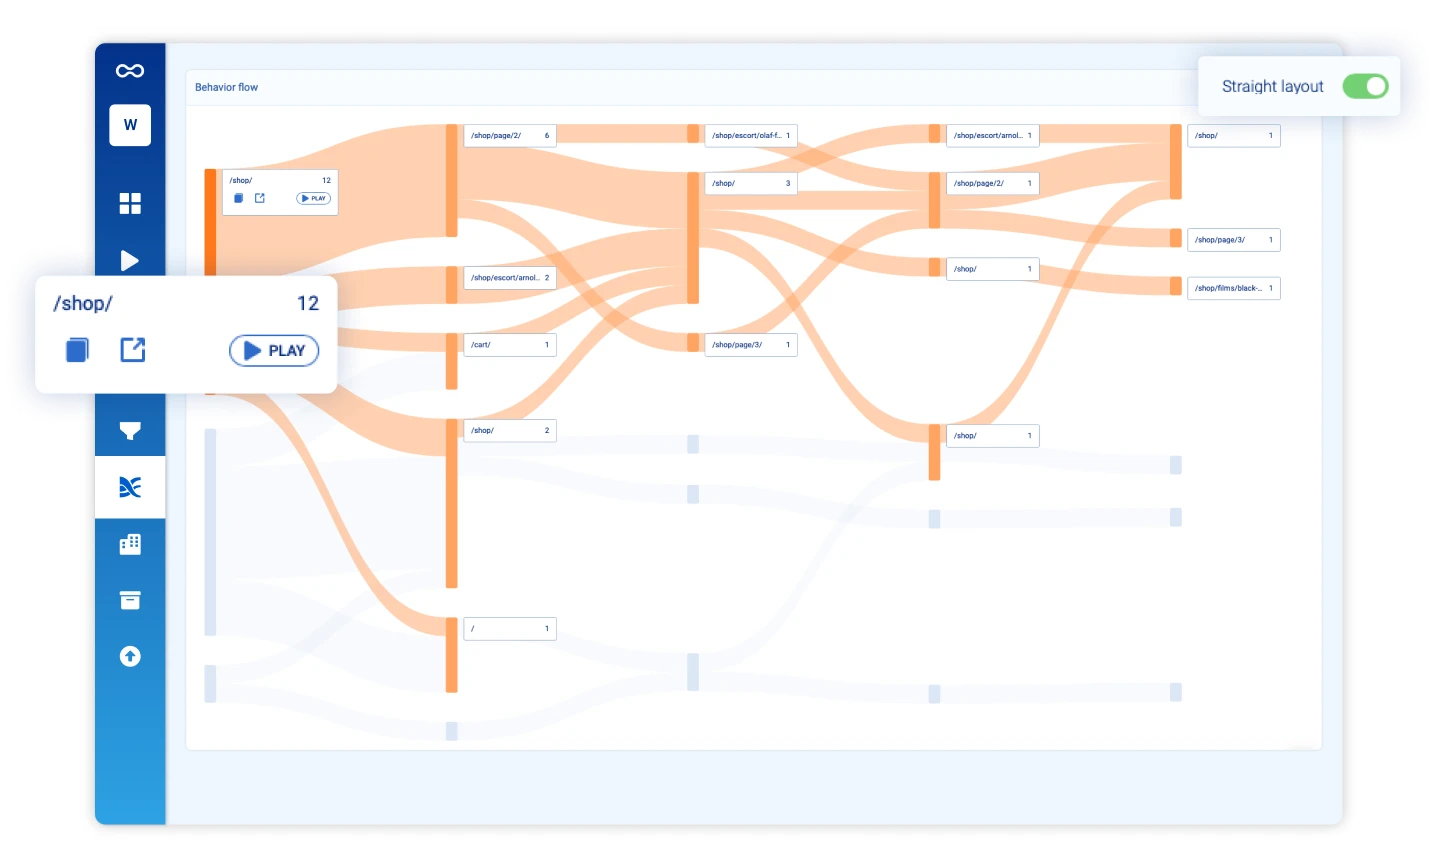
Example of Mouseflow’s User Journey Mapping
Mouseflow comes with a built-in feature called Journey analytics. It shows a visual path of where users come from, which pages they visit in which order, and where they drop off. You can filter journeys by traffic source, device, behavior tags, or even friction score, which helps you answer questions like:
- Where do users from Google Ads land, and how far do they go?
- Are mobile users navigating the site differently?
- Are high-friction sessions following a specific path?
Journeys are especially powerful for spotting unintended user flows. Maybe users keep circling between your pricing and FAQ pages without converting. Or maybe they drop off right after a specific blog post. Mouseflow makes it easy to explore those journeys, zoom into session recordings, and dig into the “why” behind behavior.
It also helps that Journeys are tied into other Mouseflow features. You can jump from the Journey view straight into a heatmap or a filtered list of replays. This makes the tool less siloed and more action-oriented.
Smartlook takes a slightly different approach with its Behavior Flows feature. These are automatically generated behavior flow diagrams based on session data. They show which actions users take after landing on a specific page or performing a certain event. For example, you can see what users do after signing in or clicking a product.
Example of Smartlook’s Behavior Flows
Smartlook can also track events like clicks, inputs, scrolls, and page visits and lets you build custom events too. This means the behavior flows can include more than just page views. You can track interactions like clicking a CTA, opening a dropdown, or playing a video. This gives product teams a lot of depth when analyzing how users navigate and engage across a product.
And since Smartlook supports native mobile SDKs, its behavior paths can cover user journeys across both web and mobile apps. However, Smartlook’s Behavior Flow feature can feel a bit more technical, especially when creating custom events to track non-pageview interactions. It may require more upfront setup if you want to track granular flows like “Users who opened the cart, then added a product, but didn’t check out.”
Mouseflow’s Journeys are simpler to set up and highly visual from the start. They’re perfect for marketers, UX designers, and CRO specialists who want to quickly spot conversion gaps or weird behavior patterns. You get behavior flows without needing to configure anything upfront.
Both tools help you make sense of what users are doing. The main difference is how much setup you’re willing to do and whether you’re tracking a website, an app, or both.
Conversion Funnels
| Mouseflow | Smartlook | |
|---|---|---|
| URL-based funnels | Yes | Yes |
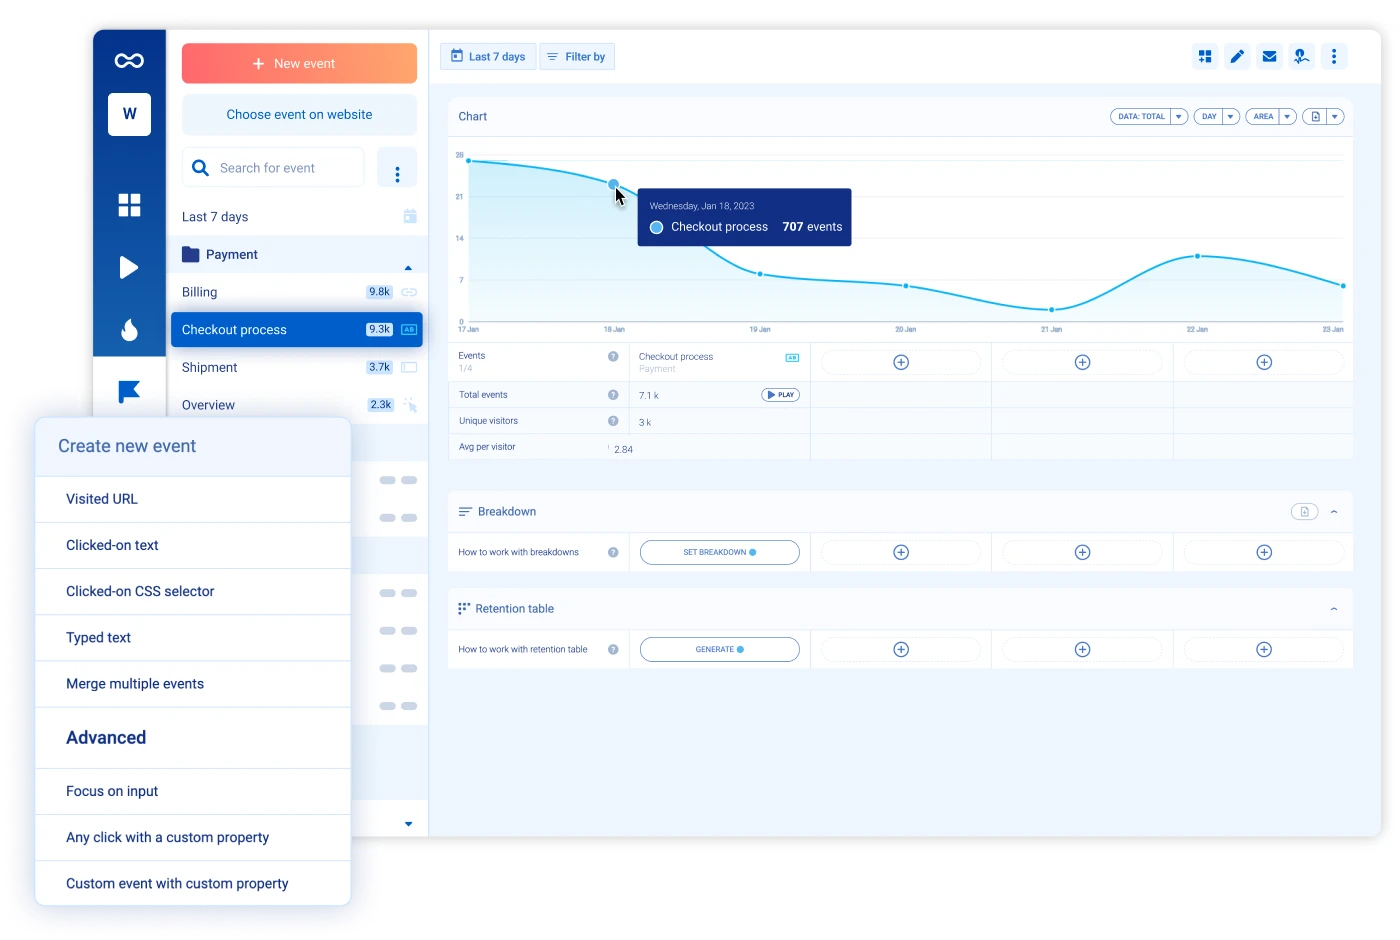
| Event-based funnels | Yes – Supports basic event-based setup via virtual pageviews created using custom tags. Slightly more limited setup compared to Smartlook. | Yes – Supports clicks, inputs, custom JS events |
| Retroactive funnel creation | Yes | Yes |
| Session replay from funnel steps | Yes | Yes |
| Funnel filtering by user properties | Yes – Device, traffic source, location, etc. | Yes – Device, country, user properties, etc |
| Funnel filtering by friction | Yes – Filter sessions by Friction Score | No |
| Revenue Insights (lost revenue per step) | Yes – Set conversion value and see lost potential | Yes – Revenue feature available, tied to funnel conversions |
| Funnel anomalies detection | No | Yes – Flags unexpected drops in conversion rates |
| Conversion & drop-off visualization | Yes – Bar charts with step-by-step breakdown | Yes – Charts and % breakdowns per step |
| Integration with journey analytics | Yes – Funnel + Journey + Friction all connect | No direct integration, but can combine with path analysis manually |
Funnels help you understand how users move through your key flows and where they drop off. Whether it’s a signup journey, onboarding sequence, or ecommerce checkout, both Mouseflow and Smartlook offer funnel tools to help you analyze and improve conversions.
Mouseflow lets you build funnels based on pageviews, entry/exit pages, and behavior tags. It’s designed to be fast to set up, with no coding required. You select the steps in your flow and instantly see conversion and drop-off rates between each one.
Where Mouseflow stands out is in the added context. You can filter funnel steps by friction score to quickly surface the most frustrating user experiences. And if you want to dig deeper, you can view session recordings or heatmaps tied to that exact step. You also get Revenue Insights, which estimate how much potential revenue you can gain from fixing friction.
Mouseflow’s funnel tool works especially well when your flows follow a linear, page-based structure. If you know your desired path (for example, homepage to pricing to checkout), setup takes seconds.
Smartlook offers a different kind of flexibility. It supports both URL-based and event-based funnels, which is helpful when your user journey doesn’t involve full page loads. This makes it well suited for modern web apps or flows with modals, popups, or embedded interactions.
You can build funnels based on clicks, form inputs, or other events, and segment them by properties like device, country, or traffic source. Smartlook also supports retroactive funnels, funnel breakdowns, and funnel anomalies. Like Mouseflow, you can open session recordings tied to each step to see exactly what users did before dropping off.
While Smartlook does not include a friction score or automated frustration prioritization, it gives you raw data and recordings to explore issues manually. It also supports revenue metrics tied to conversions.
In short, Mouseflow is faster to set up for traditional page-based flows. It adds extra prioritization through friction scores and revenue loss estimates. While Smartlook is more flexible for tracking in-page interactions and custom events. It’s a strong fit for complex products with less linear flows.
Both tools provide valuable funnel insights. Which one is better depends on how your product works and what level of detail you need out of the box.
Form Analytics & Feedback
| Mouseflow | Smartlook | |
|---|---|---|
| Built-in Form Analytics | Yes – Auto-tracks field engagement, drop-off, hesitation, errors | No – Requires custom event setup |
| Field-level insights | Yes – Drop-off, hesitation, time on field, error rate | Possible via manual tagging |
| Link to session recordings | Yes | Yes |
| Built-in Feedback tool | Yes – Custom surveys, triggers, targeting | No |
| Feedback tied to sessions | Yes | No – Unless using third-party tools |
| Exit intent surveys | Yes | No |
| Behavioral targeting for surveys | Yes – Time on page, scroll depth, user actions | No native support |
Sometimes, numbers don’t tell the whole story. To really understand why users drop off, get stuck, or abandon your site altogether, you need to see how they interact with your forms and occasionally, just ask them.
Let’s start with form analytics.
Mouseflow makes it easy. It automatically tracks how users interact with each form field. You’ll see things like which fields users hesitate on, where they drop off, how long they spend typing, and even if they’re using autofill. If 30% of your visitors drop off at a phone number field, you don’t have to guess why. Just open the session recording and see exactly what and why it happened.
It’s a fast way to spot problems like unclear labels, overly strict validation rules, or frustrating error messages.
Smartlook doesn’t offer a dedicated Form Analytics feature. But it does track user interactions such as clicks, inputs, field focus, and more. You can set up custom events to monitor form behavior, then review those sessions or use funnels to analyze drop-offs. It’s flexible and works well for advanced use cases, but it takes more effort to set up and analyze compared to Mouseflow’s built-in dashboard.
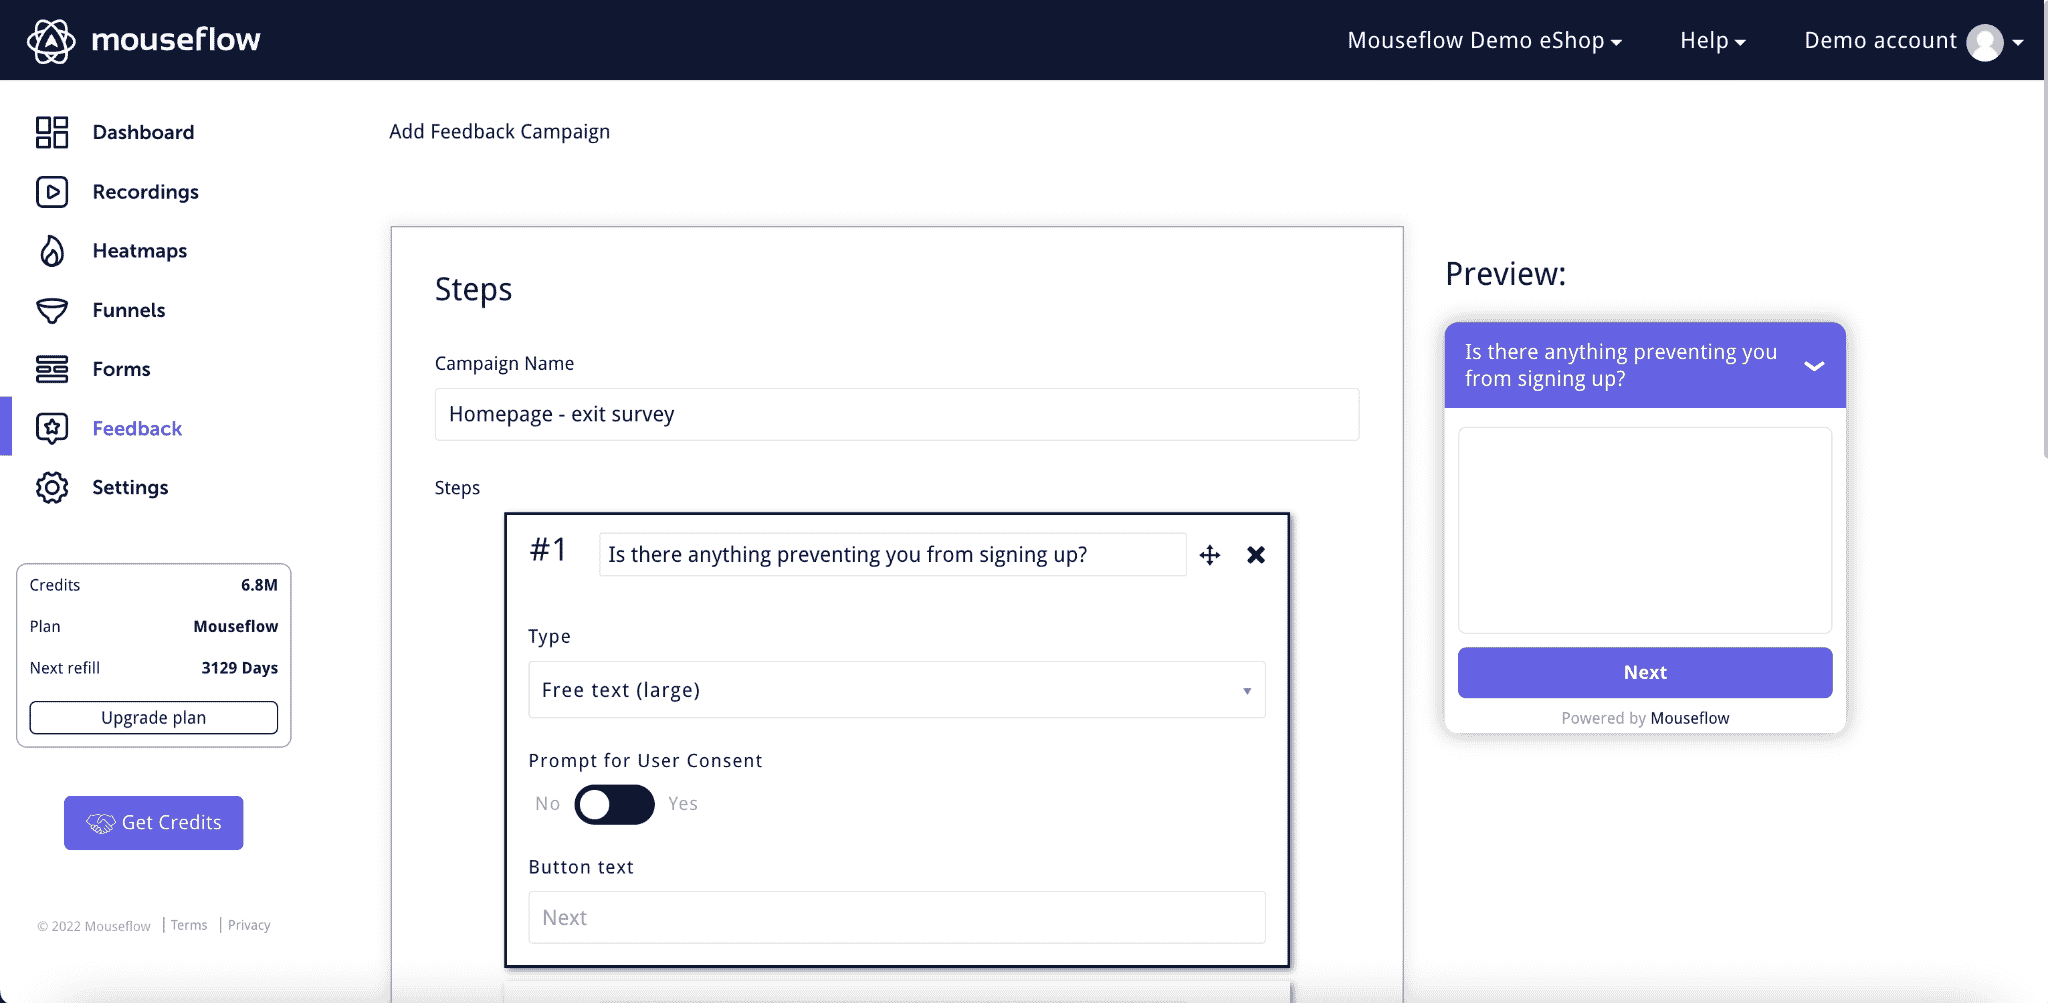
Mouseflow feedback campaign builder
Mouseflow also includes a native feedback tool that lets you run quick surveys or micro-polls right on your site. You can trigger them based on behavior. For example, when someone is about to exit the checkout page, or after they scroll through a long article. You can ask simple yes/no questions, open-ended responses, or even add branded NPS surveys. All responses are linked to session recordings, so if someone says “this page is confusing,” you can see exactly what they saw.
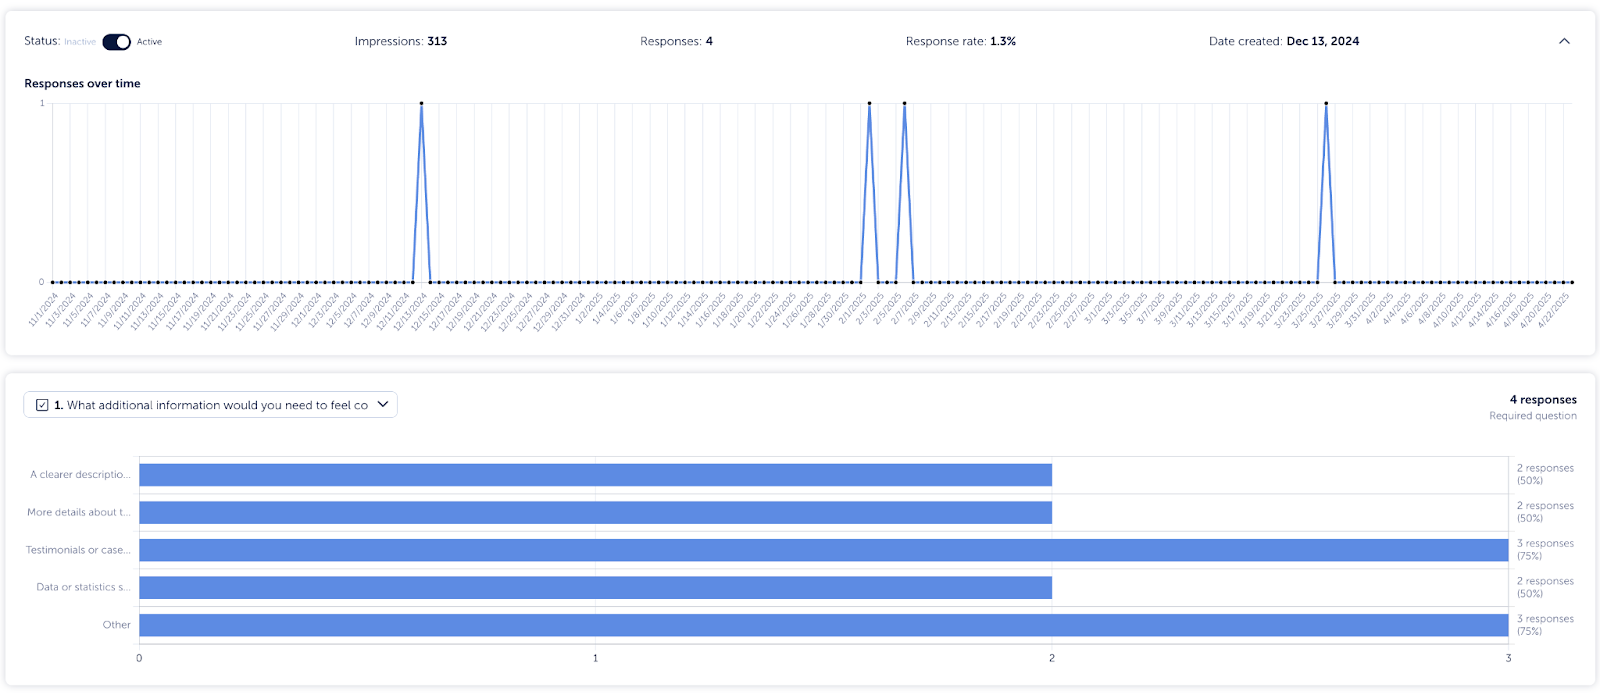
Mouseflow’s Feedback Survey feature
This is all built-in, fully customizable, and included in your plan, no third-party tools needed.
Smartlook doesn’t have a built-in feedback or survey tool. You’d need to use something like Hotjar Surveys, Typeform, or another third-party tool. You can still match feedback to sessions if you sync up the user IDs, but it’s not native to the platform.
Which Tool is Best For Your Team?
Choosing between Mouseflow and Smartlook ultimately comes down to your specific context – your platform (web vs. mobile), your team’s focus, and the kind of insights you value most.
Choose Smartlook if you:
- Want to track both websites and native mobile apps in one tool
- Prefer event-based analytics for product usage and retention tracking
- Need session replay + product analytics in a single platform
- Work on a SaaS or mobile-first product with complex, multi-step flows
- Want built-in integrations with tools like Intercom, Amplitude, Segment, and Slack
- Are early-stage and want a generous free plan with 3,000 sessions/month
But it’s important to note some key limitations with Smartlook. The platform places caps on the number of team members and restricts how many heatmaps you can create. Data retention is also shorter, typically just 30 to 90 days on standard plans. In addition, the number of tracked events is limited unless you upgrade, and important features like API access and SSO are only available on Enterprise plans. Finally, Smartlook lacks a built-in visual privacy tool as well as integrated survey or feedback features, which can be a drawback for teams looking for an all-in-one solution.
So, choose Mouseflow if you:
- Are focused mainly on websites
- Want AI-assisted guidance to help explore and navigate session replay data more efficiently
- Need deeper insights like form analytics, funnel drop-off, and journey mapping
- Want to understand not just where users drop off, but why
- Work in eCommerce, SaaS, CRO, UX, or lead gen, where fixing forms and UX friction drives revenue
- Want built-in tools for on-site surveys, NPS, and triggered feedback
- Need advanced friction detection (rage clicks, hesitation, JS errors) and prioritization
- Prefer full HTML session replays with a downloadable option and Friction Score
- Care about GDPR and CCPA compliance, and need flexible data residency
- Value dedicated onboarding, 24/7 support, and human help when scaling
- Want a visual privacy tool and custom tag manager that lets you define your own behavior tags
If you’re looking for a plug-and-play solution that’s intuitive and powerful for optimizing websites, Mouseflow delivers a full suite of tools that connect funnels, journeys, friction detection, feedback and AI-assisted session replay exploration in one place.
On the other hand, if your team needs deeper product analytics across both mobile and web, and is willing to invest time in custom setup and event tagging, Smartlook could be the better fit.