In this article we cover how to approach the process of conversion rate optimization and offer you 5 steps to improve your conversion rate with Mouseflow.
Focusing on conversion rate optimization is one of the most cost effective marketing activities you can undertake.
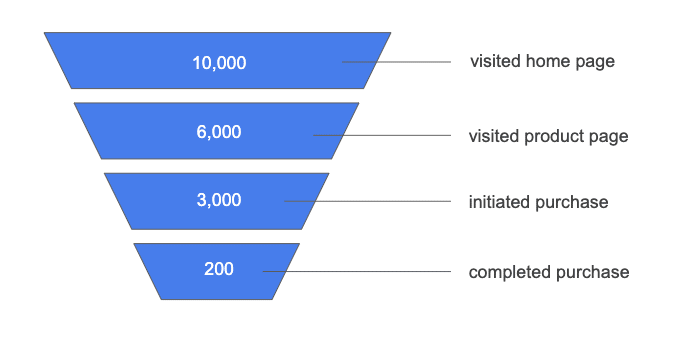
Let’s take a look at the impact by doing some math: an e-commerce business selling a product X, whose traffic is around 10,000 visitors manages to get 6,000 of them to click the product details, of which 3,000 proceed to purchase and 200 end up buying. In the end, the e-commerce business has a conversion rate of 2% (200/10,000).
In order to evaluate the effect of conversion rate optimization, let’s assume the cost of traffic $0.5 per click ($5,000 for 10,000 visitors) which leaves us with $25 per sale.
Moving the conversion rate from 2% to 3% (10,000*3%) results in 100 more purchases and the cost per conversion drops from $25 to $16.6 ($5,000/300). In marketing terms that means it becomes 34% cheaper to bring in a new customer without increasing marketing cost. For business in general this means 150% increase in sales. So, how do you do this?
There are many reasons why potential customers would not follow through on a flow you defined. They can get confused, not know where to click, or feel unease. Most analytics systems won’t go beyond telling you that you have a problem – but Mouseflow takes that one step further by telling you exactly where the problem is. Let us show you how you can get actionable insights on why people are not converting on your website and what you can do to fix that.
Step 1. Define the conversion funnel
In order to improve your conversion rate you first need to identify where potential conversions are ‘leaking out’ of the funnel.
The first thing you need to do is to set a goal – what are you optimizing for? Do you need the customer to purchase a product, sign up, make a booking, or register for an event? Make sure the goal is something you can measure. This is the bottom of your funnel. The rest of the funnel is how the user gets there.
Setting up a funnel analysis on Mouseflow is easy: use the conversion funnel optimization tool and just enter the step-by-step journey you’d like to analyze. It can be as many or as few pages (or group of pages) as you want. Defining a funnel gives you an opportunity to analyze which pages are causing the most drop-offs, so you can optimize the conversion rate on those.
Example:
Let’s take an ecommerce shop as an example and assume the user journey looks like this:
- the user lands on the product details page (PDP),
- then the user proceeds to order the product,
- and after they’ve completed the order, they get to the “thank you” page.
This is how the set up flow looks like in this case:
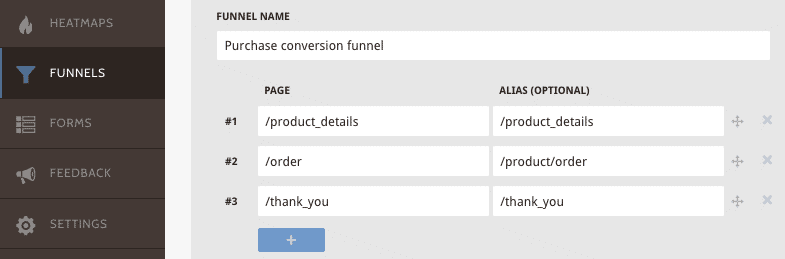
Define the sequence of pages that make up a conversion
Once you’re done, it will look like this:
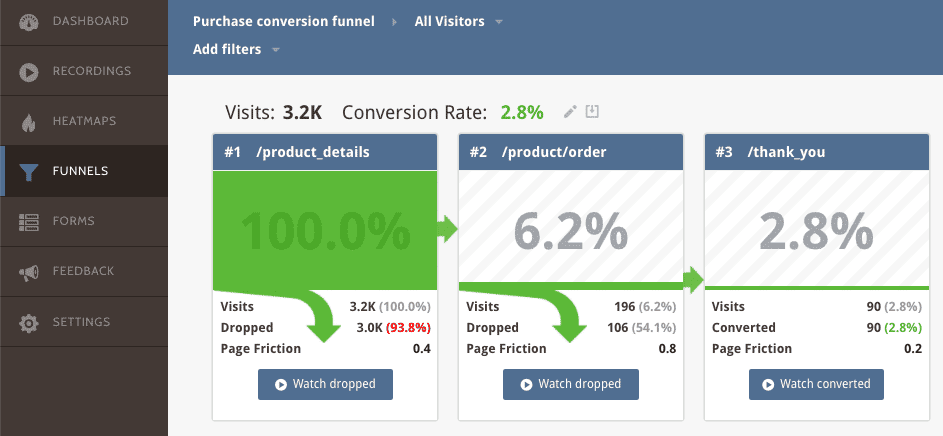
tip: once set, you don’t need to wait for data to populate it is already there
At each step, you’ll see the number of customers you’ve lost and you can go directly to see what these users saw.
Build conversion funnels for most critical user paths – it’ll provide you with a great visual tool for tracking your progress.
Step 2. Eliminate critical errors
A critical error is the most efficient way to ensure that your customers aren’t converting. Picture this: a customer has decided to buy your product, they add to cart and click the “check out” button, but nothing happens. What’s going to happen next? Will they reach out to support on your website or just close the window and buy from somewhere else? The good news is that it’s very easy to identify and fix any critical errors on your site with Mouseflow.
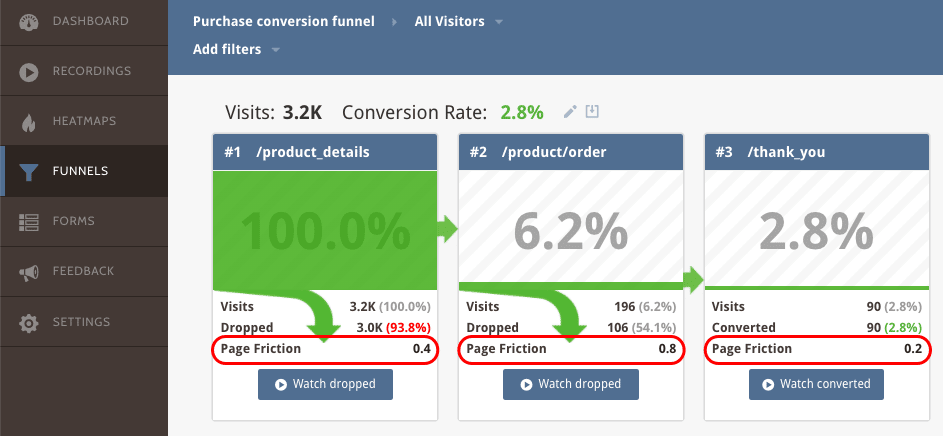
At each step of the funnel you can see Page Friction and can go straight into watching the dropped users.
In mouseflow we suggest you start by looking at Page Friction, which summarizes various sources of frustration a user can encounter, such as click-rage, button errors, speed browsing and more. You can watch visitors that dropped straight from the funnel.
The lowest hanging fruit here would be looking at recordings of the dropped users and identifying the ones with critical triggers, such as click-error (buttons or links that aren’t working). Within the recording you’ll be able to see exactly where the error happened and how. In addition you can share these insights with your development team directly from the recording.
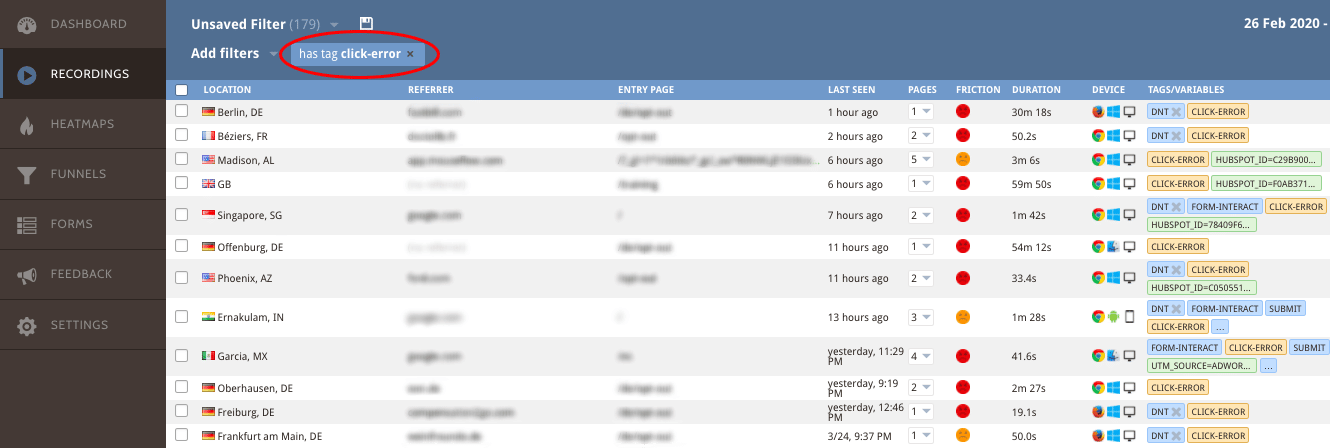
In the list of recordings you can choose to watch the ones that had specific problems, so you only spend time on recordings that may lead to an improvement on your site.
Step 3. Get insights
So far, we’ve gone over analyzing the conversion funnels, identifying key steps in the funnel, and eliminating critical issues. Doing this alone will most likely improve your conversion rates significantly, but why stop there? It’s time to look at the other reasons why your potential customers don’t convert.
First, take a look at the funnel analysis and identify where most of your potential customers leave the funnel. You should concentrate on this page first.
Generally, more people will leave early in the funnel and progressively fewer will leave the further down the funnel they go, – so if you’re seeing a large drop off late in the funnel this is definitely a red flag. This also means that saving a customer from dropping out has more value later in the funnel.
When it comes to analyzing the page we give you the right tools for the job: heat maps and session recordings that let you see exactly where visitors focus their attention and which elements they interact with.
Here are some questions to think about:
- Is the purpose of your page clear to the user?
- Does the user understand the next step?
- If there is a decision, does the user have all the information to make that decision?
- How many users get to see the most important content of your page?
- Are the calls to action (CTAs) easy to identify?
Would you like to know the answers to these questions? Heat maps are a great place to start.
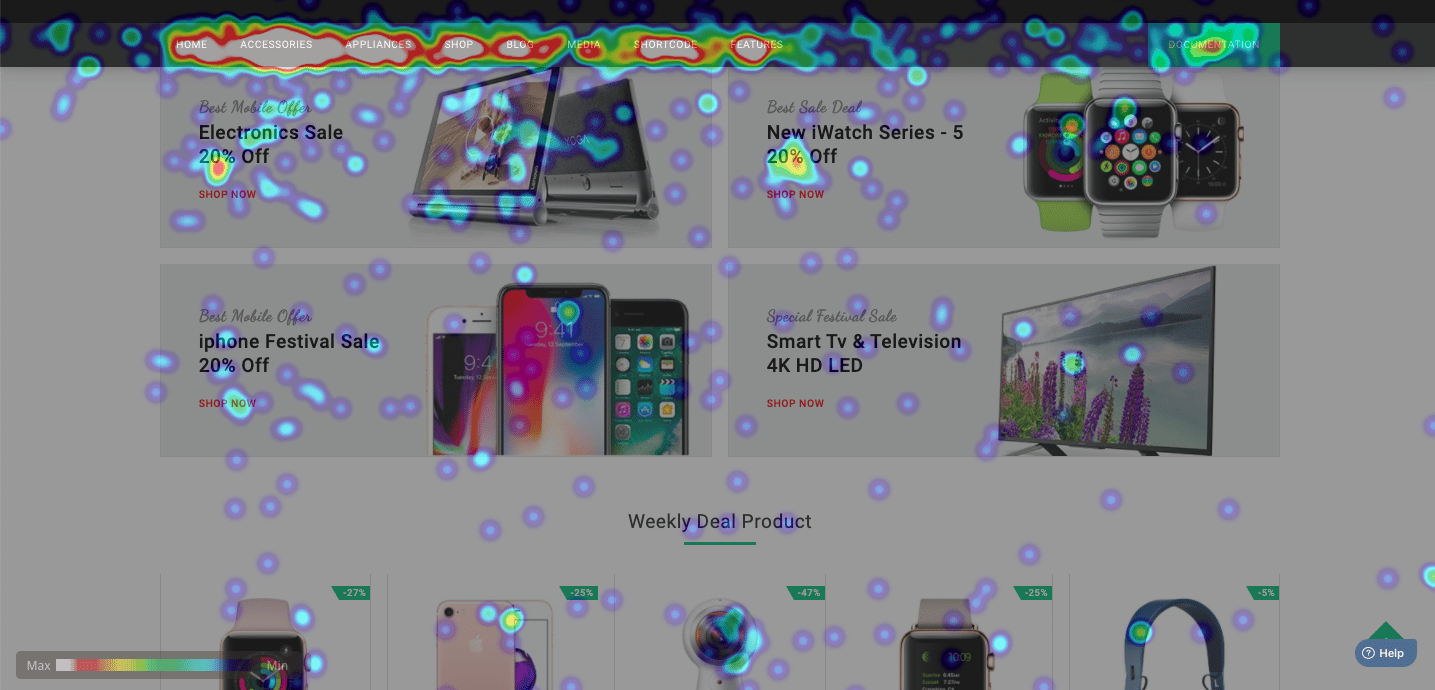
The scroll heat map will tell you what percentage of users gets to see what content:
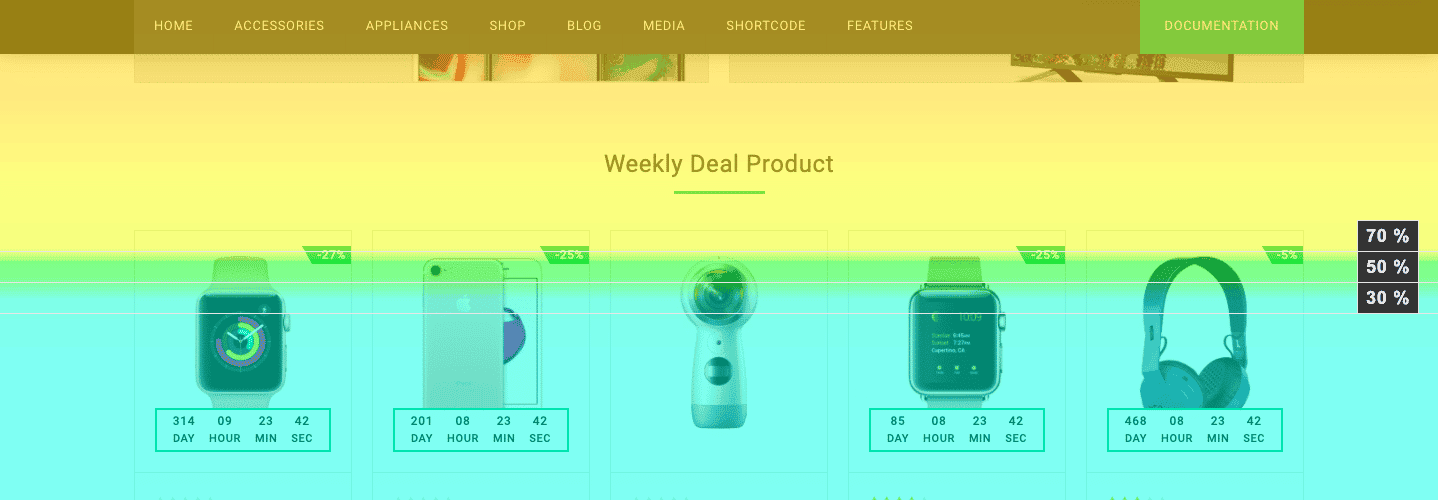
Scroll heat map example
With this example, you see that only 30% of visitors see the products featured on the front page, so moving them up would increase their chance of being viewed and clicked.
Click heat maps show you what catches the user’s attention and what they deem clickable:
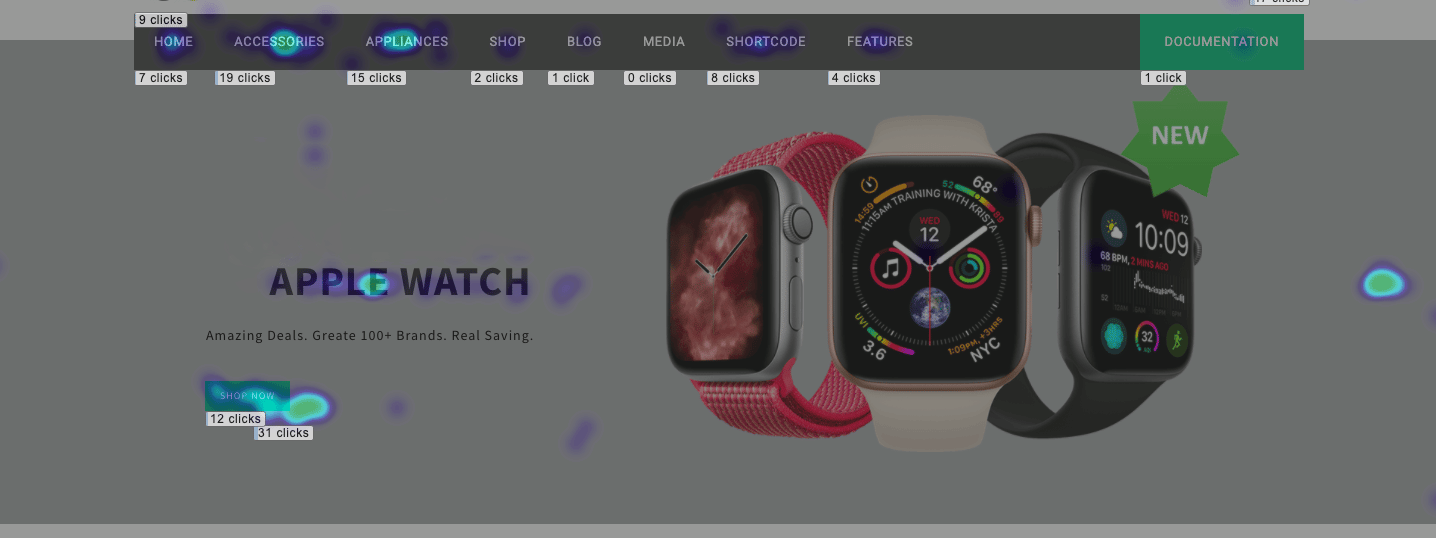
Click heat map example
Movement heat maps will show you where users navigate their mouse on your site – it’s a great way to evaluate attention and engagement.
Movement heat map example
Geo heat maps allow you to spot trends and patterns geographically that otherwise would not be possible. For example, do you know whether you get more cart abandonment in the United States or Canada?
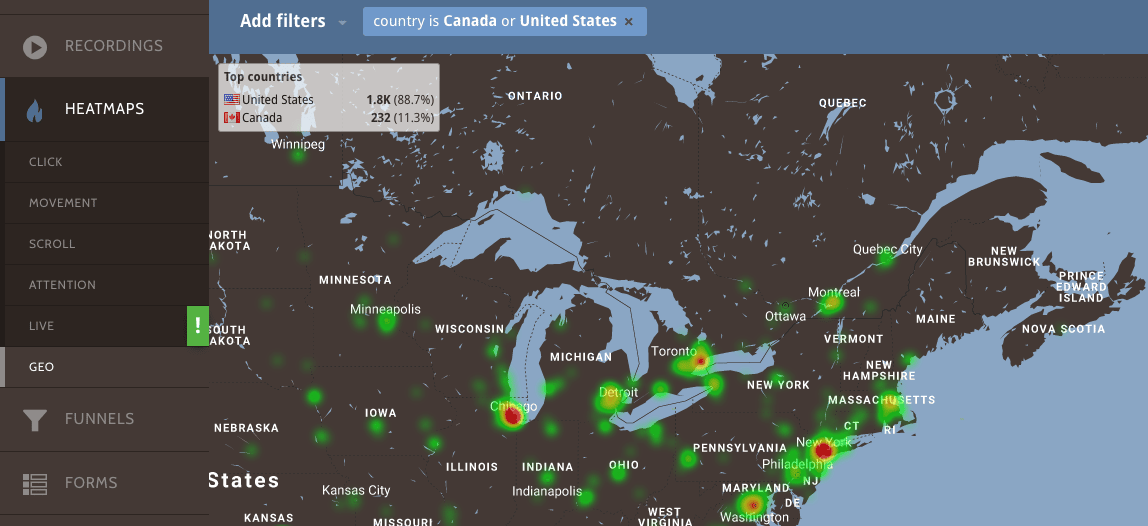
Geo heat map example
You can create/save views for a particular subset of visitors and understand how those visitors behave by region.
Step 4. Analyze your forms
Luke Wroblewski states that “Forms make or break the most crucial online interactions”.
To make sure filling out a form is seamless and transparent to your user, Mouseflow provides you with a form analytics tool, where you see the impact of each field and learn how long it takes your users to complete the form. For example, you’ve decided to start collecting additional user information at check out, this tool will help you identify how those extra fields affect conversions.
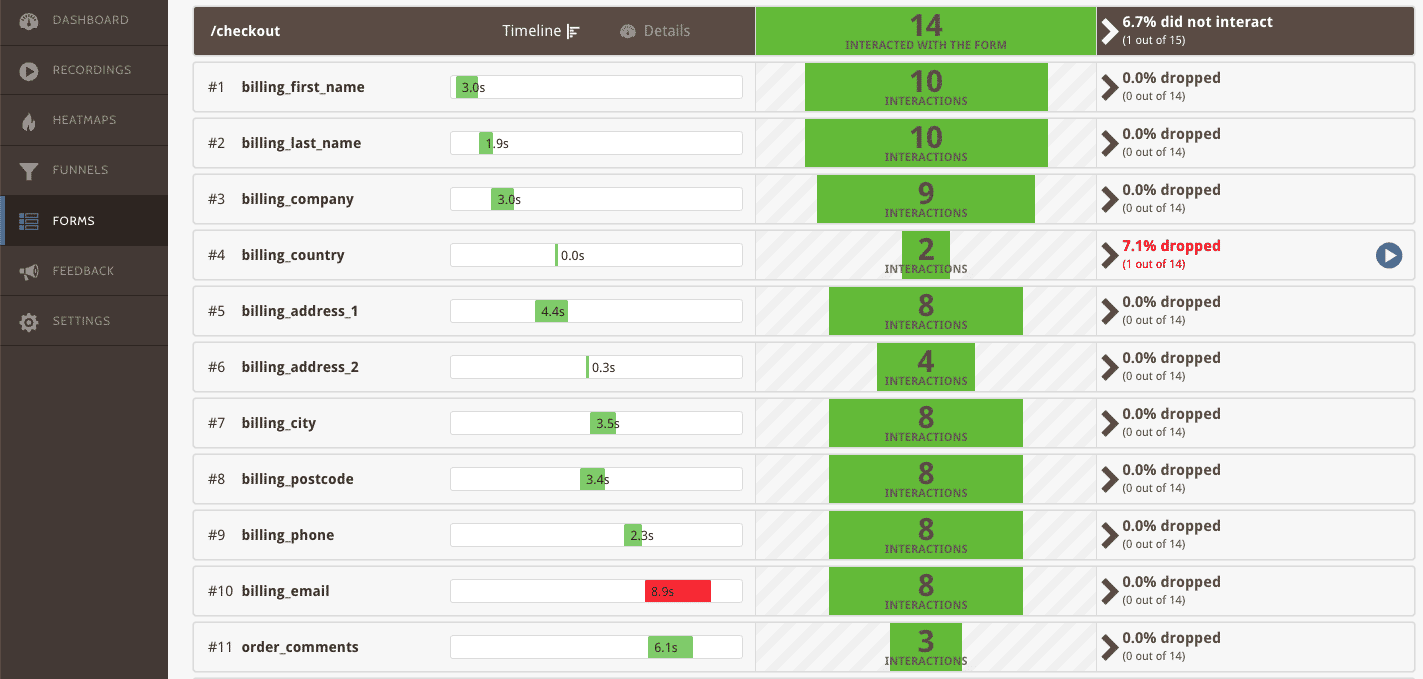
See how much time your users take to fill out the form, the order they take, and where they have difficulties.
Step 5. Make changes and measure
Once you’ve collected insights for the pages in the funnel, you can begin turning those into improvements. The best way to approach this would be prioritizing the list according to your expectation of the impact of a given change. Then, run A/B tests, unless the change is a clear improvement or a fix to an error. Run one test at a time – this will allow you to identify the impact of each change and, if the change is unsuccessful, you’ll know what to roll back.
Finally, make sure that all improvements to the conversion rate affect your business in a positive way. For example, if you remove a number of product details and this increases the conversion rate, that’s a great outcome – but if this change also leads to an increased number of returned products at a later point, then it may be bad for the business as a whole.
