
What if it were possible to squeeze more revenue out of the traffic you’re already bringing to your website?
It likely is. That’s the promise of conversion rate optimization (CRO). But real CRO isn’t about squeezing out an extra 0.5% here and there. Done properly, it’s a structured, evidence-based way to remove friction, improve user experience, and understand what actually drives people to take action.
And CRO doesn’t stop at landing pages. You can apply the same thinking to product onboarding, retention flows, checkout experiences, or lifecycle emails. In many organizations, CRO becomes something bigger than optimization; it becomes a culture of experimentation. A shift from opinions and “best practices” to hypotheses and evidence.
In this guide, we’ll break down conversion rate optimization from first principles: what it really means, how the experimentation process works, how to get internal buy-in, which tools you need, and how real brands apply CRO in practice.
Let’s start with the fundamentals.
What is Conversion Rate Optimization?
Conversion rate optimization (CRO) is the process of improving a website or digital product to increase the percentage of users who complete a desired action, whether that’s making a purchase, signing up, booking a demo, or moving to the next step in a funnel.
Traditionally, CRO has been defined as modifying elements on website pages to increase conversion rates. That definition isn’t wrong, but it’s incomplete.
Because real CRO isn’t about randomly tweaking buttons or rewriting headlines.
It’s about understanding user behavior, forming data-backed hypotheses, and running controlled experiments to learn what actually works.
That’s where the modern view of CRO comes in.
The Traditional Definition of CRO
In many organizations, CRO is treated as a marketing tactic. Traffic comes in, and the goal is to “convert more of it.” So teams test headlines, change CTA colors, or shorten forms, hoping to improve the percentage of visitors who convert.
Sometimes that works. But without structure, this approach often turns into guesswork: small changes, inconsistent results, and little long-term learning. Which is why experienced CRO professionals increasingly prefer another term: Experimentation.
What is Experimentation?
Experimentation is the process of testing data-driven hypotheses by running controlled experiments.
Instead of asking, “How do we increase conversions?” the question becomes: “What do we believe is preventing users from converting, and how can we test that belief?”
Experiments involve changing specific elements of a website or product in order to validate (or invalidate) a clearly defined hypothesis. The goal is not just to increase conversion rates, but to learn something meaningful about user behavior.
One of the outcomes of that learning is often higher conversions. But conversion lift is a byproduct, not the sole purpose.
If you want a deeper breakdown of how structured experimentation works in practice, we’ve outlined it step by step in our guide to building a product experimentation framework.
At its core, experimentation relies on the scientific method:
- Form a hypothesis based on data
- Design an experiment to test it
- Run the test
- Analyze the results
- Apply the learning and repeat
It’s less about “optimizing pages” and more about building a repeatable system for making better decisions.
And that mindset can extend far beyond marketing, into product development, onboarding flows, pricing, retention, and even operations.
Why This Definition Matters
When CRO is reduced to “improving conversion rates,” teams often:
- Run tests without strong hypotheses
- Change elements without measuring impact
- Focus only on short-term gains
- Ignore why a variation won or lost
But when CRO is approached as experimentation, it becomes a discipline. A way to reduce risk, replace assumptions with evidence, and create a culture where decisions are tested instead of debated.
That’s the difference between tactical CRO and strategic CRO. And that distinction shapes everything else in this guide.
What Conversion Rate Optimization Isn’t?
If conversion rate optimization is misunderstood, it’s usually because it’s reduced to tactics. But real CRO is not a collection of random improvements. It’s a structured, repeatable process.
Understanding what it isn’t helps clarify what it actually requires.
CRO Isn’t Random Website Tweaks
Changing elements on a website without running a controlled test isn’t conversion rate optimization. It may improve performance. It may hurt performance. But without measurement and validation, you won’t know why.
CRO requires:
- A defined hypothesis
- A measurable success metric
- A structured experiment
Without those elements, you’re redesigning, not optimizing.
CRO Isn’t Blindly Following “Best Practices”
Best practices can be useful inspiration. But they’re not universal laws.
What increases conversions for one audience may decrease them for another. Context matter; industry, traffic source, user intent, brand trust, and dozens of other variables all influence behavior.
In CRO, “best practice” should become a hypothesis, not a shortcut.
CRO Isn’t Spaghetti Testing
Running experiments without research, prioritization, or documentation leads to scattered results and shallow insights.
If experimentation isn’t aligned with clear business goals, it becomes noise. That’s why mature experimentation programs rely on structured planning and prioritization, often documented in a clear CRO roadmap. to ensure experiments build on each other instead of existing in isolation.
CRO Isn’t Just About Increasing a Metric
Conversion rate is the outcome. CRO is the system behind it.
When teams focus only on lifting the percentage, they risk overlooking the real objective: understanding user behavior and reducing friction.
Higher conversions are a result of better decisions, not the goal in isolation.
Why Should You Care? (The Benefits of Conversion Rate Optimization)
Conversion rate optimization isn’t just about improving a metric on a dashboard. Done properly, it changes how teams make decisions.
Instead of asking, “How do we get more traffic?” the question becomes: “How do we create more value from the traffic we already have?”. That shift has measurable business impact.
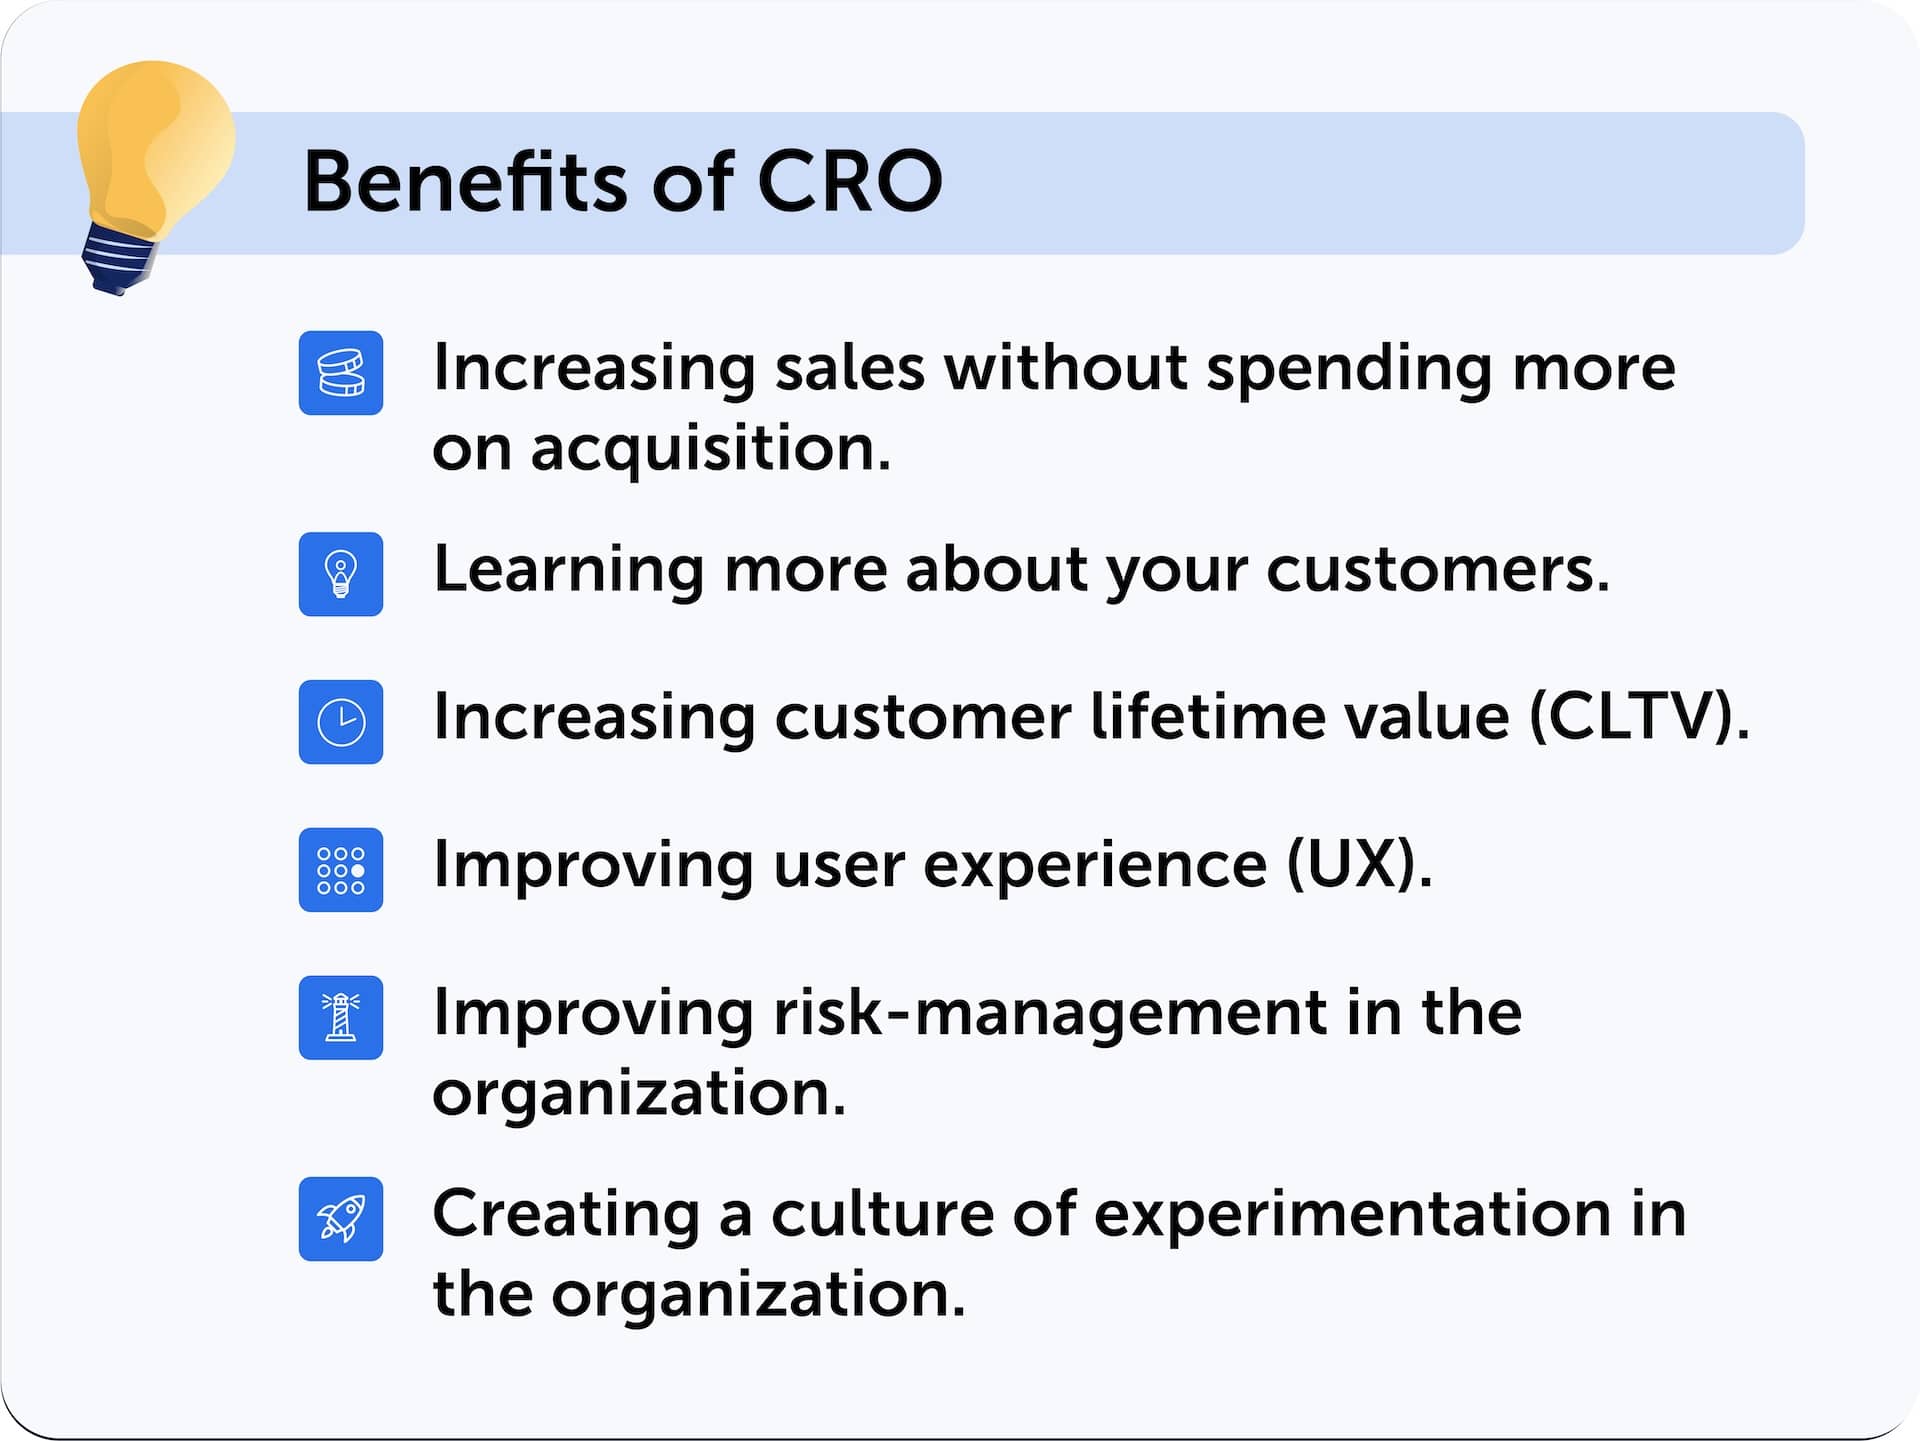
1. Increasing Revenue Without Increasing Acquisition Costs
For many companies, “increase sales” translates into “increase ad spend.” CRO challenges that logic. When you improve conversion rates, you improve what happens after acquisition. The same traffic can generate more revenue, without increasing marketing costs.
Even modest improvements compound quickly. A 10% increase in conversion rate doesn’t just improve sales. It improves return on ad spend (ROAS), customer acquisition efficiency, and overall profitability. For example, structured ecommerce experimentation has produced immediate ROI gains for brands running data-driven tests, not redesigns, but validated improvements. (See examples of ecommerce CRO experiments with measurable ROI).
2. Learning What Actually Drives Customer Behavior
Every experiment generates insight, not just results.
You learn:
- What reduces friction
- What builds trust
- What creates hesitation
- What messaging resonates
- What objections remain unresolved
Over time, these learnings compound into a deeper understanding of your audience. That understanding improves:
- Marketing messaging
- Product decisions
- Pricing strategy
- Onboarding flows
- Retention efforts
This is why experienced teams treat CRO as a learning engine, not a conversion hack.
3. Increasing Customer Lifetime Value (CLTV)
CRO doesn’t stop at the first purchase or sign-up. Experimentation can be applied across the entire customer lifecycle:
- Onboarding
- Feature adoption
- Upgrade prompts
- Checkout flow
- Post-purchase engagement
By systematically removing friction and increasing perceived value, you improve retention and lifetime value, not just initial conversion rate.
This is especially relevant in SaaS and subscription businesses, where optimization often focuses on activation and retention rather than immediate transactions.
(We explore this further in our guide to CRO for SaaS.)
4. Improving User Experience
Many CRO experiments aim to remove confusion, reduce cognitive load, and simplify decision-making. In other words: better UX.
When users find what they need faster, understand your value more clearly, and trust your offering, conversion rate improves naturally. This alignment between UX and CRO is critical. Optimization should enhance the experience — not manipulate it.
5. Improving Risk-Management in the Organization
Making changes without validation introduces risk. Experimentation reduces that risk.
Instead of launching major changes based on assumptions, you validate them through controlled tests. If a variation underperforms, you learn without damaging long-term performance.
This turns experimentation into a risk-management mechanism, not just a growth tactic.
6. Creating a Culture of Experimentation in the Organization
Perhaps the biggest long-term benefit of CRO is cultural. When teams adopt experimentation:
- Opinions carry less weight than data
- Decisions are tested instead of debated
- Assumptions are challenged
- Learning becomes continuous
But cultural change rarely happens automatically. It requires alignment, stakeholder buy-in, and consistent communication of results.
If you’re trying to build support internally, understanding how to navigate common CRO stakeholders and turn them into allies can make the difference between isolated tests and a company-wide experimentation program.
Getting Buy-in for a CRO Program
If you weren’t convinced that CRO is worth implementing in your organization, hopefully you are now. But there’s still a hurdle: convincing stakeholders.
In most cases, the most effective way to gain support is simple: show the return on investment. Let’s walk through a straightforward example.
Conversion Rate Optimization ROI Example
Imagine you spend $10,000 per month on traffic acquisition, bringing 20,000 sessions to your website.
Those sessions generate 400 sales at $100 each, resulting in $40,000 in revenue — or $30,000 after deducting acquisition costs.
Your conversion rate in this scenario is 2%.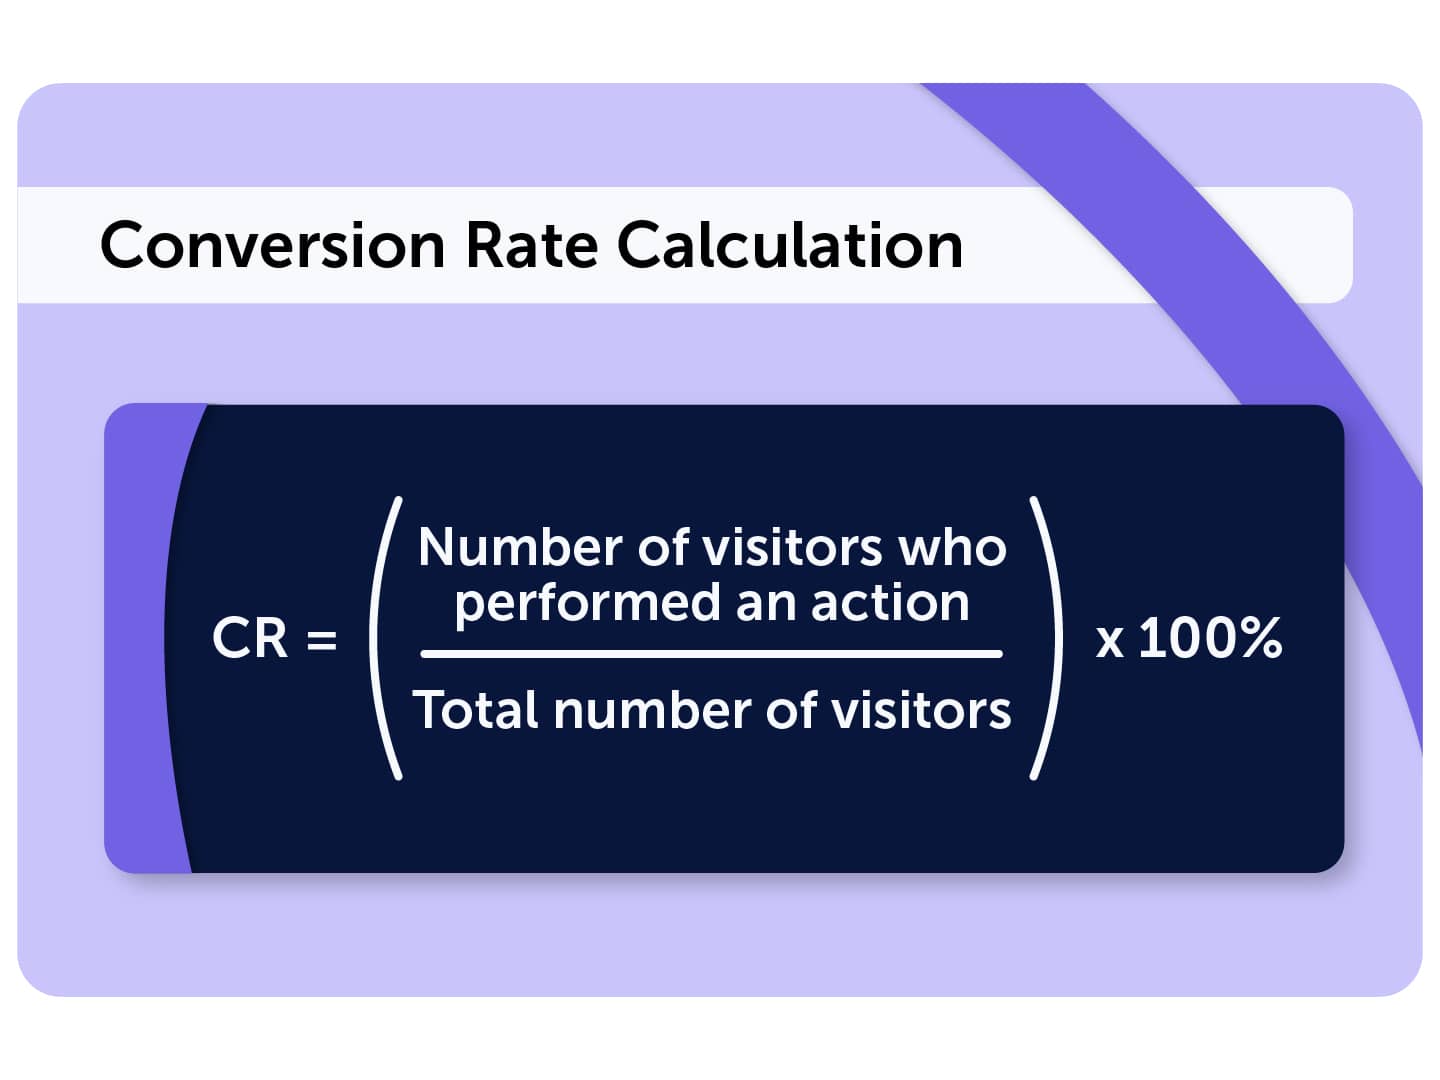
Now imagine you analyze user behavior, identify friction points, and run a few structured experiments. As a result, you improve conversion rate by 10% (from 2% to 2.2%.)
With the same $10,000 spend and the same 20,000 sessions, you now generate 440 sales. That’s $44,000 in revenue, or $34,000 after acquisition costs. A relatively modest improvement in conversion rate has increased net revenue by roughly 13%, without increasing marketing spend.
That’s the power of optimization.
Framed this way, CRO isn’t about design changes. It’s about revenue efficiency. And a 10% lift is far from unrealistic. For example, the global ecommerce brand RAINS achieved a similar improvement by systematically analyzing behavior and running controlled experiments.
The CRO Process: From Evidence to Experimentation
Conversion rate optimization only works when it’s systematic.
If experiments are run in isolation, driven by instinct, urgency, or random ideas, results will feel inconsistent. But when CRO follows a clear process, experimentation becomes repeatable and scalable.
At its core, the CRO process follows a simple loop:
Gather evidence → Form a hypothesis → Run a controlled test → Analyze results → Apply learning → Repeat.
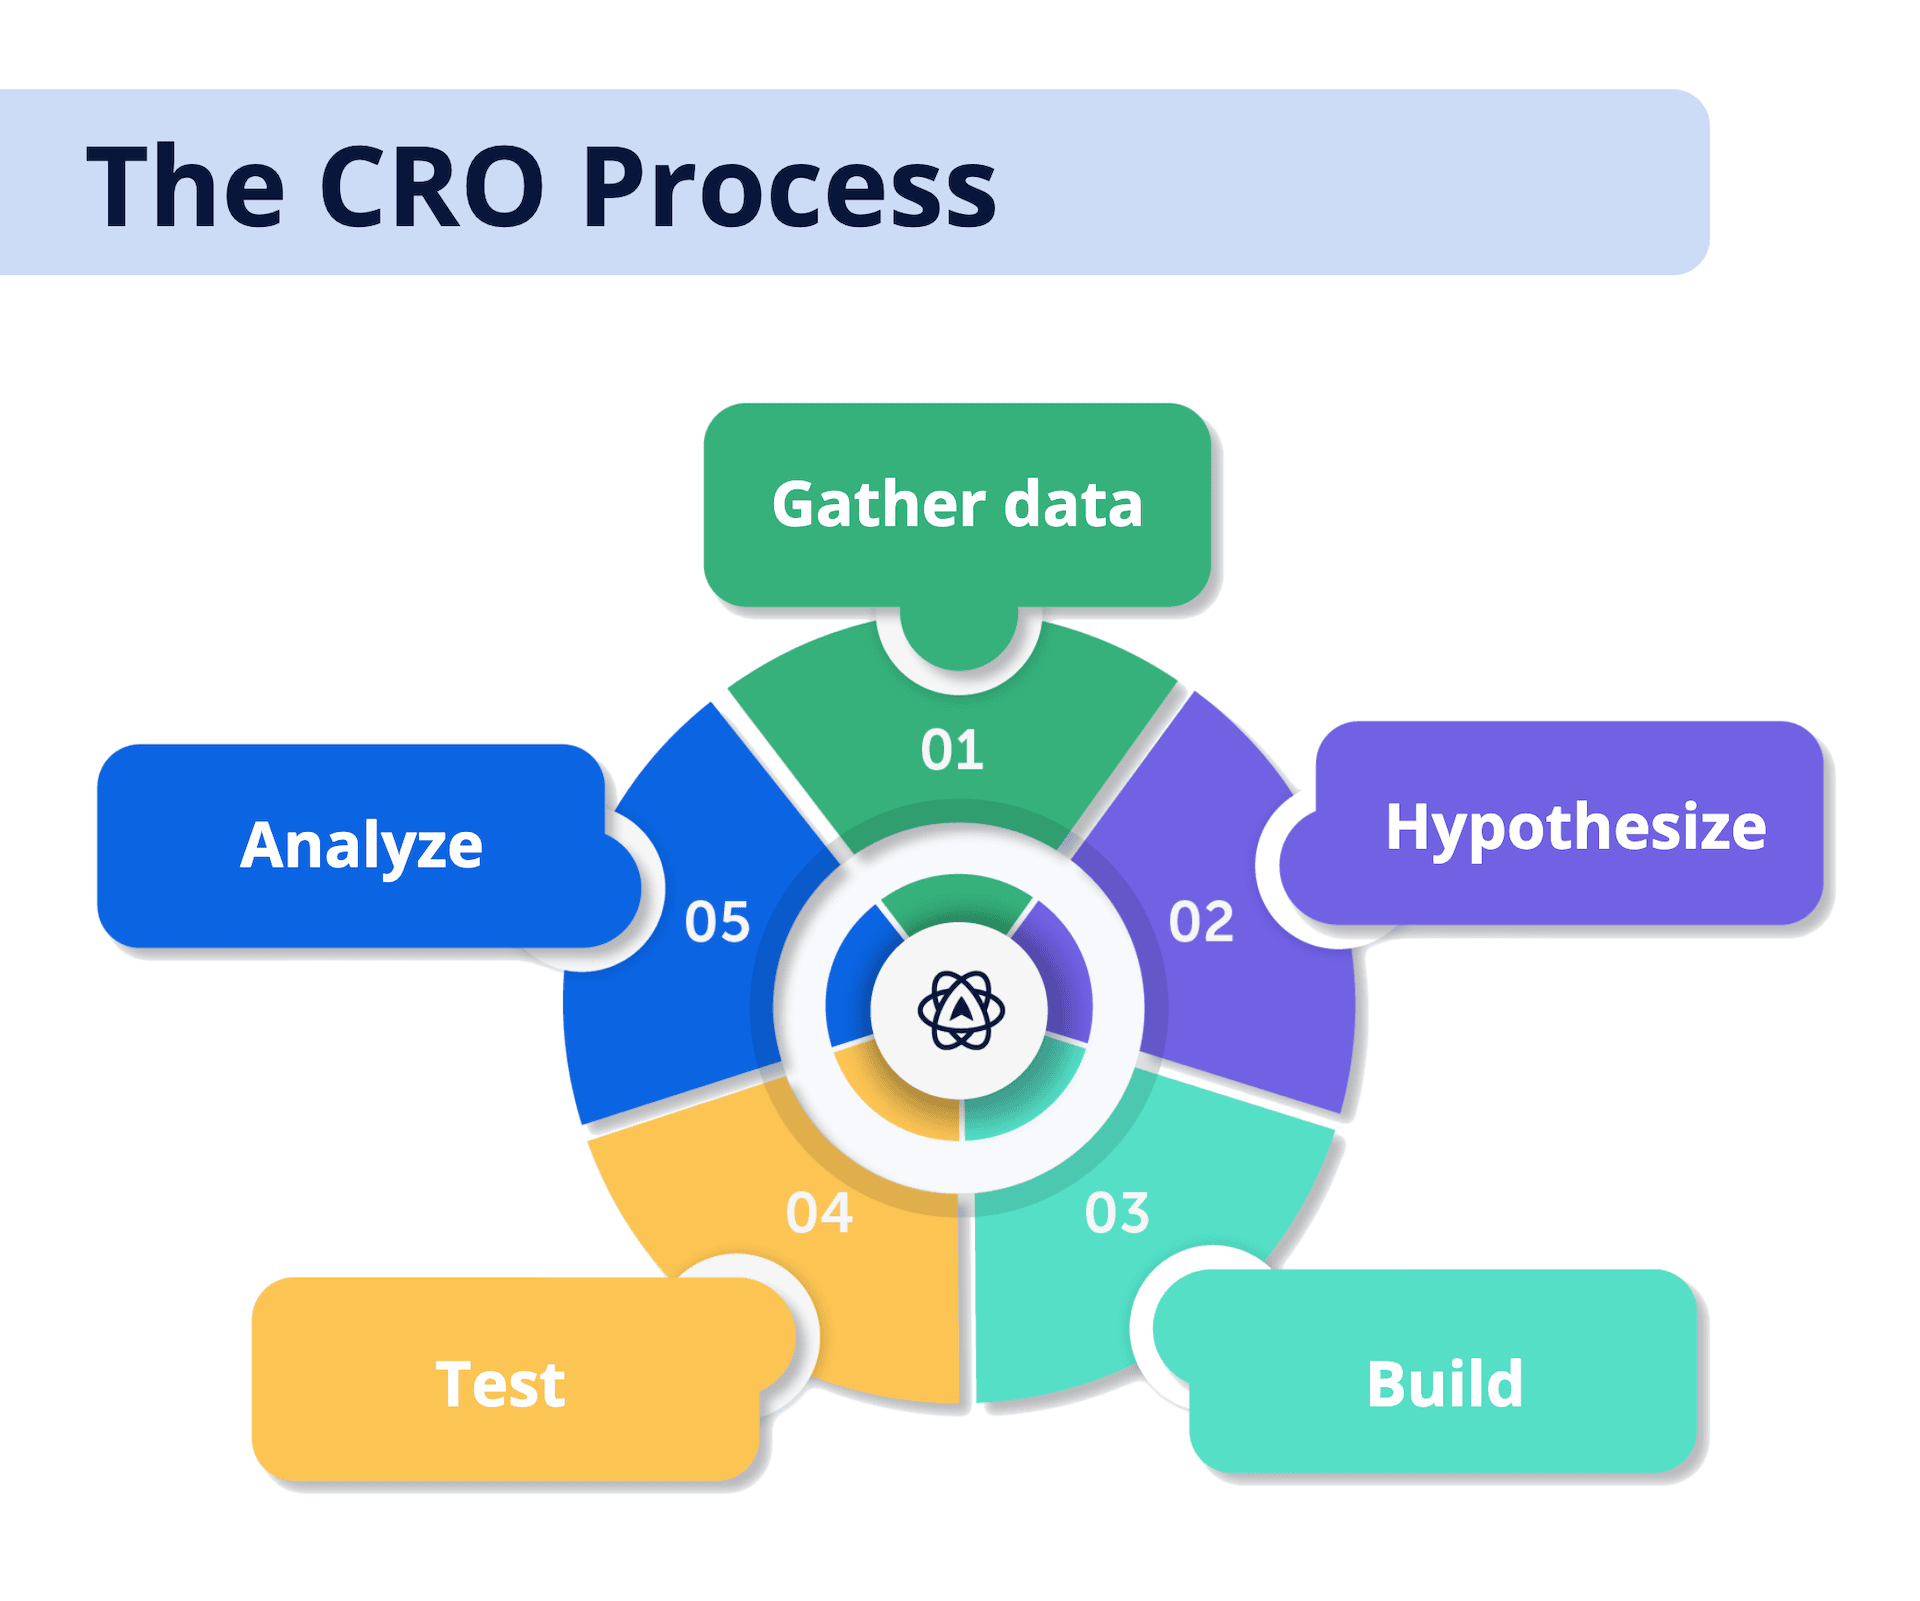
1. Gathering Evidence (Not Just Data)
Every strong experiment begins with observation. But there’s a difference between collecting data and gathering evidence.
Dashboards tell you what is happening. Behavioral insight helps you understand how users interact. Feedback and qualitative research reveal why they behave that way.
High-performing CRO teams combine:
- Quantitative analytics (drop-offs, funnel abandonment, conversion paths)
- Behavioral analysis (scroll depth, hesitation, rage clicks, friction patterns)
- Direct user feedback and testing
The goal isn’t to generate more reports. It’s to identify meaningful patterns.
And accuracy matters. If your analytics platform relies heavily on sampling, your conclusions may already be distorted before testing even begins. We’ve broken down how data sampling in web analytics can affect CRO decisions and what to look out for.
When evidence consistently points to friction or confusion, it’s time to move from observation to assumption.
2. Building a Strong, Testable Hypothesis
A hypothesis connects behavior to change. Without that connection, experimentation turns into guesswork.
A structured CRO hypothesis typically includes:
- The observed behavior or friction point
- The proposed change
- The expected behavioral outcome
- The primary metric that will determine success
For a practical walkthrough of how to structure and document hypotheses properly, see our guide to writing a CRO hypothesis.
Documentation is not bureaucracy. It ensures:
- Clarity across teams
- Measurable evaluation
- Consistent learning
- Reduced bias
It also makes prioritization possible. Not every idea deserves a test. Hypotheses should be evaluated based on expected impact, effort, and confidence — and aligned with broader business objectives.
Once a hypothesis is clearly defined and prioritized, experimentation can begin.
3. Running Structured Experiments
Most CRO programs rely on A/B testing to isolate variables and measure impact. But test type is less important than execution discipline.
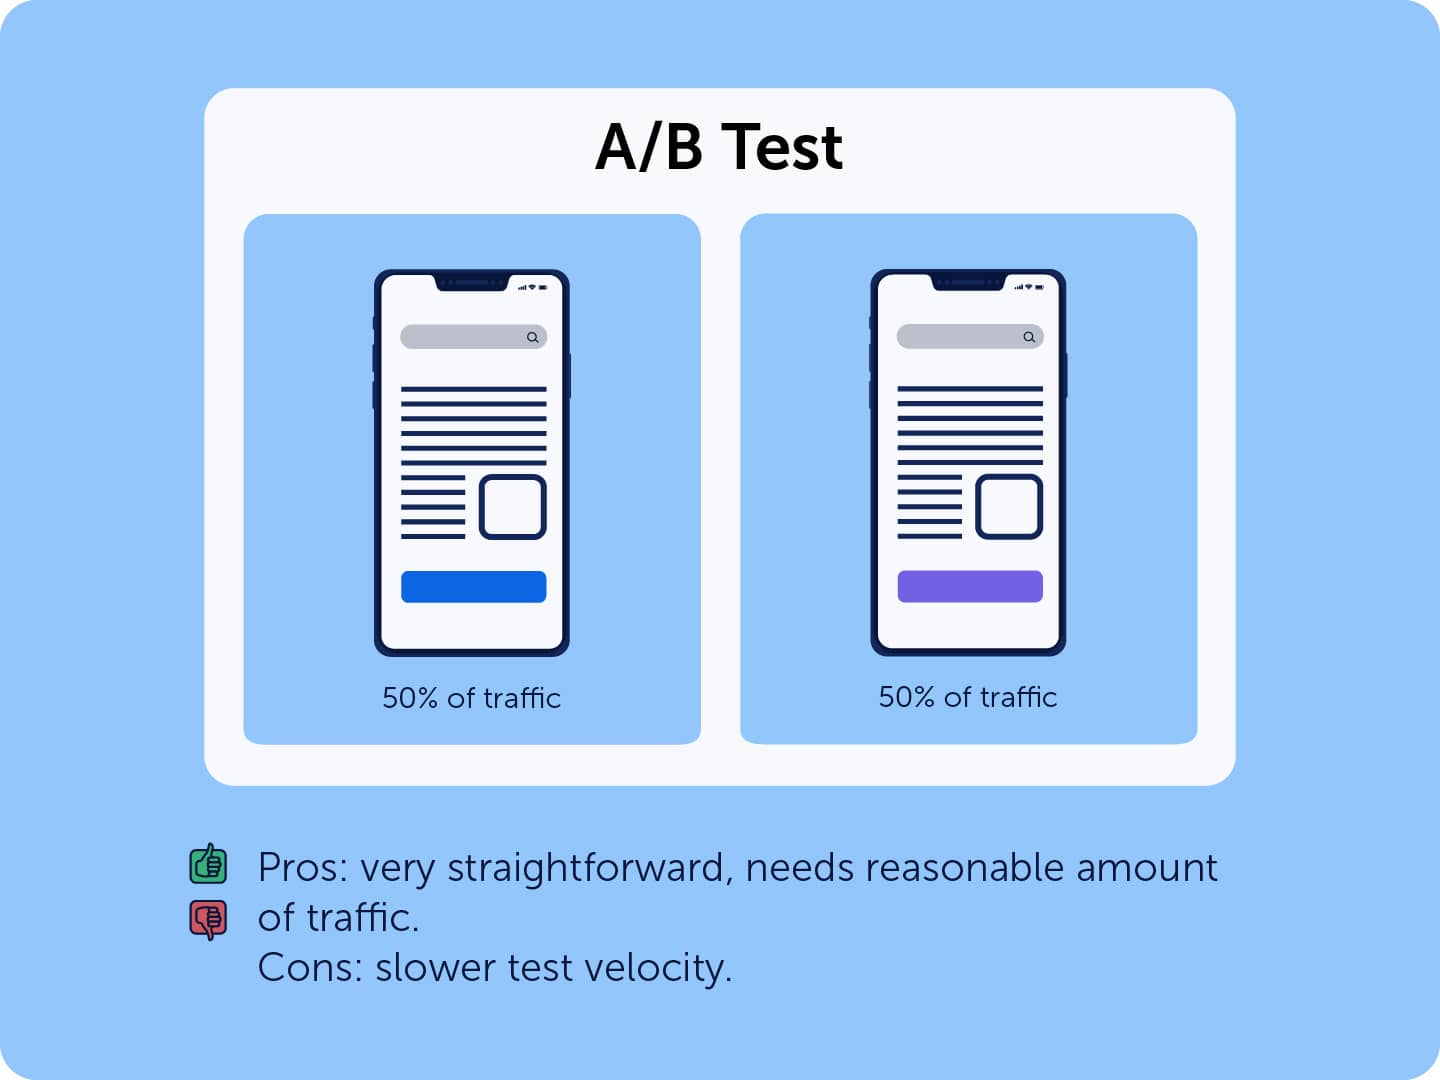
A/B test explanation
Before launching an experiment, teams should define:
- The primary success metric
- Secondary metrics to monitor unintended effects
- The expected test duration
- The sample size required for meaningful conclusions
Stopping tests early or ignoring statistical context can invalidate results, even when the variation appears to “win.”
If you want a detailed breakdown of setup, common pitfalls, and evaluation standards, we’ve covered it step by step in our guide to running a proper CRO test.
It’s also important to recognize that experimentation looks different depending on traffic volume. For lower-traffic websites, traditional A/B tests may take months to reach statistical significance. That doesn’t mean optimization stops. It means methodology adapts, often relying more heavily on qualitative signals and directional testing. We explore those approaches in our guide to CRO for low-traffic websites.
For ecommerce businesses specifically, friction often concentrates around product pages, cart flow, and checkout. If you’re looking for common testing opportunities in that environment, our ecommerce optimization checklist outlines areas frequently worth investigating.
4. Analyzing Results and Extracting Insight
When a test concludes, the most important question isn’t: “Did it win?” It’s: “What did we learn?”
Winning variations reveal what resonates. Losing variations expose flawed assumptions. Both improve future decision-making.
Analysis should go beyond surface-level conversion rate shifts. Consider:
- Did user behavior change meaningfully?
- Did friction decrease or move elsewhere?
- Did secondary metrics shift unexpectedly?
- What does this tell you about customer intent?
Over time, structured experimentation sharpens intuition. Patterns emerge. Assumptions become better informed.
Many experienced practitioners describe CRO as transformative not because of isolated uplifts, but because of the discipline it introduces into decision-making. In our collection of CRO professionals sharing life-changing learnings, experts reflect on how experimentation reshaped the way they approach growth and product decisions.
That perspective is what turns testing into long-term capability.
The CRO Flywheel
When executed properly, CRO becomes cyclical:
Evidence informs hypotheses.
Hypotheses drive experiments.
Experiments generate insight.
Insight improves future hypotheses.
Over time, this loop reduces guesswork, increases decision quality, and builds organizational confidence in experimentation.
That’s the difference between occasionally “running tests” and operating a mature CRO program.
CRO Tools and Technology
CRO is a process, but that process relies on infrastructure.
Without the right tools, experimentation becomes slow, fragmented, or unreliable. With the right stack, insights become clearer and decisions more confident.
That doesn’t mean you need dozens of platforms. But it does mean you need coverage across a few critical areas.
Quantitative Analytics
Every CRO program starts with numbers. You need to understand:
- Where users enter
- Where they drop off
- Which funnels underperform
- Which segments behave differently
This is where quantitative analytics platforms play a central role. They allow you to measure baseline performance and evaluate experimental impact.
But numbers alone don’t explain behavior. They show you what happened, not why.
Behavioral Analytics (Session Replay & Heatmaps)
Behavioral tools bridge that gap.
Session replays, heatmaps, and interaction tracking reveal how users actually navigate your pages. They expose hesitation, friction, confusion, and intent patterns that traditional analytics can’t surface.
This layer is often where the most valuable hypotheses originate.
When evaluating behavioral tools, precision matters. Data sampling, replay clarity, and filtering capabilities can dramatically affect the quality of insight.
If you’re comparing platforms across analytics, experimentation, and behavior tracking, we’ve reviewed the best CRO tools across different categories, outlining what to look for and where different platforms excel.
A/B Testing and Experimentation Platforms
Once hypotheses are formed, you need infrastructure to validate them.
A/B testing tools allow you to isolate changes, distribute traffic between variations, and measure impact with statistical rigor.
Key considerations include:
- Integration with analytics platforms
- Performance impact on page load speed
- Ease of experiment setup
- Segmentation and targeting capabilities
The right experimentation platform should integrate smoothly into your broader CRO stack rather than operate in isolation.
Supporting Tools: Feedback, Forms, and Research
Beyond analytics and testing, mature CRO programs often rely on additional layers:
- On-site surveys and feedback tools
- Form analytics
- User testing platforms
- Research repositories
These tools deepen qualitative understanding and reduce reliance on assumptions.
Not every business needs every tool, but gaps in visibility usually translate into weaker hypotheses.
Comparing CRO Platforms
At some point, tool selection becomes unavoidable.
If you’re evaluating session replay and behavioral analytics platforms specifically, we’ve broken down detailed comparisons to help clarify differences in capability and positioning:
These comparisons focus on functionality, precision, and use-case differences rather than surface-level feature lists.
The Role of AI in Modern CRO
As experimentation matures, AI-driven analysis is becoming more common: from automated insight detection to predictive behavior modeling.
AI doesn’t replace experimentation. It accelerates pattern recognition and insight generation.
We’ve explored how experts see AI shaping the future of CRO, including where it adds value and where human interpretation still matters most.
CRO Case Studies
We’ve talked enough about theory, now let’s take a look at some real life examples of how brands optimize their websites for conversions and adopt experimentation mindsets.
How Rains Increased Conversions by 10%
A Danish fashion brand Rains improved their website conversion rates by 9.8% for the cart and 10.8% for the checkout flow.
They used Mouseflow to record over 500,000 sessions and then analyzed them to identify pages with high friction and errors.
They turned insights from session recordings and heatmaps into hypotheses for A/B testing with Google Optimize (may it rest in peace, we miss it too). Their tests focused on usability improvements like making unclickable elements clickable and refining the checkout process.
They implemented the changes when the probability of the test being conclusive was over 90%. We already mentioned the results – a ~10% CR increase.
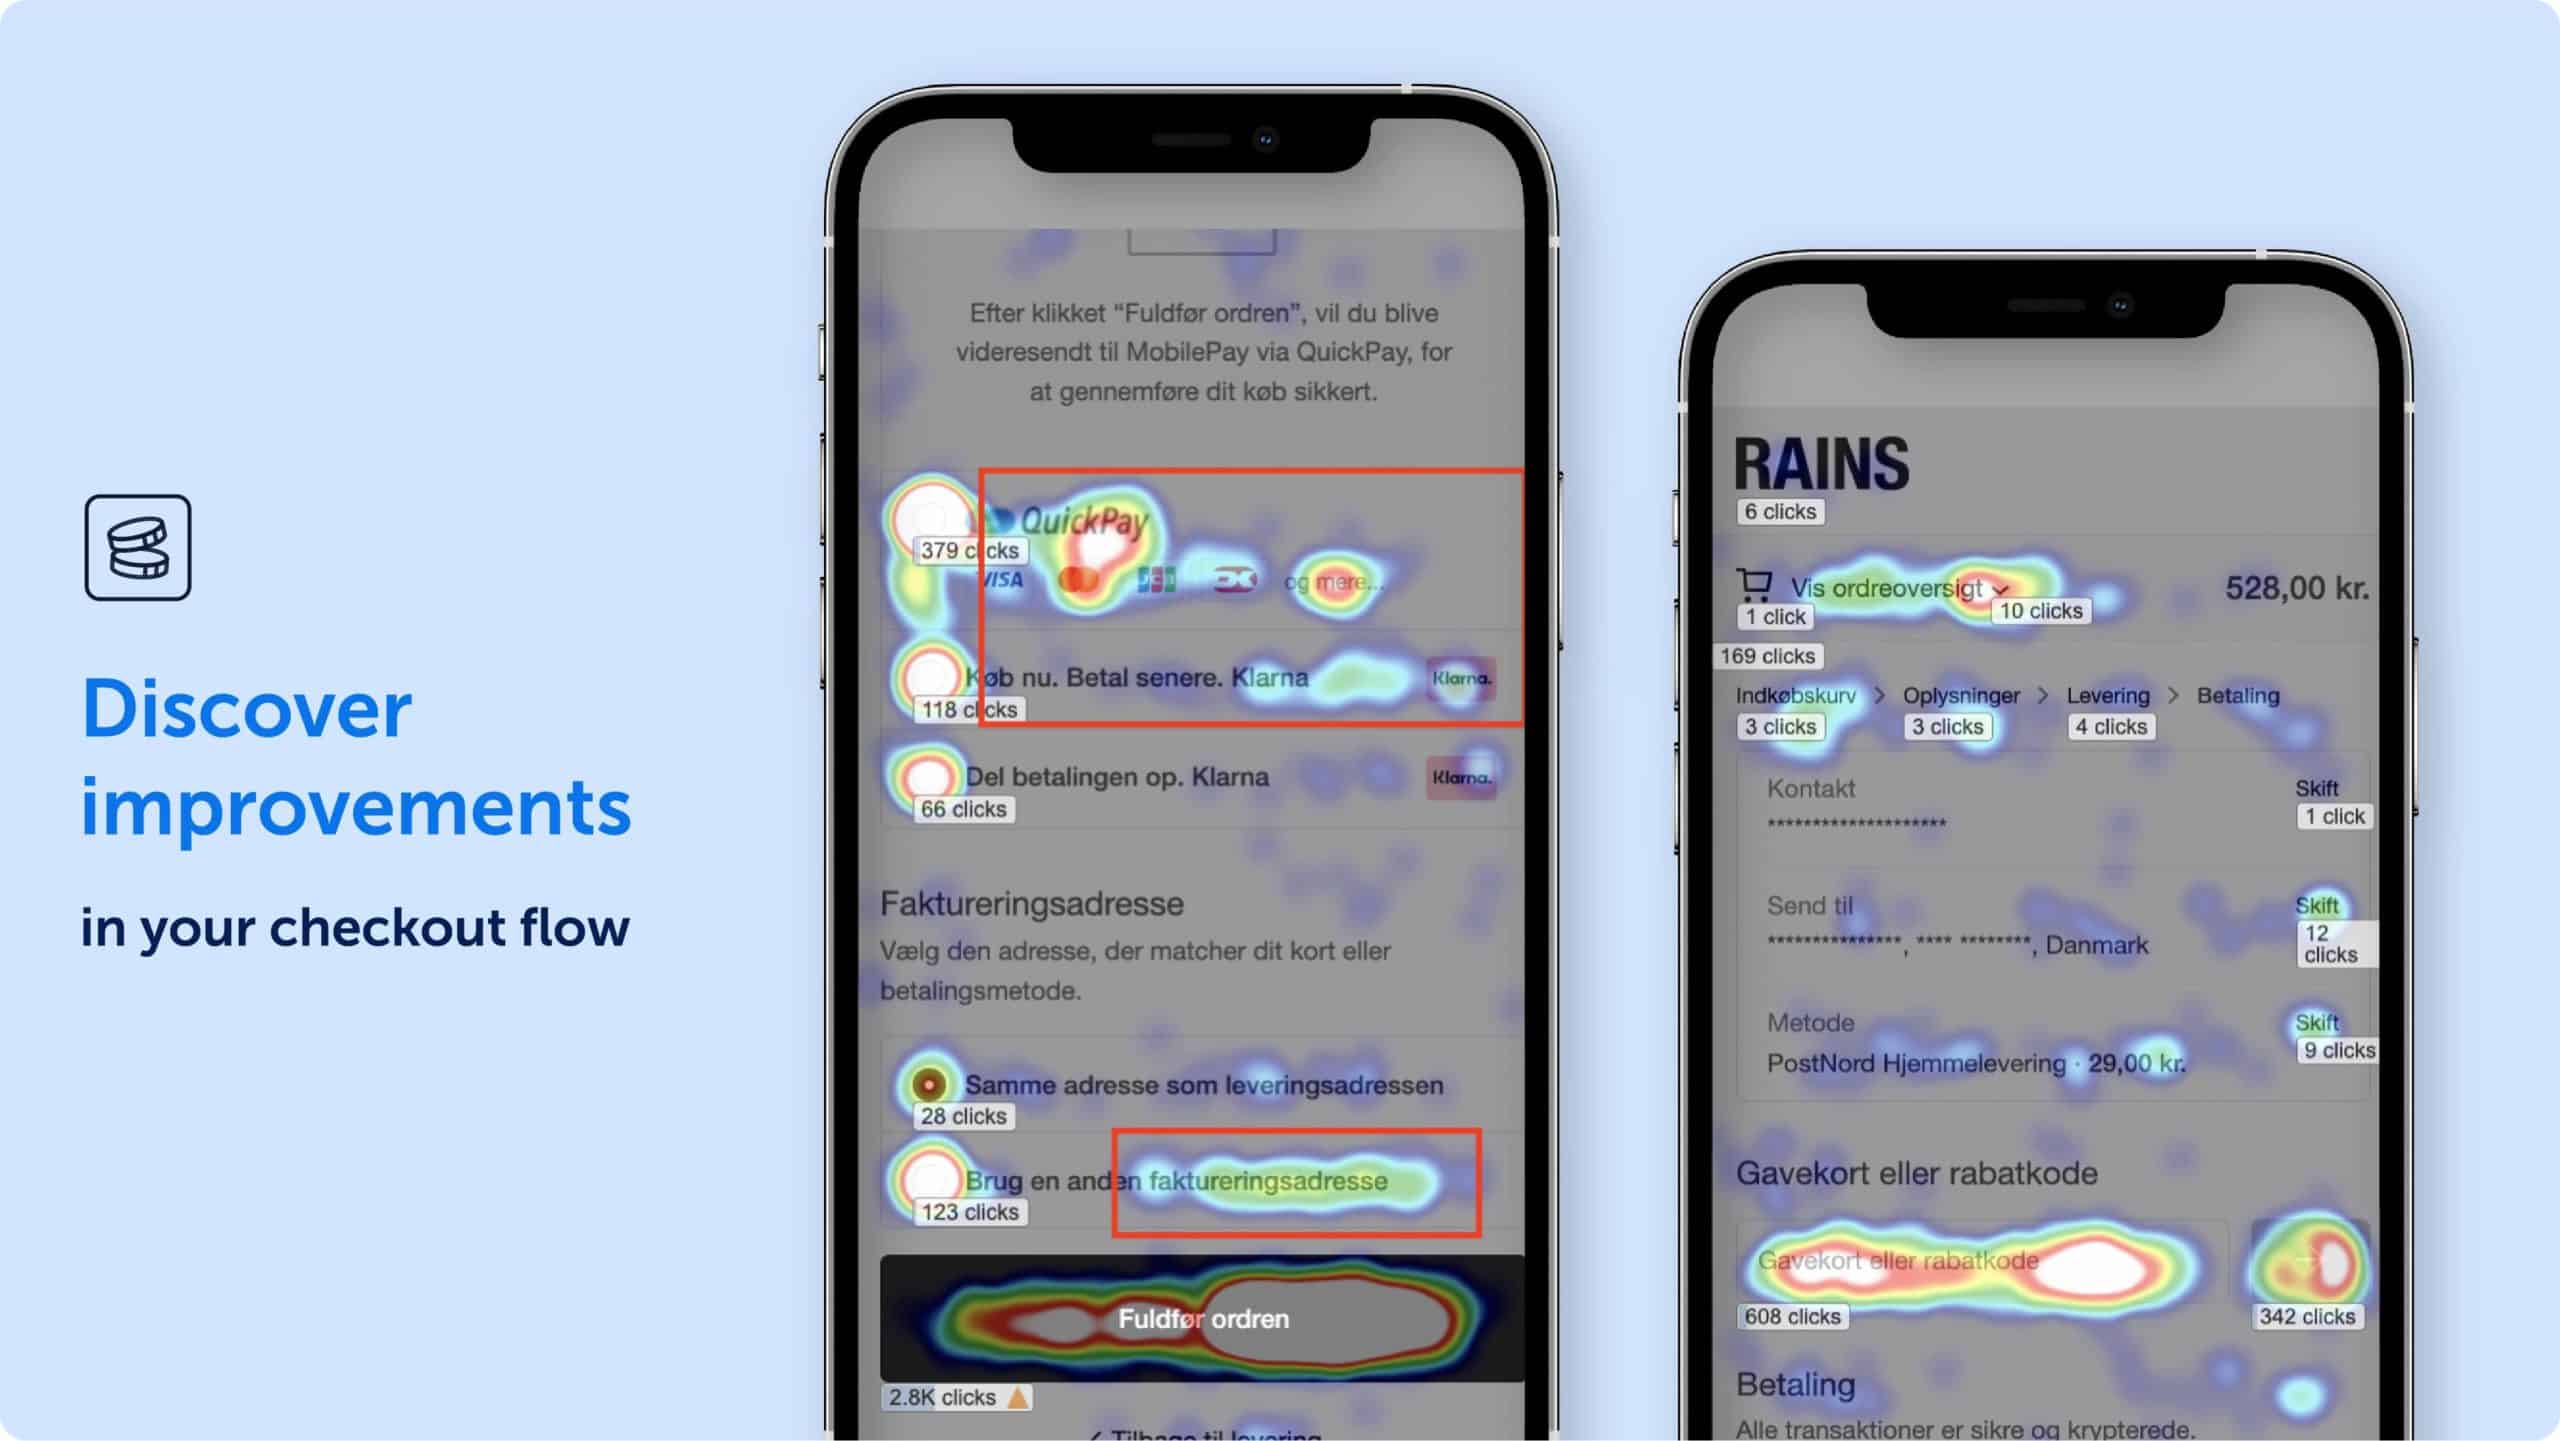
RAINS relied on heatmaps to find friction in their checkout flow
How Derek Rose Got 37% More Conversions Out of Their Site
A luxury nightwear brand Derek Rose improved their conversion rate by focusing on user experience adjustments.
They relied on session replay and auxiliary data that Mouseflow offered to look for user friction such as page reloads and click rage. That allowed them to discover issues with popup design and navigation.
They proceeded to redesign the popup, optimize the mobile navigation menu, and fix a few more UI elements here and there. Combined, these UX enhancements led to a 37% increase in conversion rate.

Derek Rose’s analysis of user behavior led to changing how the location pop-up worked
How Ecooking Optimized Their Mobile Website and Got 10% More Conversions
A global skincare and cosmetics brand Ecooking approached optimizing conversions the classical way.
They recorded more than 450,000 sessions with Mouseflow, and used that data to identify high-friction pages and user errors. Then, they ran A/B tests to validate improvements.
Notable changes that proved to have a positive impact included making unclickable elements interactive and improving product description pages (PDPs) by highlighting the key selling points.
The result of one not very extensive optimization sprint was a 10% conversion uplift.
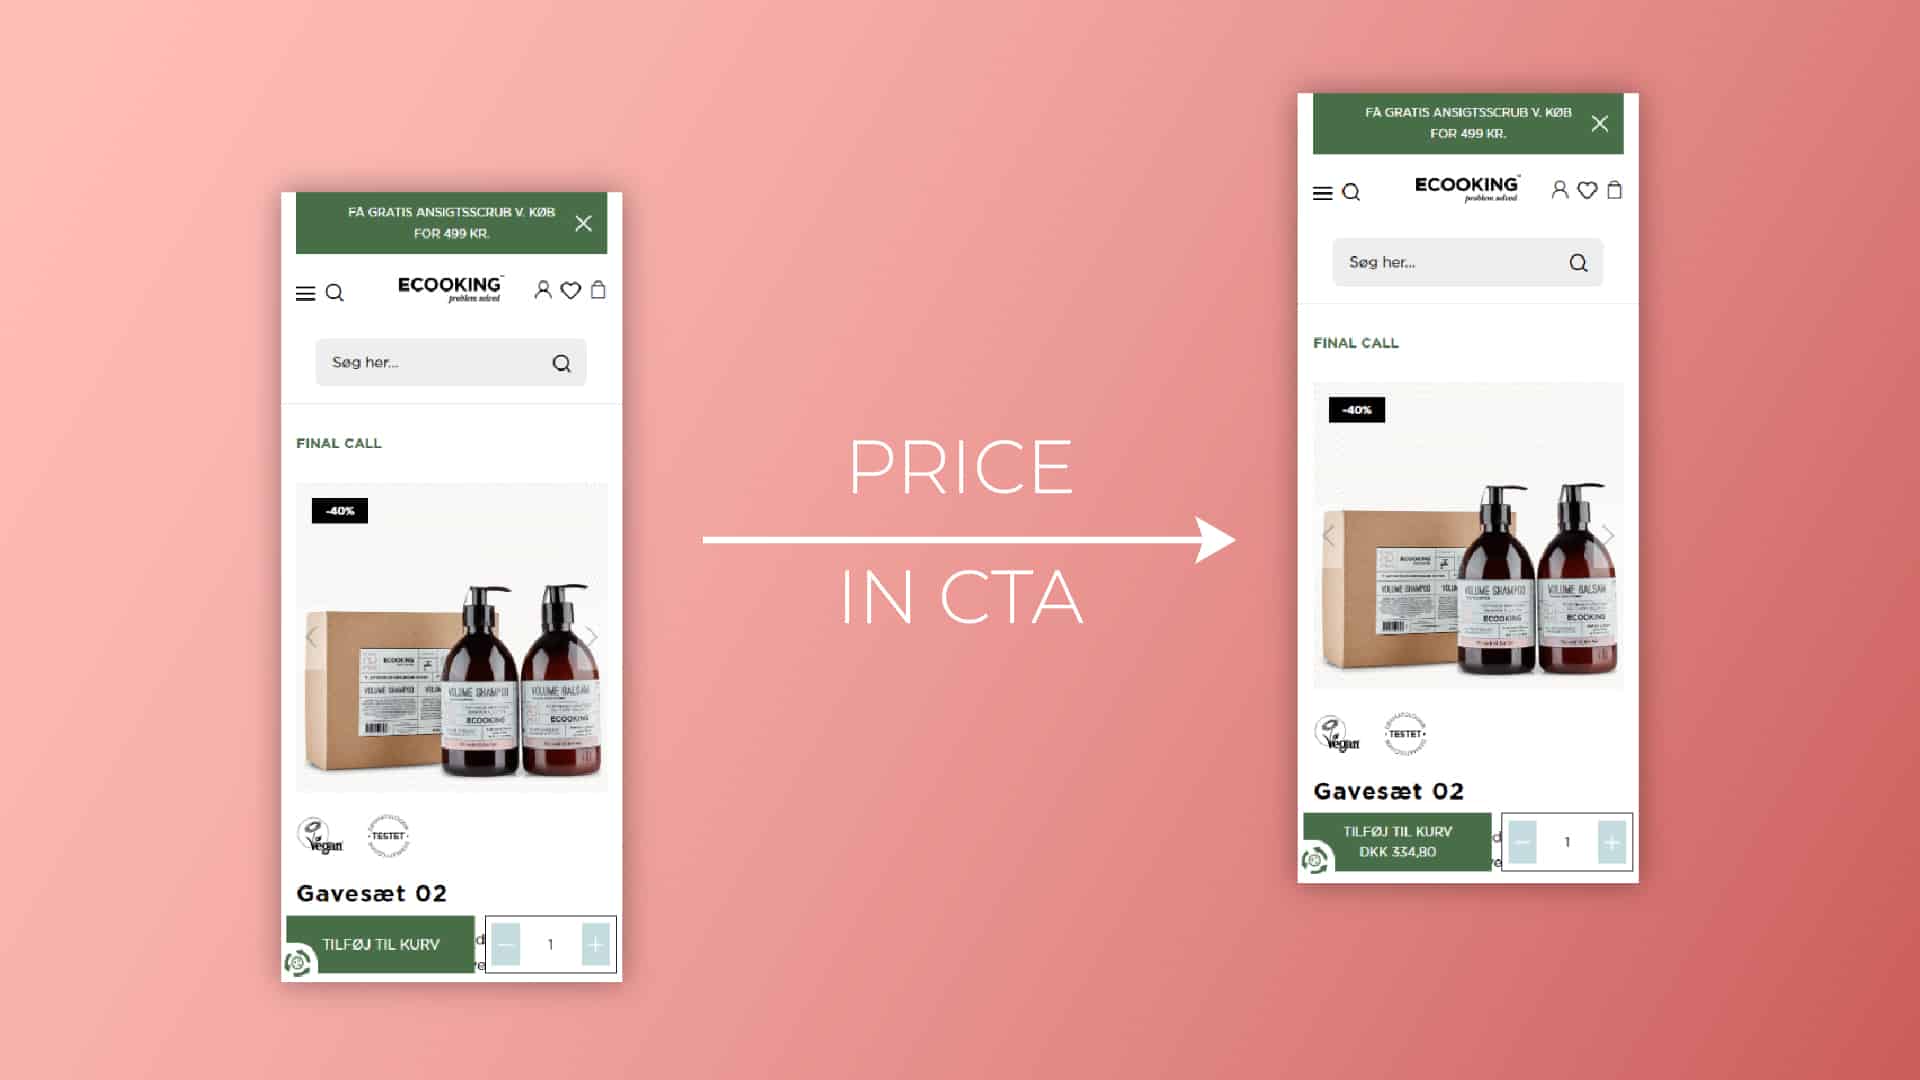
Among other things, Ecooking tested changing CTA copy
Check out other CRO case studies.
Conclusion
Literally every website can benefit from conversion rate optimization.
At the same time, CRO isn’t just about increasing sales by making small tweaks to your website. It’s about adopting a culture of experimentation and understanding your customers. The main value of each test is not in the conversions increase that it contributed, but in the learning the team can gain from it.
Focusing on learning, rather than just the immediate outcomes, can transform the whole organization in a very positive way, including, of course, an increase in conversions.