
To sample or not to sample, that is the question. Data sampling has always been a hot topic in data analytics. Is it good or bad? Does it help or does it cause problems? Or maybe both?
In this article, let’s try to figure out the pros and cons of data sampling, and whether you should use it for your website analytics.
Data Sampling In Layman's Terms
In data science, data sampling is a practice of selecting a subset (or sample) of data from a larger dataset to represent the entire population. Instead of analyzing every single piece of data in the whole set, you review just a fraction, with the expectation that this sample will reflect the characteristics of the entire dataset. This is usually done for the sake of saving time and effort. When working with big data with millions or even billions of data points, sampling can save a tremendous amount of time and computation.
Let’s assume you have a crate of apples. Instead of inspecting each and every apple and concluding whether some of them are wormy, you can randomly pick, say, 10 apples. If none have suspicious holes in them, you can – with a certain probability – conclude that you have a crate of good apples without worms. It was easier than going through the whole crate, wasn’t it?
That probability would depend on various factors, with two main ones being:
- Sample size. How big is the sample in comparison to the whole population? If a crate contains 100 apples, inspecting 20 would give you a more detailed picture than inspecting 5. The bigger the sample size, the lower the error, but the higher the effort to process it. Picking 90 apples out of 100 for inspection doesn’t seem all too different then going with all 100.
- Sampling method. How do you choose the data points for the sample? If you pick only apples from the top, there’s quite a chance that you don’t know anything about what’s going on at the bottom (and if there even are apples there). You can pick randomly, or based on some parameters (for example, make sure to include both green and red, and both small and big apples into the sample).
Sometimes, conclusions drawn from inspecting a sample are different from what they would’ve been, if you’ve inspected the entire population. That’s called a sampling error – and that’s something you should be very aware of when using data sampling.
Since data sampling methods can have a huge impact on the results you can get, let’s quickly go through some of the methods.
A Quick Classification of Data Sampling Methods
There are various ways one can categorize data sampling techniqes. If we choose the simplest way, it would divide them into two primary groups: probability sampling and non-probability sampling.
Probability vs. Non-Probability Sampling
- Probability sampling, aka random sampling: These methods rely on some sort of randomization to select items that will participate in the sample. The primary advantage of probability sampling methods is that they tend to be more accurate.
- Non-Probability sampling: In non-probability sampling methods, the researchers deliberately pick items from the group based on their goals, knowledge, or – quite often – convenience. Non-probability sampling is easier, but has a much higher chance of introducing biases.
Sometimes, researchers combine these methods and use them together. In each group, there are several methods. Let’s go through the most common of them:
Probability Sampling Methods
- Simple random sampling: As the name suggests, this method involves selecting members of the population purely by chance. Think of it like drawing names out of a hat. Each member has an equal probability of being chosen. While straightforward, this method can sometimes miss out on representing subgroups within the population.
- Stratified sampling (aka stratified random sampling): Here, the population is divided into smaller groups based on shared characteristics (such as age, gender, or geolocation). A random sample is then drawn from each group. It ensures that specific groups are adequately represented in the sample, leading to more accurate insights about the entire population.
- Cluster sampling: The population is divided into clusters, often based on geographic locations or other natural groupings. A random sample of these clusters is then chosen, and all members within selected clusters are studied. The difference between stratified and cluster sampling is that in the latter not all groups are represented in the sample.
- Systematic sampling: Here, you divide the population by your desired sample size to find your interval at witch you pick data points (e.g., to get a sample 20 participants out of 100, you pick every 5th person, which means you have a sampling rate of 1:5). If you start at a random point and the population is in a random order, the results can be similar to what you get with simple random sampling.
Non-Probability Sampling Methods
- Convenience sampling: As the name suggests, this data sampling method involves sampling members that are easiest to reach. For example, surveying users currently online on a website. While convenient, it may not be representative of the entire population.
- Geo sampling: This is a form of convenience sampling where individuals are chosen based on their geographic location. For web analytics, geo sampling might involve studying user behaviors from a particular country or region of interest. While it provides location-specific insights, it, of course, doesn’t give you any data on other locations.
- Quota sampling: In this probability sampling method, the researcher ensures that specific subgroups are represented proportionally to their size in the population. It’s similar to stratified sampling, but in quota sampling, nobody did randomization when choosing individuals within the subgroup.
What is Data Sampling in Website Analytics?
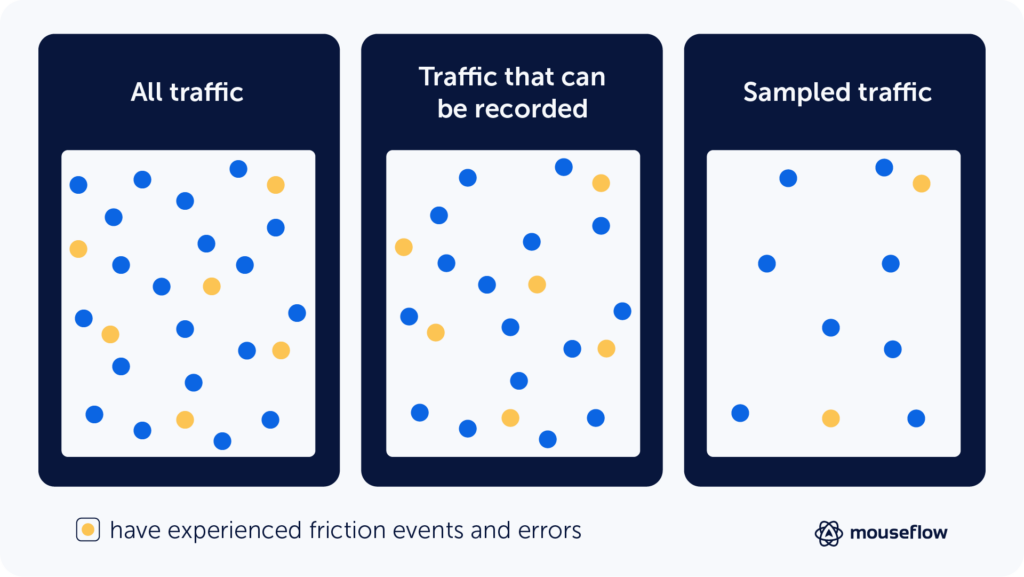
In website analytics, data sampling is a practice of selecting a subset of sessions for analysis instead of analyzing the whole population of sessions that the analytics tool tracked.
For example, if you were to observe sessions of 30% of your website visitors and find that 70% of them clicked on a specific button, you might infer that a similar percentage applies to all visitors, rather than analyzing each one.
However, just like with apples, using just a sample means that you’re never totally sure. There’s that probability – and it depends on the sample size and sampling method that the analytics provider uses.
Sampling vs Segmenting
Web-analytics solutions that use sampling mostly rely on one of the probability sampling methods. However, you can always segment out a group of website sessions by, for example, looking at only those that came from organic search. This way, you sort of introduce non-probability sampling to the data yourself.
However, the difference between sampling and segmenting is in data integrity. With sampling, you don’t capture some of the data, and you cannot analyze it if you want. However, segmenting is something that you usually do at the analysis stage, not at capturing stage. You intentionally decide to focus on a certain segment to get insights about it, but if you need to, you can always return to the unsegmented population. Segmenting is crucial in website analytics, and it’s important to distinguish it from sampling.
How Different Website Analytics Providers Approach Data Sampling
Website analytics providers have different approaches to sampling. For example, Universal Google Analytics (may it rest in peace) relied on sampling upon reaching a certain number of website sessions – the sampling threshold is 500k for free users and 100M for users of Analytics 360.
Google Analytics 4 starts sampling upon reaching a certain number of events (10 million for users of free Google Analytics and 1 billion for those using paid Google Analytics 360). So, if you have a lot of events on your website (10 million sounds like a lot, but it’s not – a website with about 1,000 visitors per day easily gets 10 million events in about 90 days), your Google Analytics reports may not be 100% reliable. When compared to Universal Analytics, GA4 relies on sampling more often.
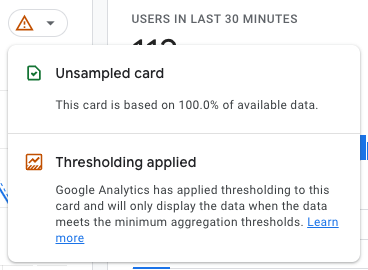
This is how you know whether you’re looking at a sampled or unsampled report in GA4. The red exclamation mark tells you that there’s some thresholding applied and you’re looking at sampled data.
Another analytics tool, Plausible Analytics, does not sample your data. However, since it’s a paid tool, they just ask for more money once your website reaches a certain threshold of sessions per month. Same applies to Adobe Analytics – they don’t sample and they charge more from bigger websites, even though their pricing is obscure.
Hotjar, a behavior analytics tool, samples the data, allowing you to see the percentage of website traffic that is recorded. In their pricing, they offer different plans with different amounts of sessions you can record per day, and if your daily traffic is higher than the amount in your pricing plan, they’ll sample the population, recording only a fraction of it.
In Mouseflow, daily sampling is disabled by default. Or rather, you can say, we rely on monthly sampling instead of daily sampling, trying to record all website sessions on your website, until you run out of the monthly recording limit introduced by your plan. We offer different plans with different amounts of recorded sessions per month, but we don’t throttle your data or daily capture like Hotjar does (by the way, we have an in-depth Mouseflow vs Hojar comparison, if you’re interested).
However, we have some features such as Bot Prevention that recognizes bot visits and excludes them from being recorded. This feature is enabled by default and is available on all plans free of charge. So, by default, Mouseflow tries to focus on recording only human sessions, but making sure to record all of them (as long as users choose to accept the analytical cookies).
Pros and Cons of Data Sampling in Website Analytics
From what we wrote so far, it sounds like sampling is always bad – it introduces all these probabilities.
Track and analyze 100% of sessions = Make educated and data driven decisions.
Track and analyze <100% = Gamble with making accurate decisions.
However, there’re not only negative aspects to sampling. In some cases, it can actually help. So, let’s take a look at the list of pros and cons of data sampling in website analytics.
Pros:
- Money saving.
Many behavior analytics systems employ credit-based payment models, where you pay for the number of sessions you plan on recording per month. Recording sessions for only a sample of your website visitor population allows you to save money, paying for less sessions. - Even distribution.
If you’re trying to save money, you likely will end up in a situation where the number of recordings that you get per month is lower than the number of website sessions in the same period of time. Sampling allows you to – more or less – evenly distribute recordings across the time period, while without sampling your credits can abruptly run out before some important event happens. - Efficiency.
Sampling can significantly speed up data analysis, especially when dealing with vast amounts of data, by reducing the load on processing and storage. However, that’s a win for the analytics service provider, not for the end user. But that’s certainly why some providers stick to sampling in the first place.
Cons:
- Accuracy concerns.
Even with a representative sample, there’s a risk of missing out on specific details or nuances present in the full dataset. Like, if you have the full list of lottery tickets, you won’t miss the jackpot. But if you only look at 80% of the tickets, there’s a 20% chance that the winning tickets are not in the sample. Accuracy concerns are especially relevant when running A/B tests, as with lower traffic per version the chance of getting biased results gets higher. - Dependency on sampling technique (and reliance on the provider for doing the sampling correctly).
The quality of insights largely depends on the sampling method. A poor choice can lead to misleading results. And since it’s not you who chooses the sampling method, you have to trust the provider. - Potential for bias.
If not done correctly, sampling can introduce biases that skew results. And since you don’t know how the sampling was done, you don’t know if you get data with a bias. - Limited granularity.
Even if you manage to achieve statistical significance for the whole website with sampled data, there’s a chance that if you try to go more granular and focus on specific funnels or pages, there would not be enough sampled data to give you statistically significant results. Sampling can prevent you from getting enough data for more granular analysis. - Missed opportunities.
A holistic view might uncover cross-segment patterns or correlations that sampled data could miss. - May not represent rare events.
Unusual but significant events, like rare user interactions, might not be present in the sample, leading to an incomplete understanding.
It’s worth noting that this applies to sampling, but not to segmenting.
How Sampling Can Affect Behavior Analytics Tools
If you think about traditional website analytics, analyzing every click, scroll, or interaction for every user could be overwhelming and may in some cases be considered unnecessary for getting the overall picture. But when when it comes to behavior analytics, the situation becomes a tad more complex.
Here’s how sampling affects behavior analytics tools:
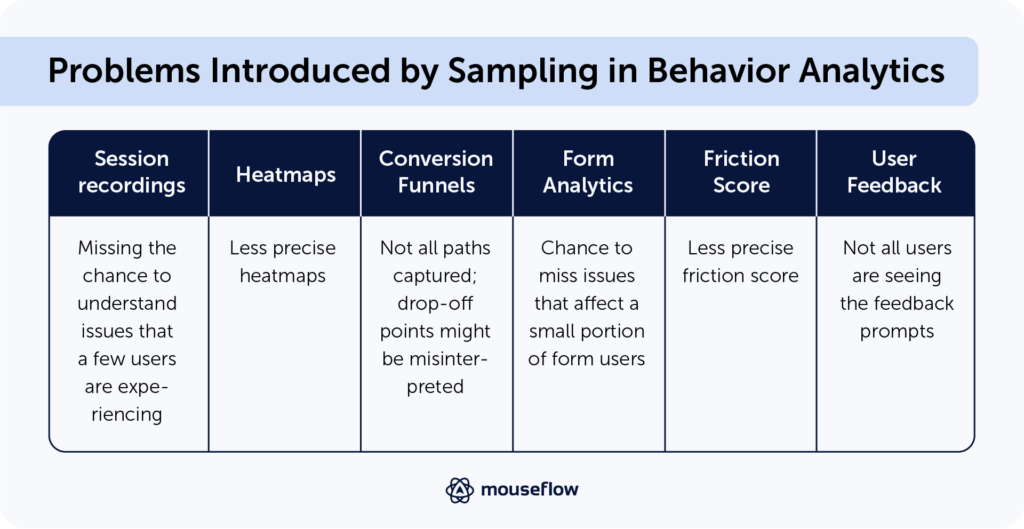
- Session recording tool.
Session recordings are replays of user sessions, showing you exactly how visitors interact with your site. Sampling here means you’re only seeing a fraction of the interactions. This can be problematic if trying to understand issues that only a few users might experience. With unsampled data, you can replay every session that was possible to record (including that one session where the user failed to checkout a $4,000 cart for some reason – for example). - Heatmap tool.
Heatmaps provide a visual representation of where users click, move, or scroll on a page, as well as where they pay attention. By only sampling a subset of users, you might miss out on some nuanced behaviors of a particular segment, leading to a less detailed heatmap. Basically, the insights that you get from a heatmap can be less clear, as the heatmaps become less accurate. - Conversion funnels.
These show the user’s journey through a set of pages, helping to identify where they drop off. If based on sampled data, these funnels may not capture all possible paths users take, potentially misrepresenting the most common drop-off points. - Form analytics.
This involves analyzing how users interact with forms on your site – from sign-ups to checkouts. If you’re only observing a sample, you might miss issues that affect a small but significant portion of users. Things like which fields take longest to complete, where users most frequently drop off, or fields that tend to be skipped can get overlooked. - Friction score.
This score indicates where users experience friction or hurdles on your site, often leading to drop-offs or site abandonment. As each recording is automatically analyzed for potential friction events, with sampling there’s a chance to miss sessions with friction events when not tracking 100% of the traffic. - User feedback tool.
Collection prompts (like surveys or feedback widgets) provide direct input from users about their experience. When you sample, not all users see the feedback collection prompts. This means you could miss out on diverse viewpoints, especially if certain demographics or user types aren’t represented in the sample. For instance, if only frequent users are sampled, you might overlook the feedback of first-time visitors which can be crucial for understanding initial user experience.
Conclusion
With behavior analytics sampling poses a fundamental challenge: while you get a general idea, you’re possibly missing out on the richness of data that could provide deeper insights, especially when it comes to outlier behaviors or understanding specific user segments.
This is why, unlike some other behavior analytics providers, Mouseflow does not sample your traffic by default, and records all sessions that are possible to record.
We believe that, while sampling can save you some money, the amount of potential problems, missed opportunities, and inconsistencies that it introduces are not worth it.
For eCommerce, for example, sampling can introduce additional problems with personalization, detecting fraud and anomalies, inventory and demand forecasting, and more. We’ve discussed the challenges of sampling for eCommerce in a separate article.
