





Our website heatmap software captures behavior across every visit, giving you a complete view of how users engage with your pages.

The built-in filters in our heatmapping tools give you the full user behavior picture. Not just what happened, but why.

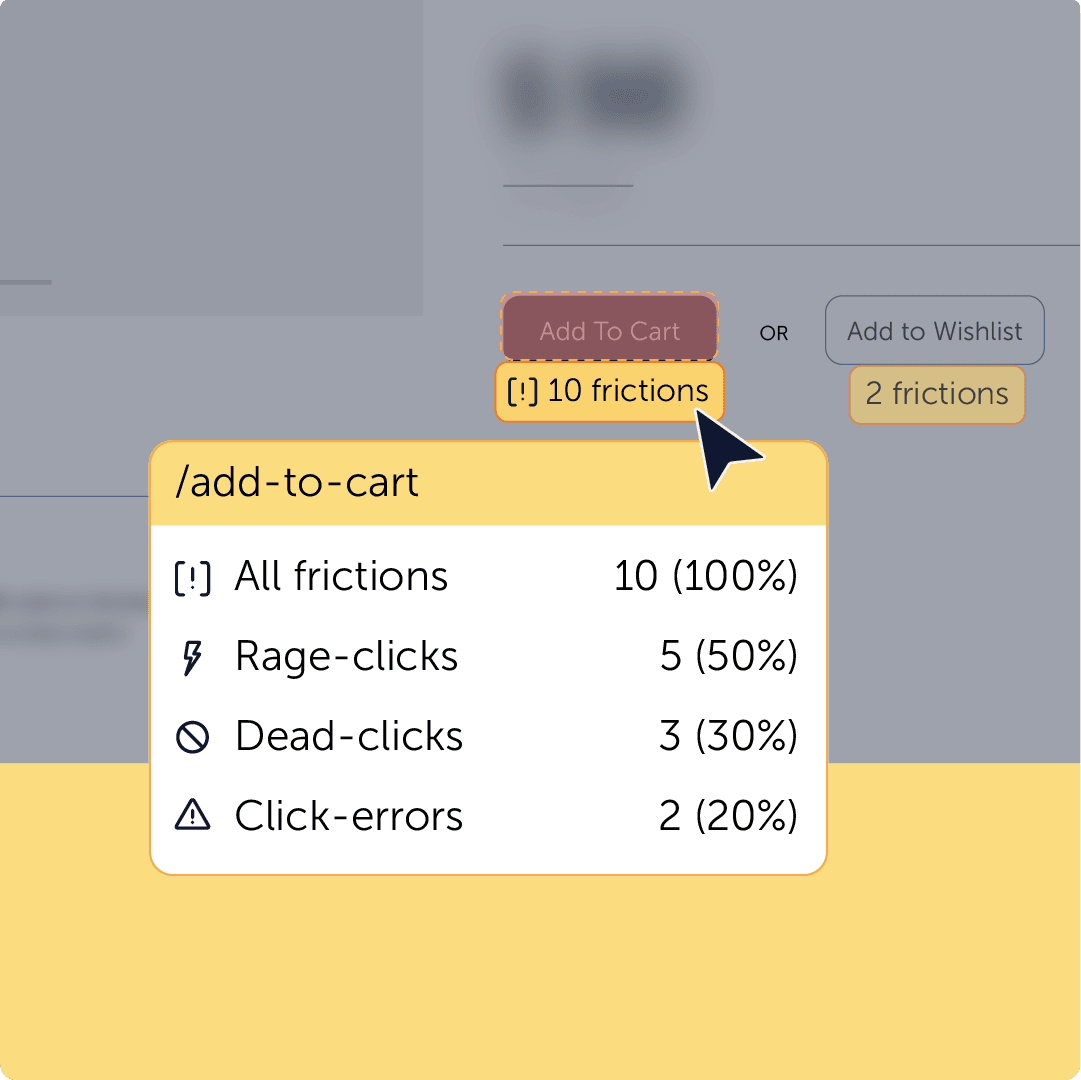
Detect rage clicks, errors, and bounce behavior with smart heatmap analytics – and fix issues as they happen.
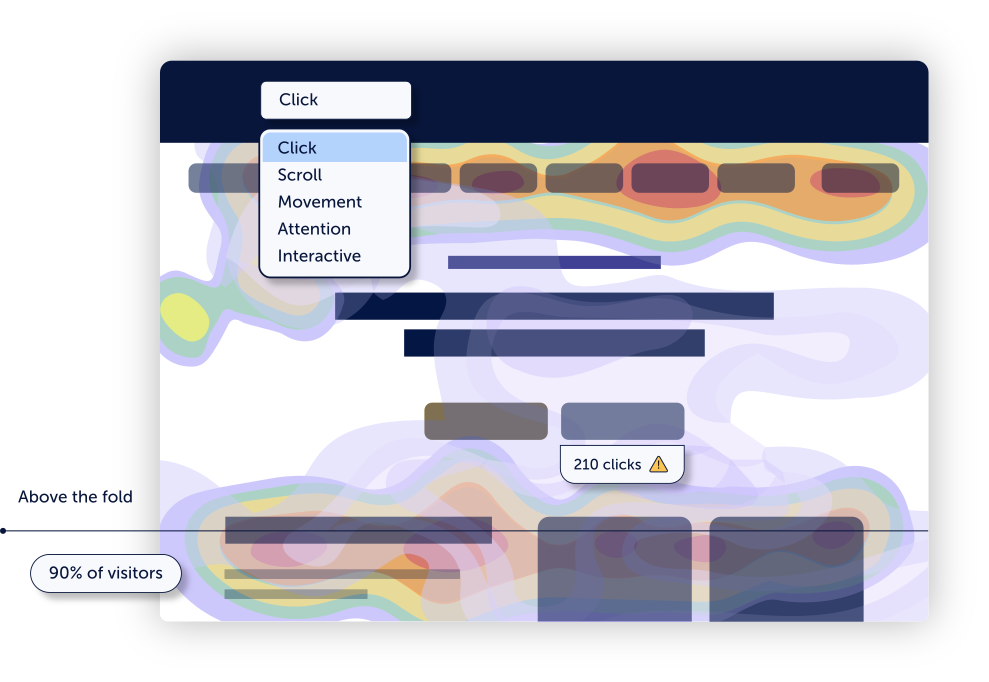
Click heatmaps show where people actually click (or try to). Use them to see if your CTAs are working or if users are getting sidetracked.
See how far users scroll down your pages. Find out if visitors are seeing key content or if it’s getting lost below the fold.
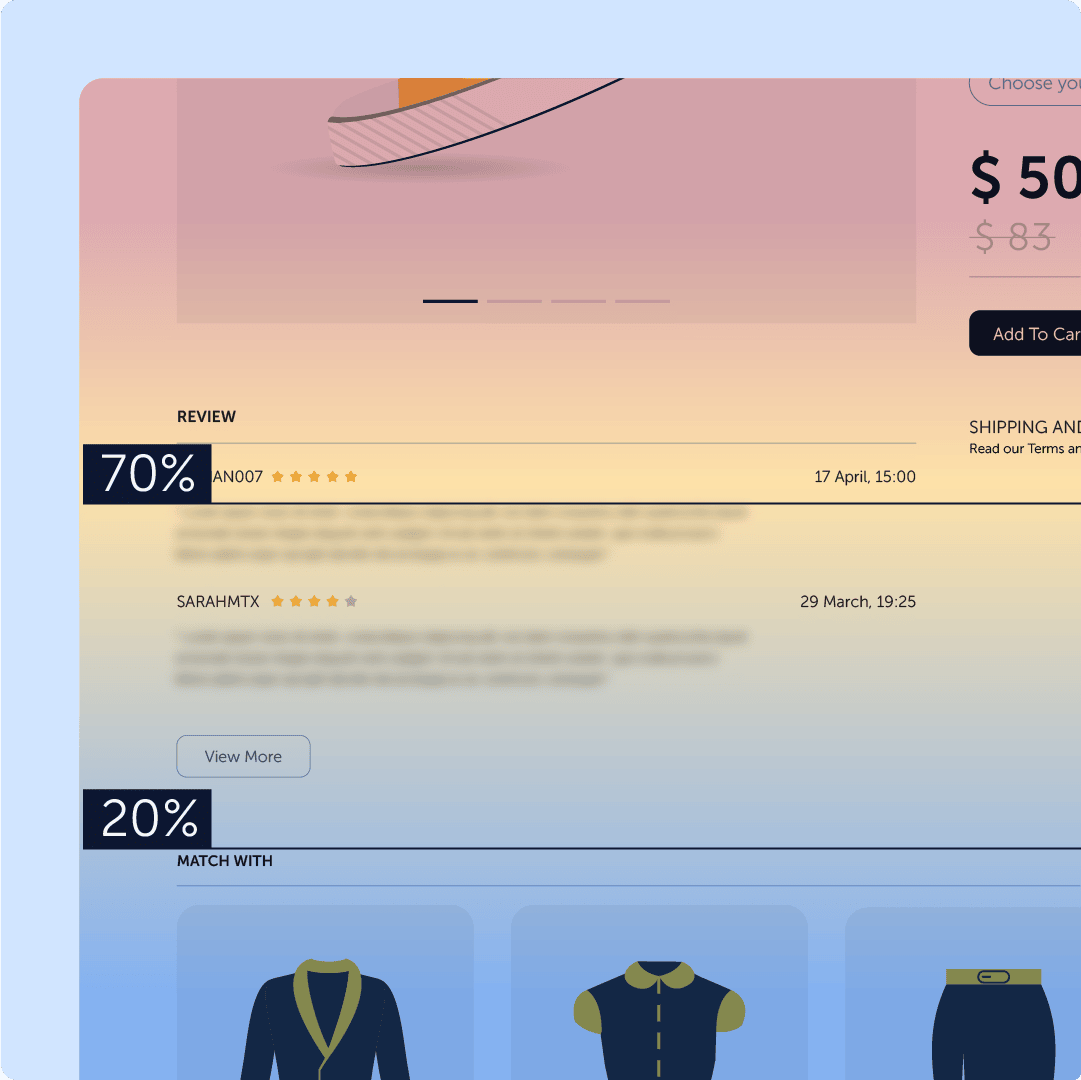
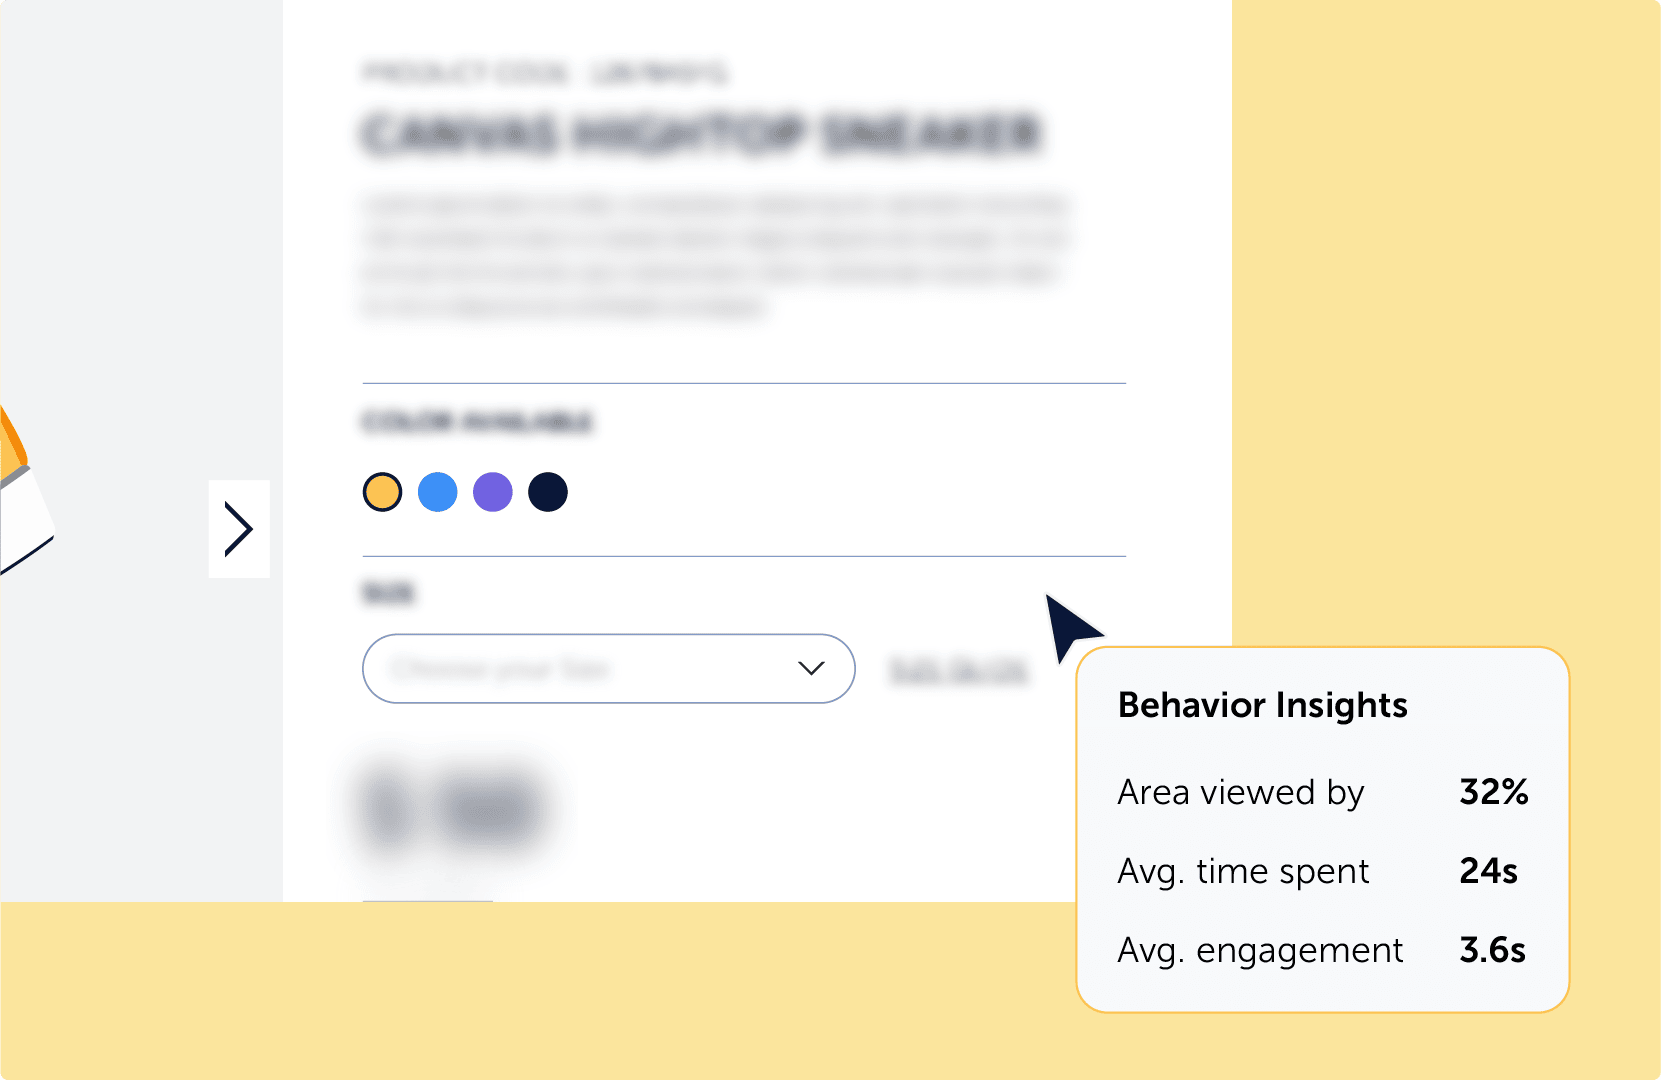
Track where users linger and hover, even if they don’t click – a clearer way to understand what grabs their attention.
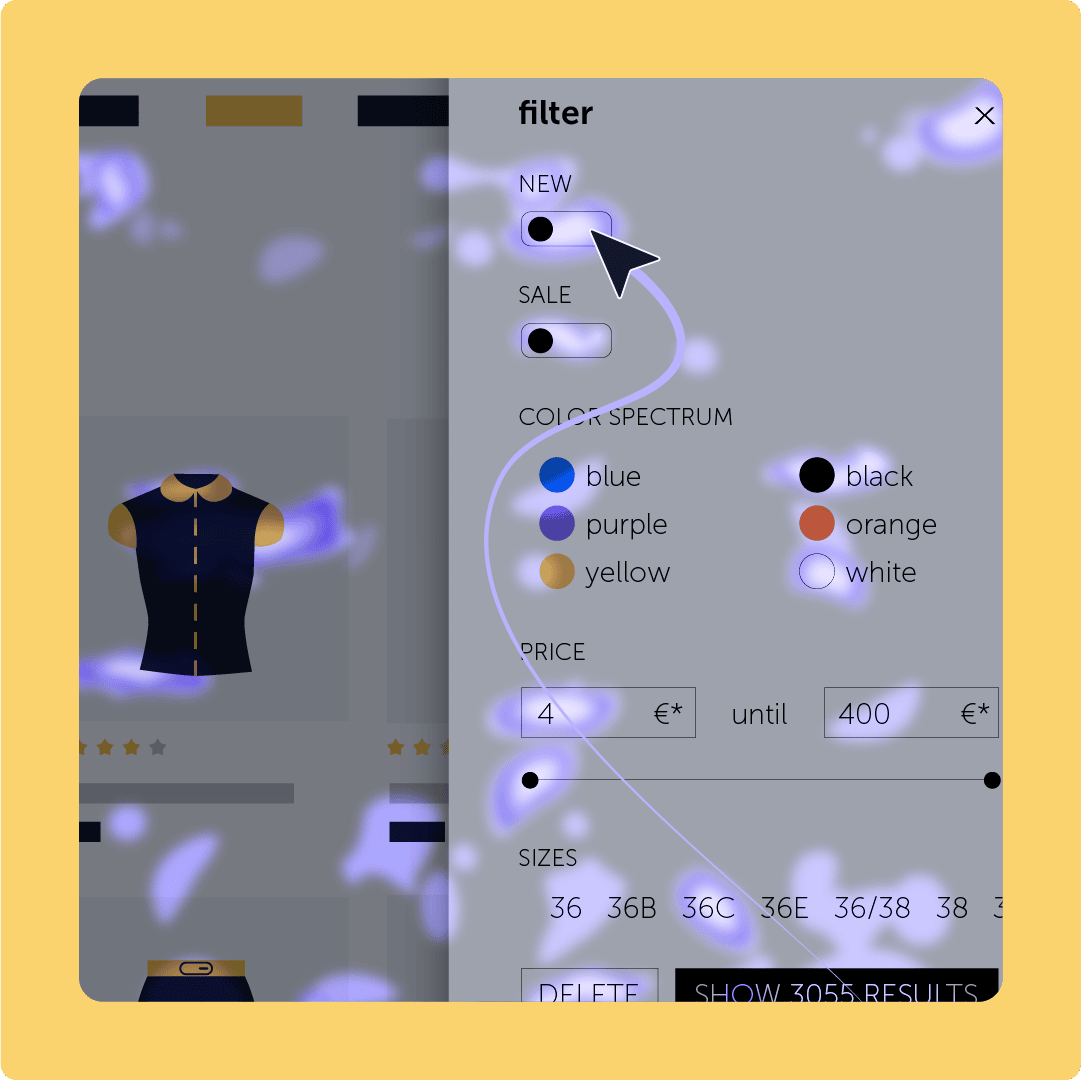
Blend clicks and scrolls to show where users are most engaged. Great for testing CTA spots or layout changes.
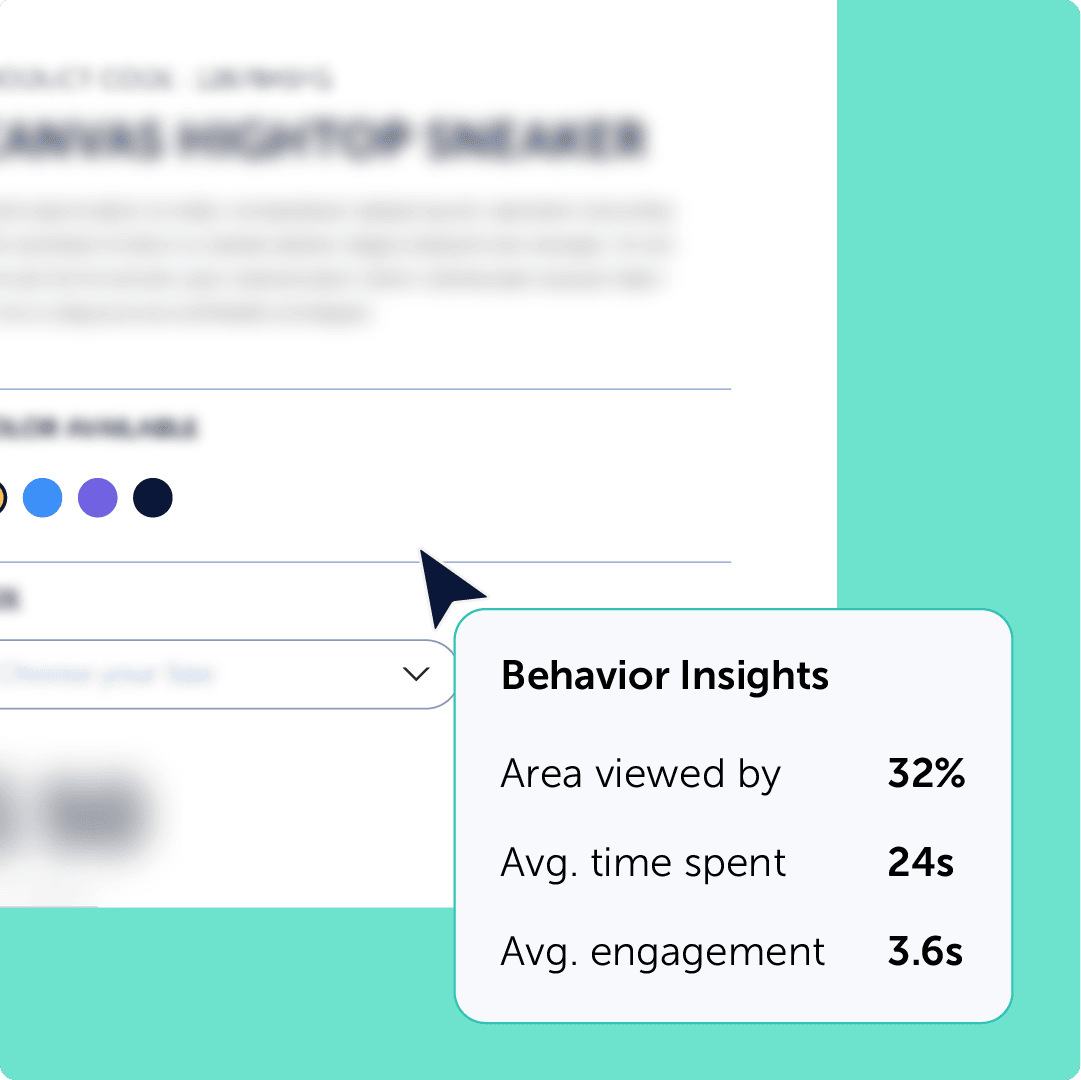
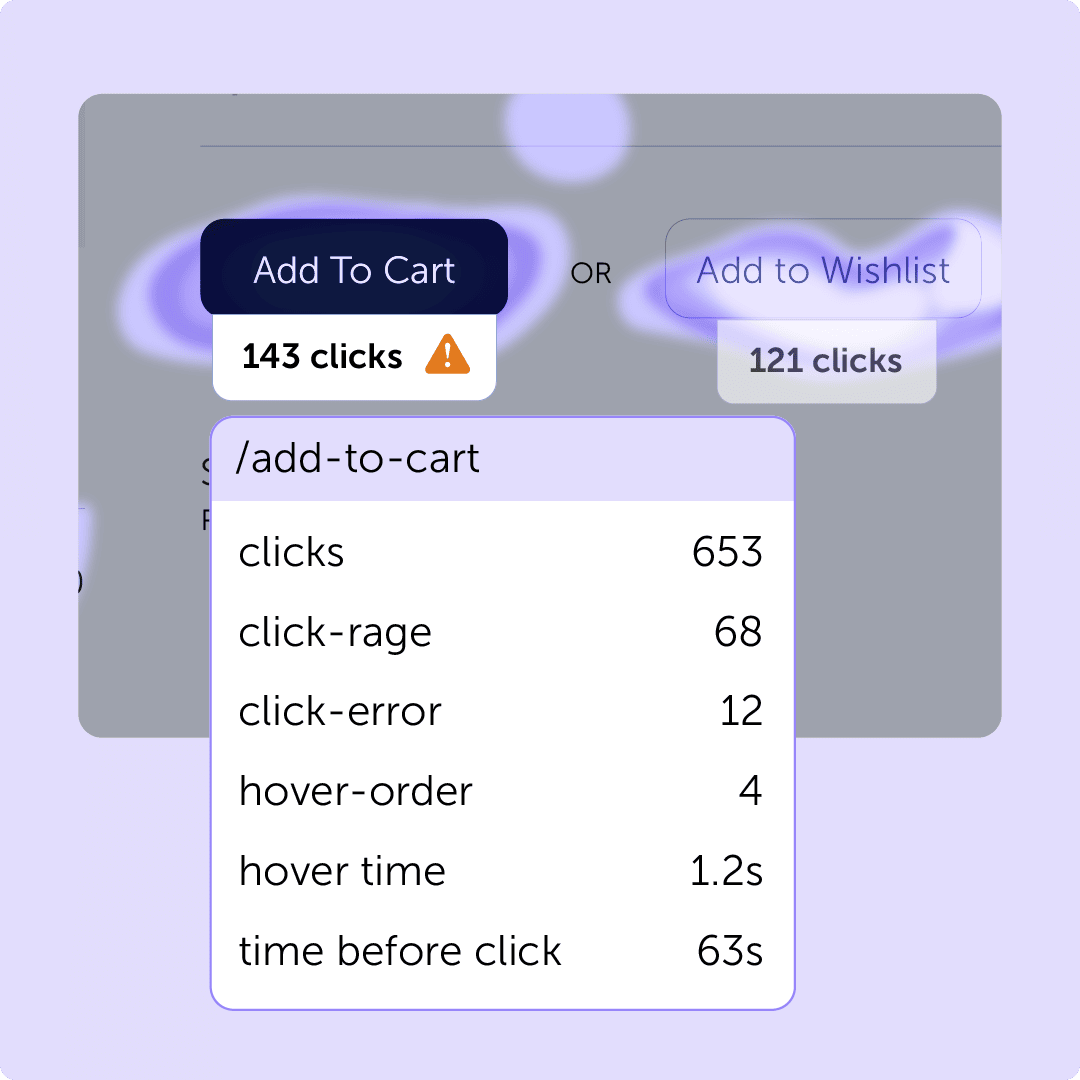
Catch where users rage-click, experience errors, or get stuck. Perfect for squashing bugs and smoothing journeys.
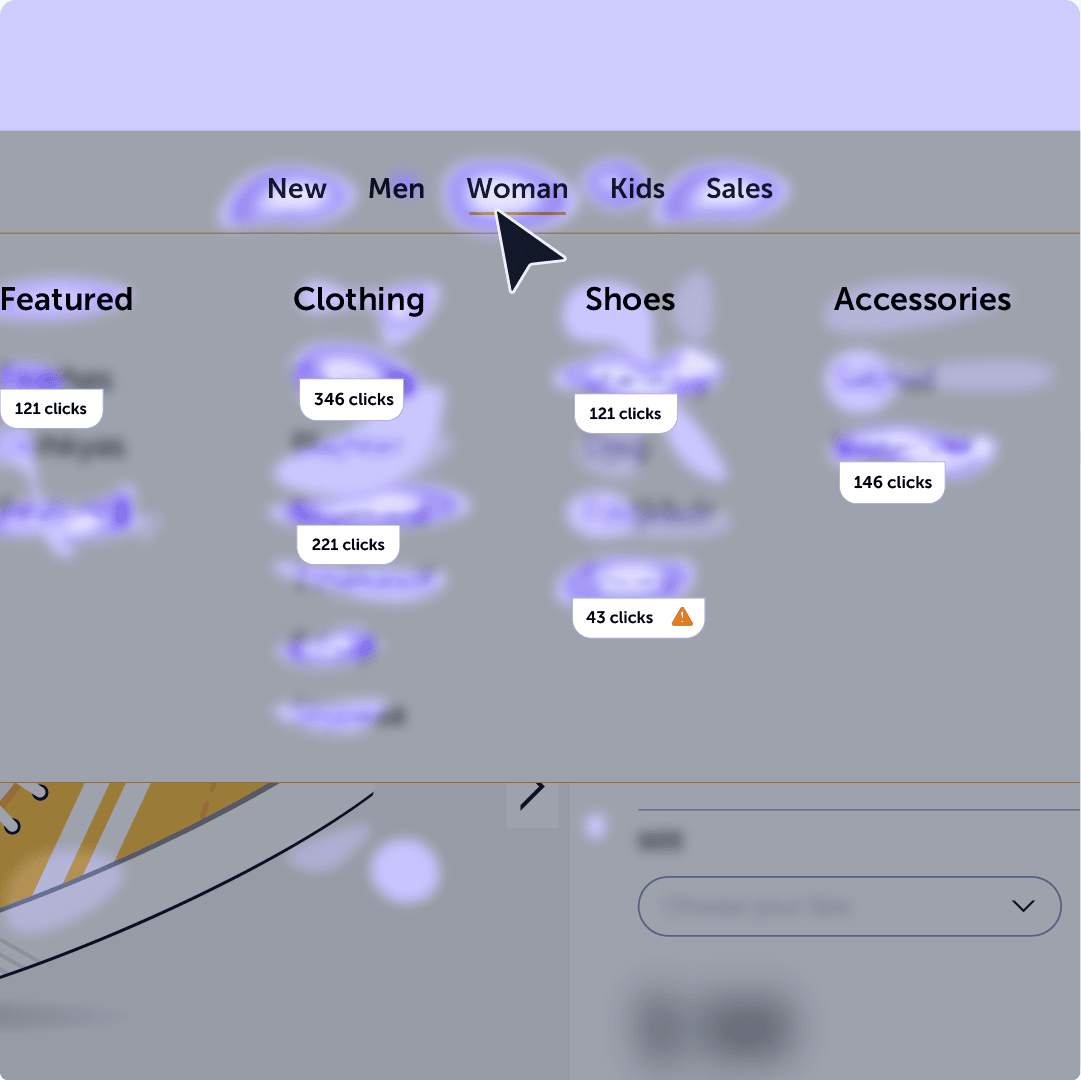
See how users engage with menus, sliders, tabs – anything that’s clickable. With heatmaps layered directly onto your live site.
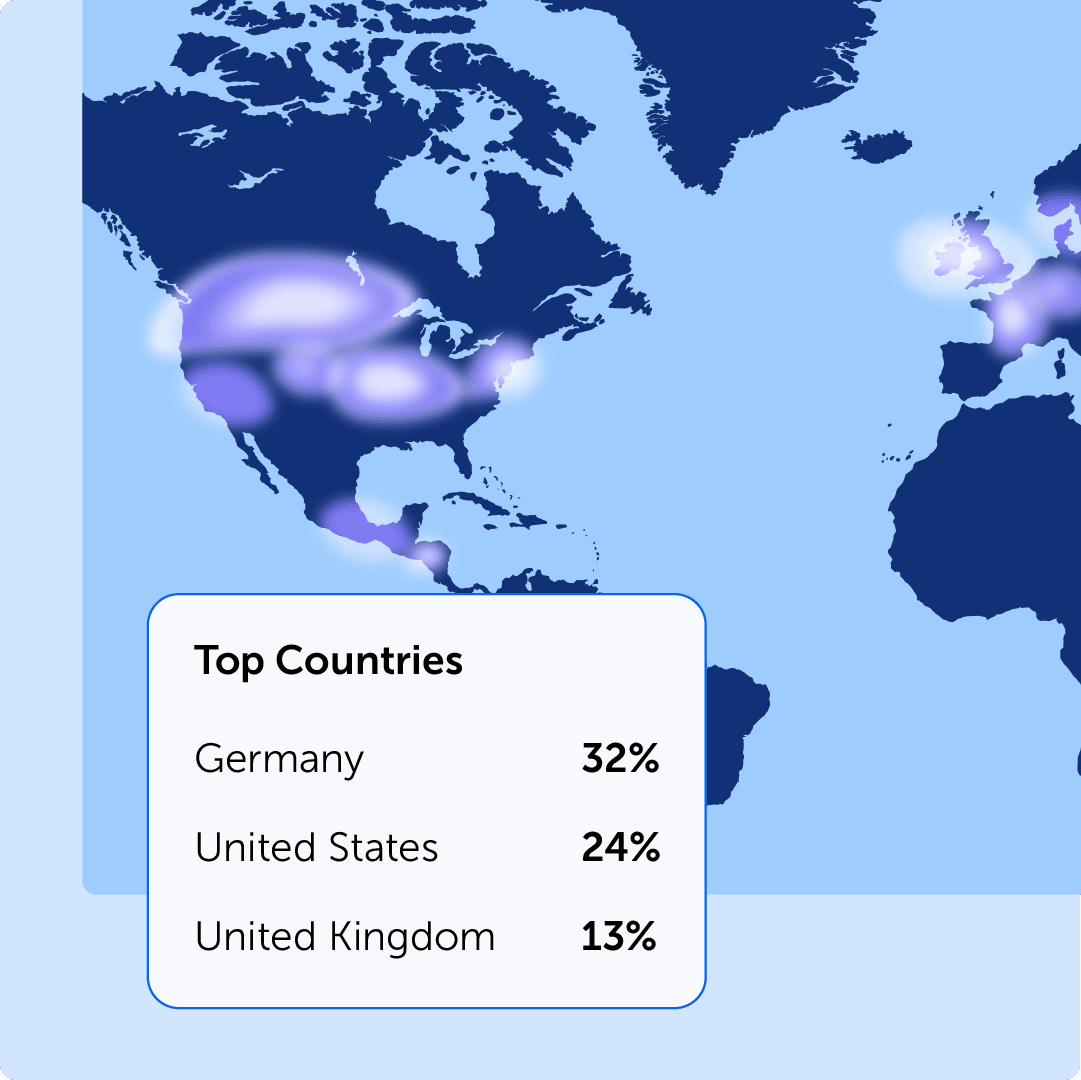
See where your users are in the world. Use it to localize content or sharpen ad targeting.

Compare different pages simultaneously in a single tab. Whether you want to see how behavior changed between two time periods, compare two audience segments, or put a click heatmap next to a scroll heatmap – the comparison mode makes it instant.
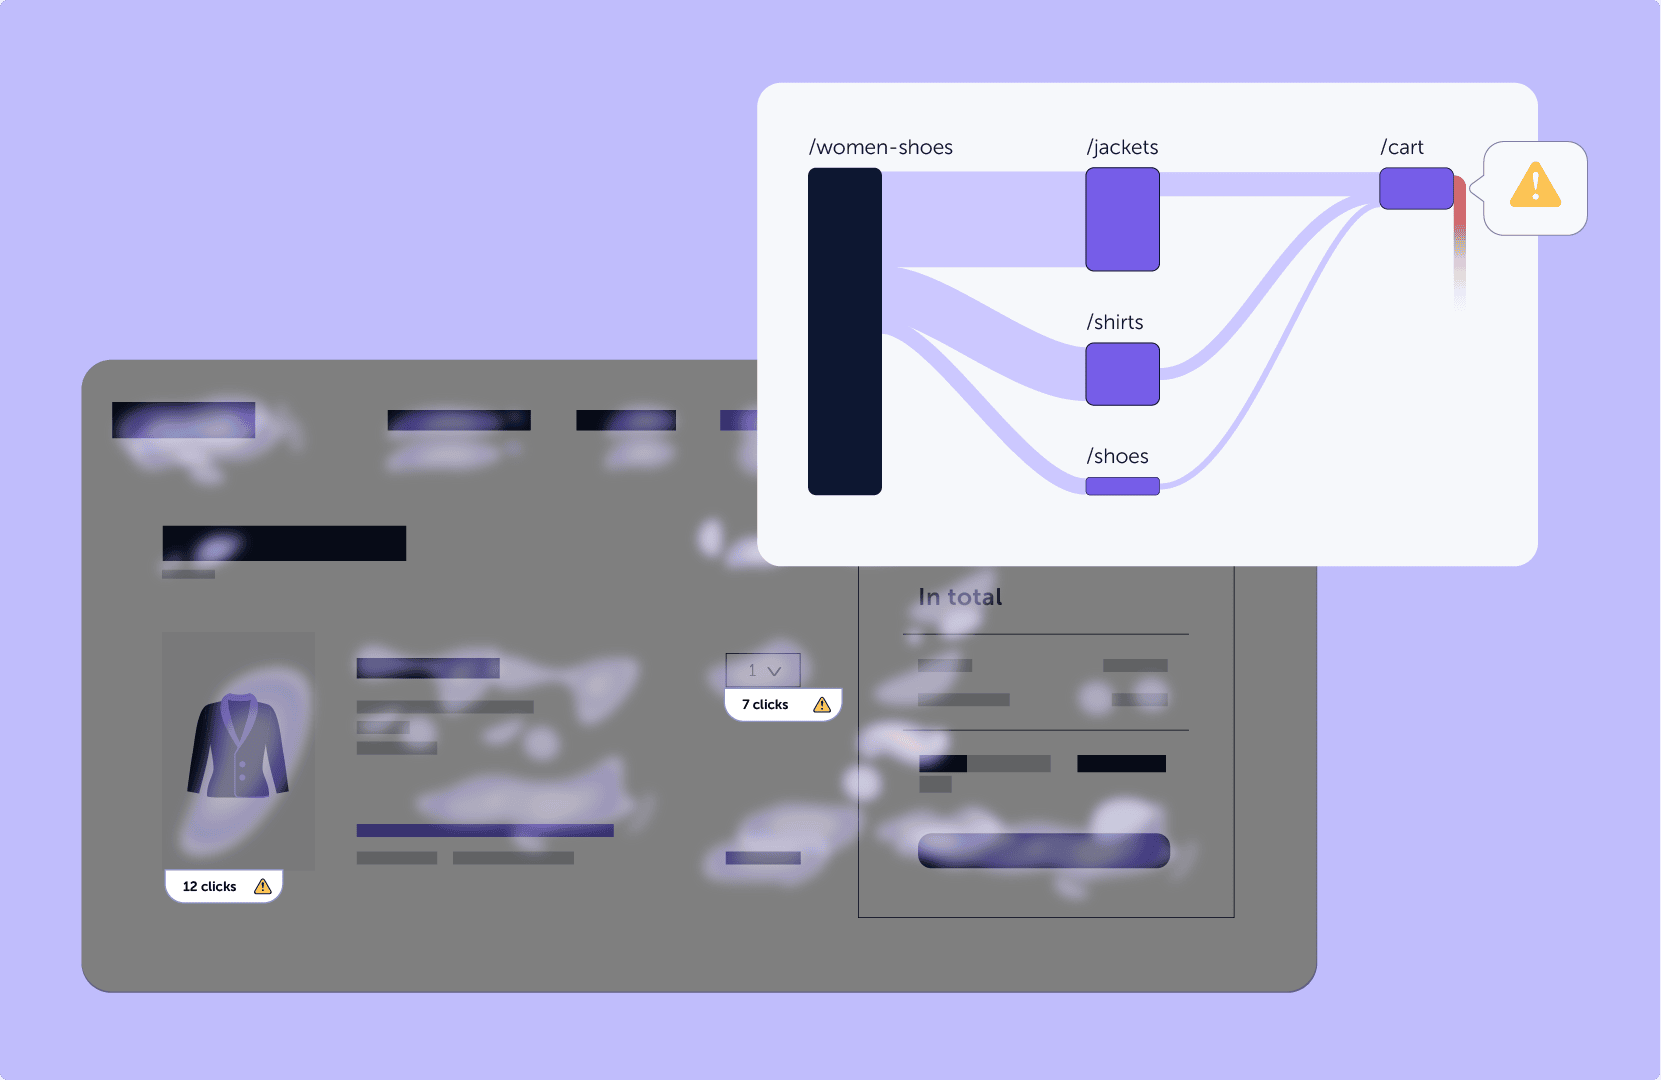
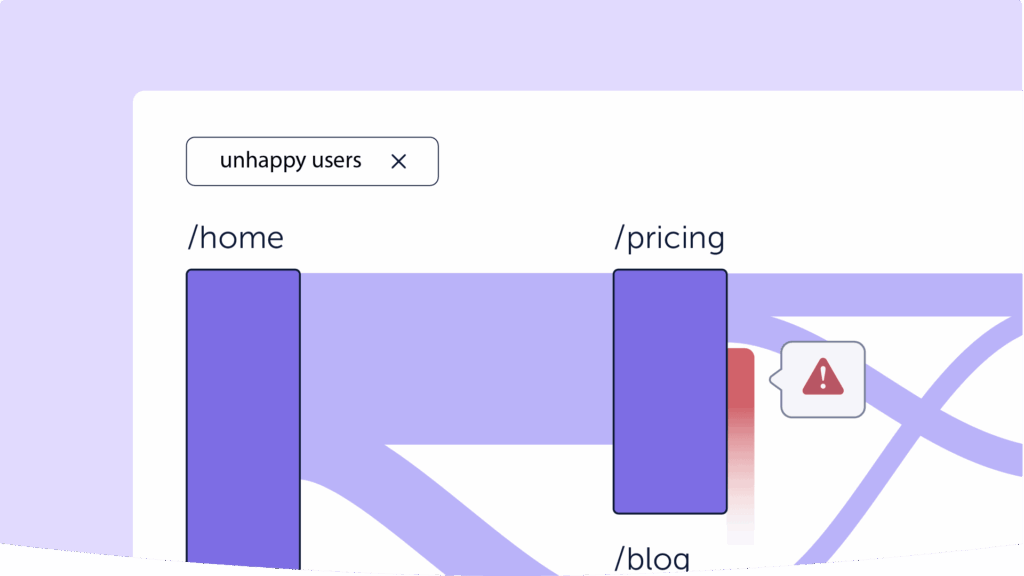
Combine our heatmap tools with intuitive user journey analytics to see how users actually move through your website. Track every scroll, rage click, and drop-off across the full experience. Together, heatmapping software and Journey Analytics help you pinpoint where users struggle and what happens next.
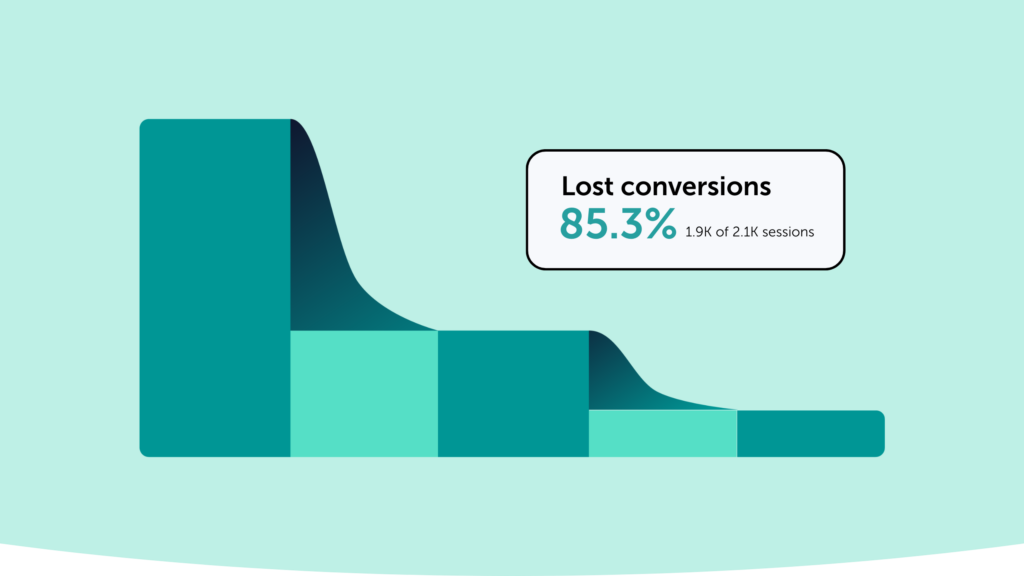
Website heatmaps and funnels answer different parts of the same question.
Funnels show where users drop off, while heatmap software reveals how they interact with the page, what they see, where they stop, and what gets ignored.
Thousands of sessions. Hundreds of pages. But where do you start?
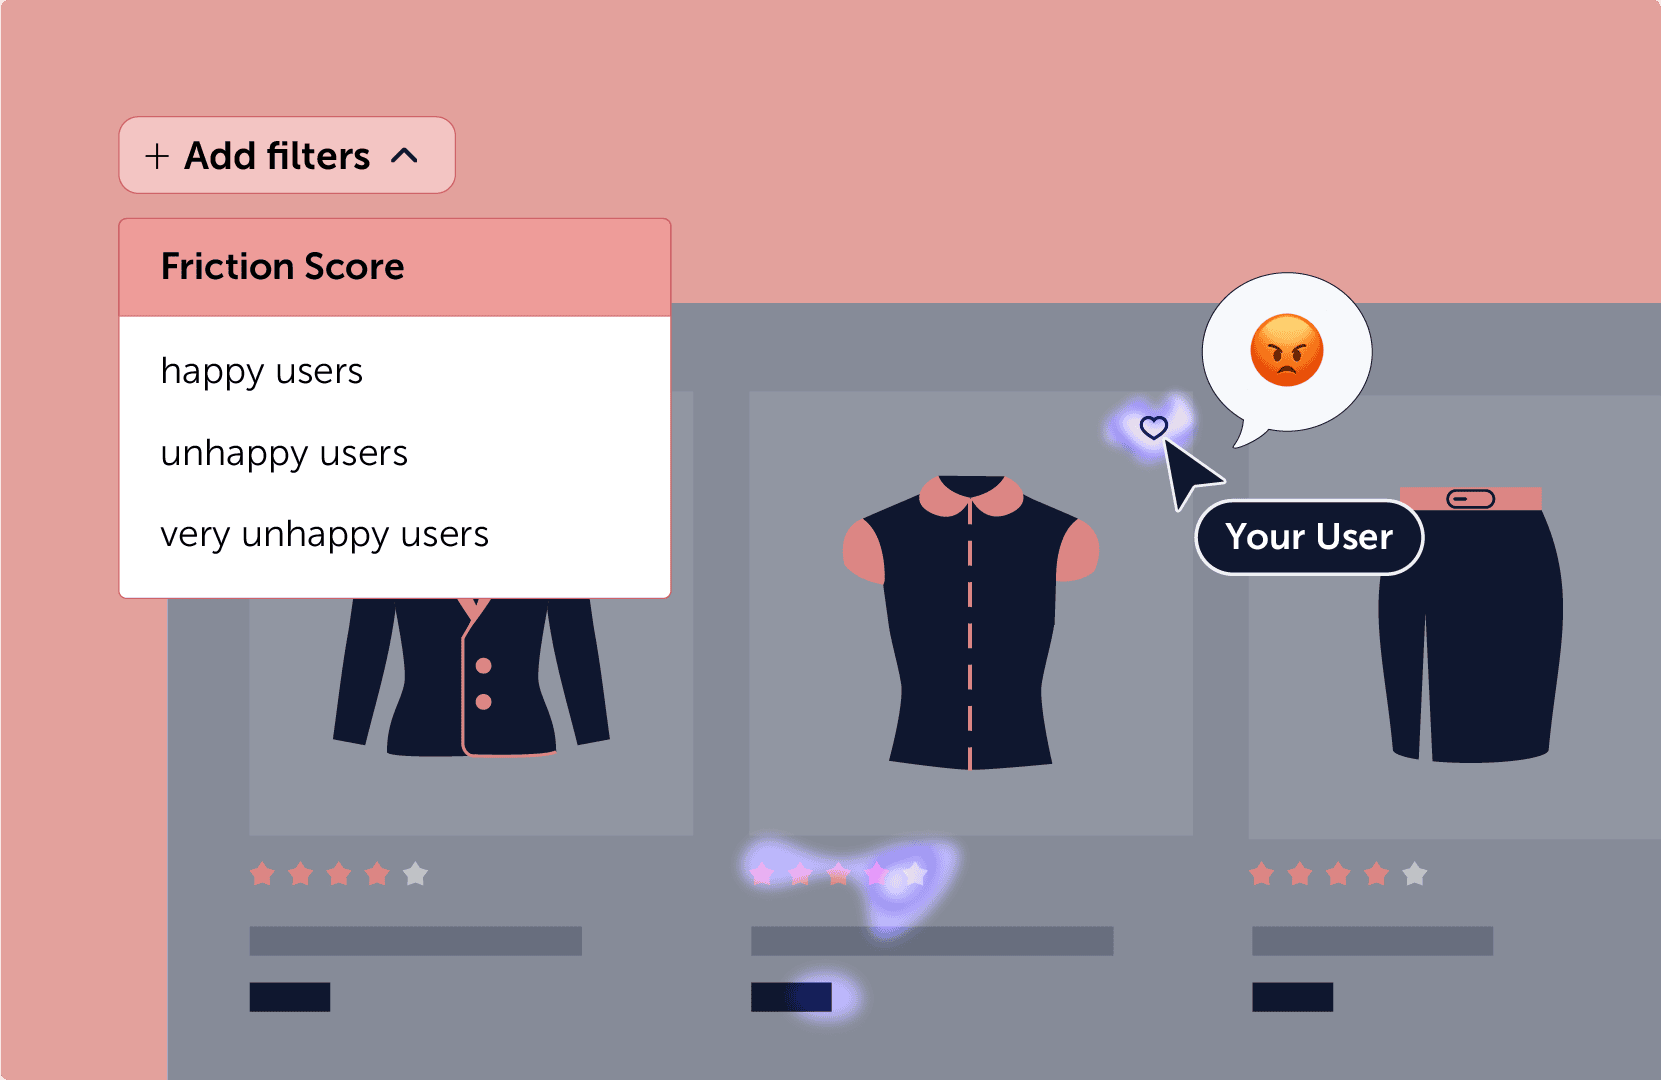
Our heatmapping software automatically highlights where users rage-click, hesitate, or encounter errors. Friction Insights helps you prioritize those signals and find struggling users faster.
Top-rated Behavior Analytics Platform
All-in-one tool for teams who need answers, not just data

Rated higher than Hotjar, FullStory and Microsoft Clarity


Mouseflow includes seven types of heatmaps: Click, Scroll, Movement, Attention, Friction, Interactive, and Geo. Together, they help you analyze where users engage, what they see, how they interact with dynamic elements, and where they experience friction.
For a thorough explanation, check out guide to heatmaps.
Sign up for Mouseflow, add the tracking code to your website, and start recording. Mouseflow automatically collects behavioral data and turns it into heatmaps you can analyze by page, device, traffic source, campaign, and more.
Yes. Mouseflow lets you filter heatmaps by factors such as device, traffic source, campaign, and user behavior. You can also compare heatmaps side by side to analyze different pages, time periods, audience segments, or heatmap types.
Mouseflow heatmaps show how users interact with your pages, helping you identify overlooked CTAs, distracting elements, friction, and content that gets ignored. Use these insights to prioritize UX and CRO improvements based on real user behavior rather than assumptions.
A website heatmap tool complements quantitative analytics by showing how users actually interact with individual pages. Mouseflow combines heatmaps with Session Replay, Funnels, Journey Analytics, Form Analytics, and User Feedback, and can be integrated with platforms such as Google Analytics and Adobe Analytics.
Yes. Interactive Heatmaps let you analyze behavior on dynamic elements such as menus, sliders, dropdowns, and other content that changes as users interact with the page. This helps you understand interactions that traditional static heatmaps can miss.