
🎙 On the go? Listen to the article through our podcast, Cave Bits!
Listen to more episodes of Cave Bits
We all do it: cling to gut feelings and personal theories, even when making choices for our businesses. But when it comes to Conversion Rate Optimization (CRO), relying on hunches can be disastrous. It can lead to poorly designed experiments that miss the mark and fail to deliver real results.
By embracing a data-driven approach to CRO, you can ditch the guesswork and see what a data-driven CRO hypothesis can deliver.
In this article, I’ll guide you through developing data-driven hypotheses that set your CRO tests up for success. You’ll also learn how to use data effectively, identify real conversion problems, and build hypotheses that drive real results.
What is a Data-Driven Hypothesis in CRO?
A hypothesis in CRO (and pretty much everywhere else) is a testable statement that looks as follows:
“We hypothesize that if we introduce a certain condition (something that we want to try changing), then a certain metric (sometimes called a primary or a north star metric for the hypothesis) will change by a certain percentage.”
A data-driven hypothesis adds one very important part to this formula:
“We hypothesize that if we introduce a certain condition, then a certain metric will change by a certain percentage because the data that we have suggests that it will impact user behavior in a certain way.”
It’s based on real data and insights rather than guesswork or somebody else’s gut feeling.
I’m pretty sure you’ve noticed that some people suggest simply increasing the button size or color to solve every funnel leak they see on GA4. But why are they so sure that it’s all about the button size?
Where’s the data that indicates the users don’t notice the button or get distracted by, say, a bigger button? Without such data, that’s just guesswork.
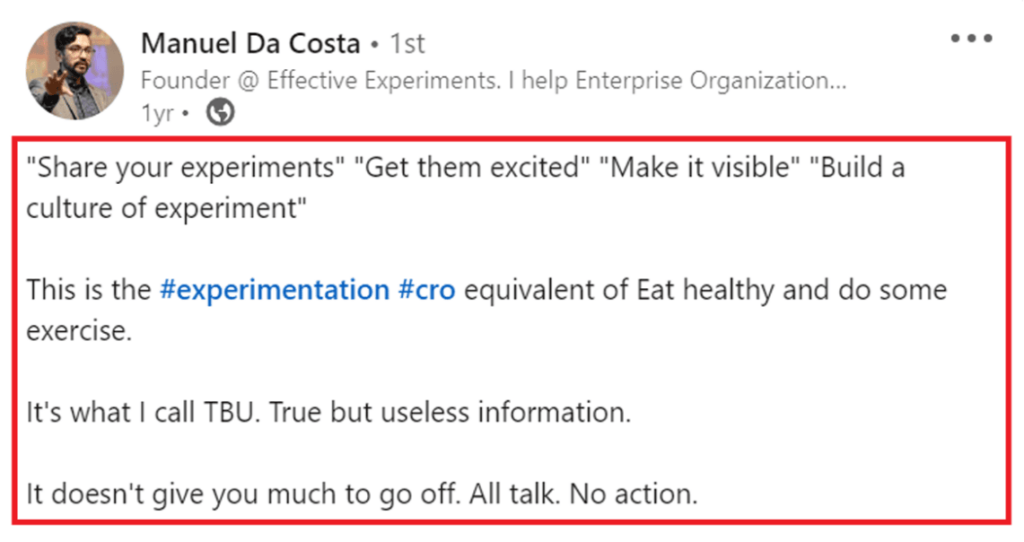
Manuel Da Costa, a CRO specialist, sums it up nicely that CRO isn’t just about talking — it’s about taking action based on a data-driven solid plan.
Then, what could a data-driven hypothesis be? Here’s one example below:
“If we reduce the number of form fields in our checkout process, we expect to decrease the cart abandonment rate and increase the conversions, because our data from Google Analytics shows that there’s a 40% drop-off rate at this stage and our form analytics suggests that users struggle with fields such as “Address, second line” and “landline phone number”. The data from our analytics shows that our current cart abandonment rate is 65% and our average conversion rate is 2.5% — we expect to reduce the former by 15% and increase the latter by 5% by simplifying the forms.”
What Data Can Be Used to Inform a Hypothesis
There are plenty of data sources to use as support for your hypothesis. The more different types of data sources you can use, the better.
1. Quantitative Analytics
Quantifying user behavior via website analytics (like GA4 or Adobe Analytics) or conversion funnel analysis (like what Mouseflow offers with its conversion funnel optimization tool) is a valuable starting point for hypothesis development.
But solely relying on quantitative data can lead to incomplete hypotheses. You see the data, but you don’t see the underlying reasons behind it. Without this information, it’s difficult to interpret user motivations and underlying causes of website or product issues.
Here’s what I mean.
Imagine you’re an eCommerce store owner, and you notice that a considerable number of people are abandoning their carts at the shipping page. Quantitative data might tell you that the average cart abandonment rate is 50% at this stage. But this doesn’t explain why people are leaving.
To get a better understanding, you can observe how users interact with the shipping page. And you might discover that, perhaps, the shipping options are confusing for them. Now, that’s already qualitative data.
2. Behavior Analytics
In the example above, diving into user behavior data allowed you to find out the reasons behind the high cart abandonment rate. Now, you can formulate your hypothesis. It’s going to look more or less like this:
“We hypothesize that if we change the description of shipping options, we will decrease cart abandonment by 10%, because Google Analytics data tells us there’s a 50% drop-off at this stage and our movement heatmap data shows that our shipping options are confusing.”
And then you can proceed to documenting and running your experiment (and make targeted changes to improve the checkout process.
While quantitative data can help you identify areas for improvement, qualitative data is important for understanding the underlying reasons.
To collect qualitative data, one of the tools that you need is a behavior analytics tool like Mouseflow. Behavior analytics platforms offer different ways to analyze user behavior, with the most well known ones being website heatmap tools and session recording tools.
Heatmaps visualize user clicks, mouse movements, and scrolling behavior, helping you see which areas of your website or app attract the most attention. Here’s more about what you can understand about your users by interpreting heatmaps.
Session recordings capture actual user interactions on your website or app, allowing you to observe their behavior as if you’ve been sitting right next to them at the computer while they were browsing your website.. This can be especially useful for identifying usability issues, such as confusing navigation, unclear instructions, or unexpected errors. Here’s more about what you can learn watching session replays.
Now here’s the thing I believe many overlook: session recordings can be effective in persuading stakeholders to make changes.

“Nothing convinces stakeholders better than a video demonstration of users failing epically on your website.”
3. User Feedback
User feedback is another valuable source of information for hypothesis development. I guess that’s one of the reasons behavior analytics platforms offer feedback survey tools as one of their features.
It lets you hear unfiltered opinions and suggestions from real people using your product or your website. User feedback can explain why users like or dislike certain aspects of it, providing context for their actions.
In case you’re wondering why to bother with running user feedback surveys (here’s how to set feedback surveys up, by the way), the answer is that neither quantitative data, nor session replay or heatmaps can capture the same depth of understanding as user feedback. For a deeper breakdown of how feedback fits into a structured optimization process, see our guide to user feedback.
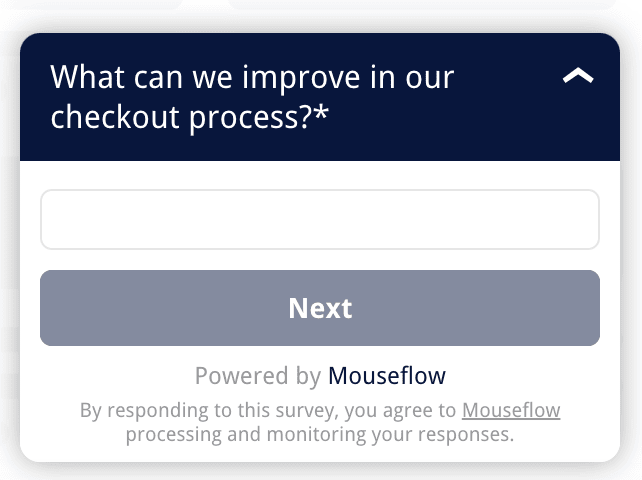
Example of a Mouseflow survey for collecting feedback about the checkout process
User feedback allows you to hear directly from users, so it provides a more personal perspective that can help you identify areas for improvement.
And also, it can serve as an additional data source to support your hypothesis. The more correlating sources you have, the higher the probability that your hypothesis will be true or at least will reveal something interesting.
4. Customer Conversations
Quantitative data reveals “what” happens on the website, qualitative analytics shows you the “why”, and talking to customers reveals their thoughts and intentions that made them act this or that way.
Well, although I see everybody talking about customer insights or conversations, many teams still struggle to extract their full potential. Navigating customer conversations effectively requires more than just asking questions.
A Few Suggestions for Running Customer Conversations
Here are the three suggestions we have for making the most out of customer conversations:
- Don’t dominate the conversation. Customers easily agree, but you don’t want them to support your opinion. You are talking to them to hear theirs. So, instead of “Did you find the checkout process easy?” (leading), ask “Can you walk me through your experience using the checkout, highlighting any areas that felt smooth or frustrating?” (open-ended).
- Don’t settle for easy answers. Instead of “What did you think of the product?” (generic), ask “Can you describe your initial impression of the product? How did it make you feel?” (emotion-focused).
- Don’t let insights get lost in translation — you need to bridge the gap between conversation and action. Conclude by asking “Based on your experience, what changes would make the product easier to use for you?” (action-oriented).

Pay close attention to users’ concerns, objections, and open questions during the buying process.
It is also crucial to understand the users’ buying journey and decision-making process by employing methods such as active listening in one-on-one interviews, group interviews, or brainstorming sessions.
Rapid user tests and on-page surveys, when connected to users’ session recordings and click maps, can further generate valuable insights.
So, these are the four main sources of data for formulating hypotheses. If you get an experiment idea that you think is really great from one of the sources, try using the other data sources to prove or disprove it.
Don’t worry if your idea gets disproved – as you go through the data, it’s likely you’ll generate ideas for a dozen more hypotheses. If you want to get more inspiration an learn how renown CRO professionals come up with hypotheses and learn from their experiments, check out our CRO journal where they share their experience.
Now that you have created a great data-driven hypothesis, it’s time to design your experiment.
How to Design a Good Experiment for CRO
Here are three key steps to ensure your experiment is well-designed.
Document the Experiment
Clear documentation ensures everyone involved stays aligned, facilitates future analysis, and lays the groundwork for successful implementation:
- Metrics: Identify the KPIs you’ll measure, aligning them directly with your hypothesis. Are you tracking conversion rates, engagement metrics, or specific button clicks? Choose tools suited to each KPI (e.g., Mouseflow for heatmaps, Google Analytics for page views).
- Expected outcomes: Define the anticipated results for each variation. Don’t just guess. Use A/B testing calculators or historical data to set realistic expectations.
- Experiment duration: Determine the optimal testing duration based on traffic volume and expected effect size. Too short, and you risk inconclusive results; too long, and you waste valuable resources. Most A/B testing tools have built-in calculators that automatically calculate the required duration based on the amount of traffic the page receives.
- Learnings: Document the insights gained from each experimentation cycle and the iterations or refinements made to the experimental design. Capture both quantitative metrics and qualitative observations, including unexpected findings and emerging patterns.
Analyze the Results for Insight
It may sound strange, but regardless of whether the result was clear-cut or not, or if it was a success or a failure, what’s more important is what you’ve learned from it. So, focus on understanding why your hypothesis was proven or disproven.
Then, make sure you use post-experiment segmentation to find out if some groups of users exhibited different behaviors. Here are some ideas for you:
- Desktop vs mobile visitors: That’s the most obvious one, but it may reveal important differences in behavior between desktop and mobile users that could’ve influenced the results.
- Persona-driven analysis: Analyze results through the lens of your established user personas. Did a specific variation resonate particularly well with a specific persona? This can inform targeted optimization efforts.
- First-time vs. repeat purchasers: Analyze how each group interacts with your site, identifying pain points for first-time users and loyalty drivers for repeat customers.
- High-value vs. low-value customers: Understand the browsing and buying behaviors of your most valuable customers to optimize the experience for them, while also identifying opportunities to convert low-value customers into high-value ones.
- Complementary product buyers: Analyze users who purchase specific product combinations to identify cross-selling and upselling opportunities.
- Wishlist users: Analyze users who add products to their wishlists but don’t purchase. See if you can offer incentives or personalized recommendations to convert them.
- Promotional channel: Analyze user behavior based on the channel they received the promotion through (email, social media, etc.). This helps you understand which channels drive the most conversions and tailor future promotions accordingly.
Use Insights to Inform Future Experiments
The learning never stops, right? Think about your findings to continuously refine your approach. Analyze results to identify areas for further exploration. Did a specific element within a variation show promise? Explore it further in a new experiment that you add to your CRO roadmap.
I’d recommend that you allocate resources based on learning, and focus on areas with the highest potential impact based on data-driven insights.
Final Thoughts on Data-Driven CRO Hypothesis
Diving into all this data may sound all too complicated, but effective CRO isn’t about quick fixes or lucky guesses.
By following the steps outlined in this article, you’ll no longer be stuck in a cycle of underperforming tests. Instead, you’ll develop data-driven hypotheses that fuel targeted experiments, show you hidden conversion opportunities, and pave the way for sustained optimization.