For many developers, identifying bugs and errors is an absolute nightmare! It’s difficult to prove when, where, and why issues happen… until today.
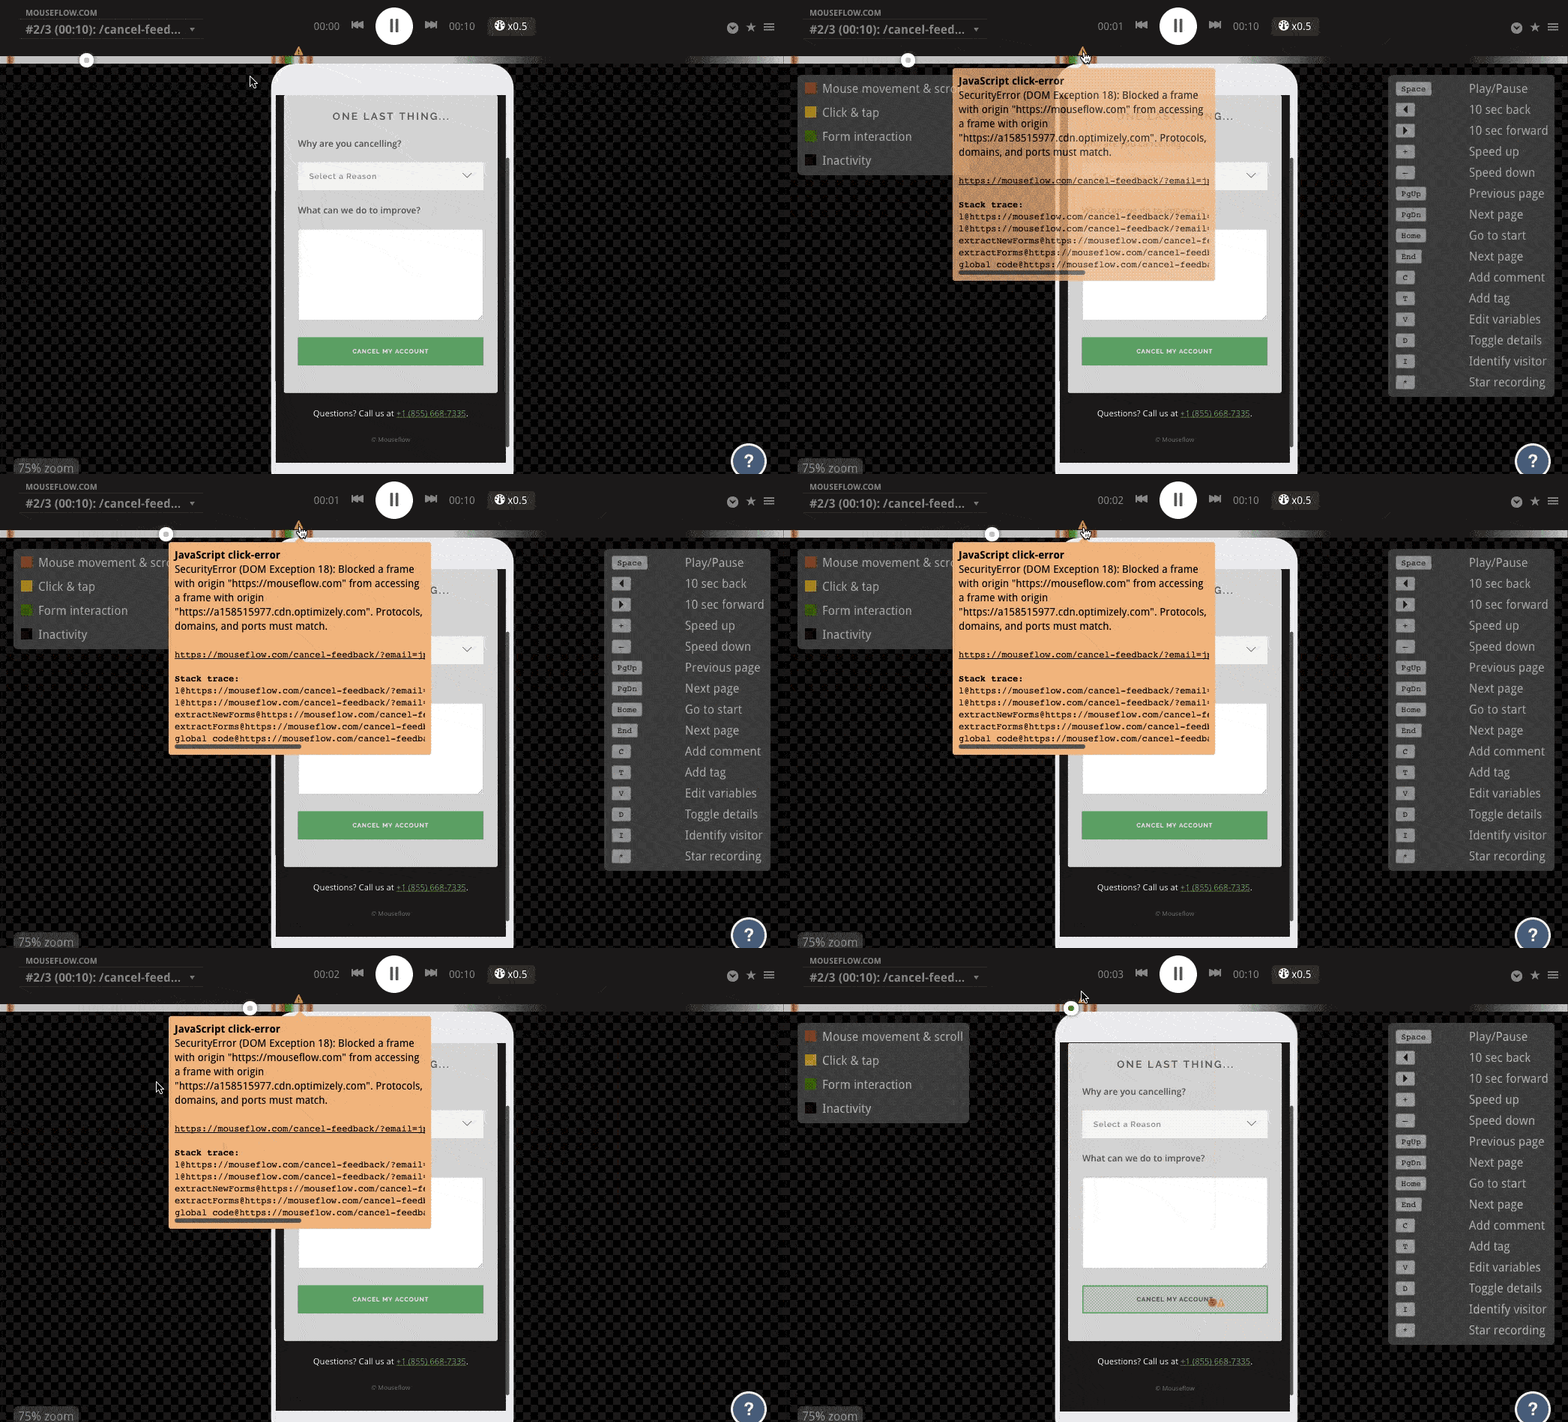
Our playback now reveals the full error message, affected source files, line/column numbers, and a stacktrace at the precise moment where “click-error”s occur. This shortens the required time to diagnose and fix issues that would otherwise be impossible to find.
Here’s an example of how it looks:

During playback, a “click-error” is denoted in the timeline with an orange warning triangle. If you hover over it, a window will expand containing the relevant details for the exact error that occurred. The output is derived from the visitor’s JavaScript console — so you get a one-to-one representation of bugs in the wild.
When integrated with session replay, Mouseflow provides website developers and administrators with everything they need to properly detect, verify, and resolve JavaScript errors.
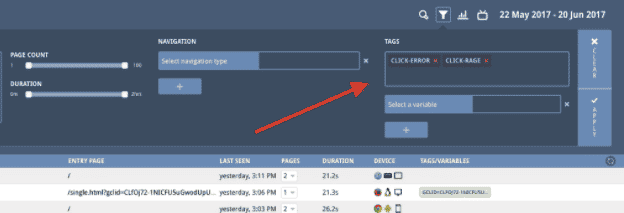
Ready to test it out? Just go to Recordings > Filters > Tags, search for the “click-error” tag, and click “Apply”. Next, pick a session from the list, click play, and let the data speak for itself.

So, what are you waiting for? Go try JavaScript Error Tracking today!

