I’m pretty sure that if you’re reading this post, you are well aware of traditional web analytics tools and have plenty of experience using them. But there’s also a hidden dimension, a treasure trove of knowledge waiting to be unlocked: session replays, aka session recordings.
By combining session replay tools with traditional web analytics, you can gain insights into user behavior and website performance that were unreachable before. Let’s talk about what session recording tools can do for you, how exactly you can use them, and how to integrate session replays into your Google Analytics setup.
Move Like a Pro: Using Session Replay Tools with Web Analytics
Traditional web analytics tools like Google Analytics and Adobe Analytics (sometimes referred to as quantitative analytics) are fundamental for understanding how users interact with your web assets. They provide valuable insights into quantitative metrics, such as page views, click-through rates, bounce rates, and so on.
Quantify: What Traditional Web Analytics Is Good For
Tools like Google Analytics are particularly good for certain things:
- Getting an overview of your website’s traffic. Understand how many people visited your website, how long they stayed, which devices they used.
- Measuring content performance. Observe basic metrics such as page views, unique visits, bounce rate, and so on. With these, you can assess which pages resonate with your audience, and refine your content strategy.
- Establishing and tracking goals. Your objectives may involve e-commerce transactions, sign-ups, or other specific user interactions. Google Analytics provides a solid framework for setting up and monitoring these goals.
- Revealing traffic sources. Traditional web analytics tools provide valuable information about where your website traffic is coming from, be it organic search, paid advertising, social media, or referrals.
- Exploring user demographics. Additionally, using Google Analytics you can take a closer look at user demographics, offering insights into your audience’s age, gender, location, and interests.
That’s valuable! But true pros in the digital field have long realized that to make well-informed decisions, it’s essential to understand not just what is occurring on your website but also uncover the underlying “why”.
And for that, they use behavior analytics tools like Mouseflow, with a particular emphasis on session recordings. These advanced solutions provide the ability to witness the user’s digital journey, from how they move between pages, to their clicks and cursor movement, and moments of friction they may encounter. And it’s withing these details that the secrets of user engagement and interactions lie.
Qualify: What Session Replay Tools Bring to the Table
Here’s what these qualitative analytics tools can be especially useful for:
- Understanding visitor interaction. Session replays allow you to see how your website visitors actually interact with your website. From mouse movements to clicks and scrolls, you can observe their every action.
/li> - Discovering UI/UX issues. Analyzing user behavior data, you can identify design problems, usability challenges, and points of confusion. This enables you to fine-tune your website’s design for optimal usability.
- Examining user flows in detail. Session replays help you better understand user flows. Use them to analyze the exact paths that the visitors take through your website and identify specific problems in the user journey.
- Finding bugs and errors. Behavior analytics data also helps you locate broken elements or technical glitches on your website, whether it’s non-functional buttons, broken links, or loading issues. Just look for replays with a high friction score!
- Optimizing conversion rate. Behavior analytics offers valuable insights into the conversion process, revealing where — and why! — visitors abandon their actions, such as leaving incomplete forms or abandoning shopping carts.
Does Google Analytics Offer Session Replay?
Session replays can provide a ton of insights. But neither Google Analytics 3 (aka Universal Analytics) nor its successor Google Analytics 4 (GA4) offer session replay capabilities. Similarly, Adobe Analytics also lacks a built-in session recording feature. So does Plausible Analytics.
In other words, with most traditional web analytics tools alone, you cannot access session replays.
However, you can use third-party products to fill this gap – we’ve recently published a review of the best session replay tools. Mouseflow is a notable option, offering comprehensive behavior analytics that can complement traditional web analytics platforms. It provides session replay functionality, along with other valuable features such as heatmap tool and conversion funnels.
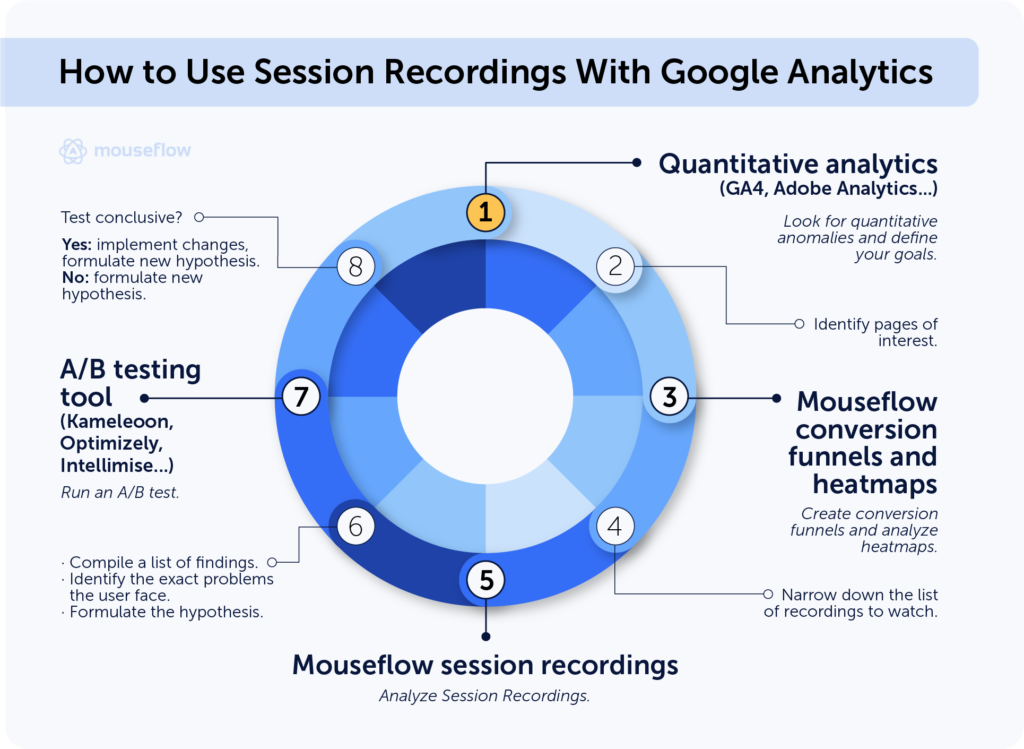
Getting Insights from the Web Analytics + Session Replay Combo: Step-by-Step Guide
You can achieve the best results and find the most valuable insights by combining traditional web analytics and session replays. And using some other behavior analytics tools along the way.
In this step-by-step guide, we’ll explore how to leverage the synergy between these two powerful instruments to gain unique insights into how visitors interact with your web assets. Berglind Jónsdóttir, Senior UX Designer at Mouseflow, recommends using this process for major UX revamps you want to do on a website or service, and uses it herself. It provides you with a data-driven approach to identify areas for improvement, and optimize the overall user experience.
1. Look for Quantitative Anomalies
The initial stage of any optimization project is defining your goal. You might aim to enhance specific metrics such as conversion rates or engagement levels. Or you could be planning a redesign of particular product pages.
In any case, once your project kicks off, it’s crucial to begin gathering data to determine the precise areas that need attention. Data is your best tool for convincing stakeholders. Your logical entry point is traditional quantitative web analytics, such as good ol’ GA, Adobe Analytics, Plausible Analytics, or what have you.
If you don’t know where to begin, you may want to start with seeking anomalies. They can give you an idea about where you should dig deeper. Look for something intriguing that catches your attention, whether it’s a sudden fluctuation in metrics, lower-than-expected page visits, changes in specific events, or any other notable observations.
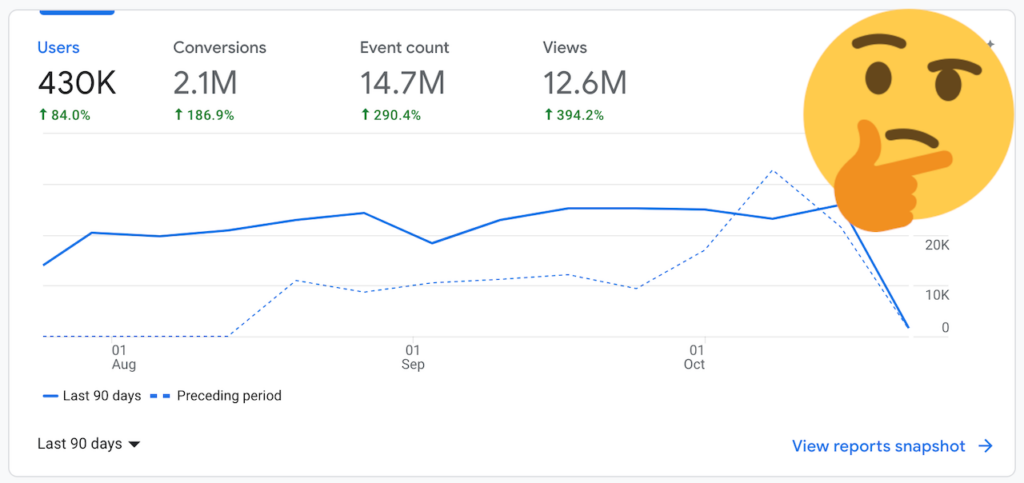
Google Analytics gives you data on what’s happening, but doesn’t provide insights why it’s happening
2. Identify the Pages of Interest
After pinpointing your areas of interest, it’s time to zero in on specific pages or sequences of pages that require closer examination. You can do this both with Google Analytics and Mouseflow.
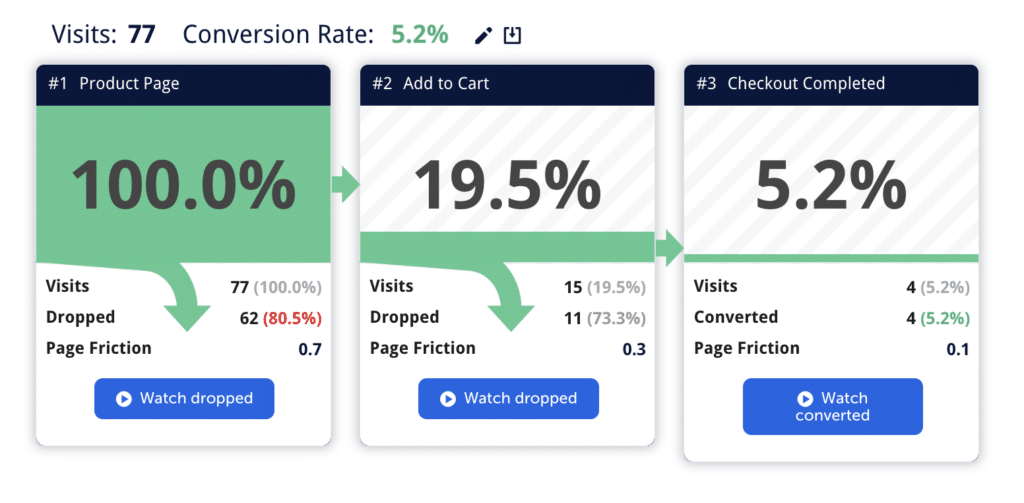
Once done with that, you can create a funnel for the selected pages to monitor their performance and keep track of their evolution over time. Funnels are great visual tools for reporting. It’s very easy to see changes in conversion rates by looking at funnels.
The great news is that, in Mouseflow, funnels are retroactive. This means you can create a funnel at any moment and start gaining valuable insights right away, tracing how user interactions have occurred in the past.
Mouseflow’s funnels are retroactive: build a funnel – and you’ll have data for it right away.
3. Look for Behavior Anomalies with Heatmaps
Now that we’ve outlined the problem that we want to solve and set up some reporting mechanisms, it’s time to understand why things are happening. Start with examining the heatmaps for the specific page or pages that you have chosen in the previous step.
Look for subtle yet crucial details. That could be clicks on elements that weren’t designed for interaction. Or a notable absence of clicks on elements that should attract user engagement.
Pay special attention to any instances of possible user frustration or confusion, which may manifest as click rage or click error events. Identifying these can help you highlight serious design flaws or functionality issues that need immediate attention.
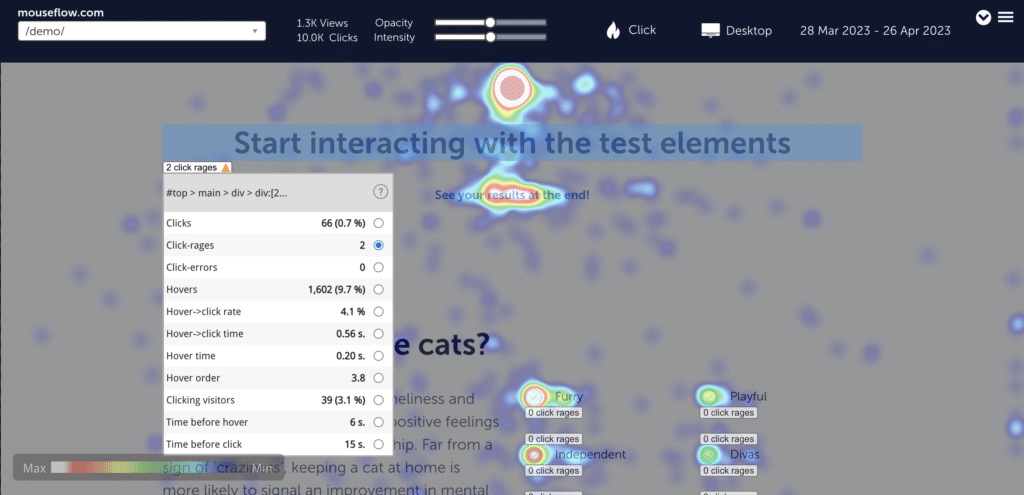
A heatmap of Mouseflow’s demo page highlighting elements with click-rage.
4. Identify the Session Recordings of Interest
So far, we’ve been gathering data and preparing for the most interesting part – watching the session recordings. But before we get there, we need to narrow down the list of session recordings for closer examination even further. Watching session replays can be time consuming, so you need to carefully pick what you watch.
The good news is that we’ve already prepared everything for it. To narrow down the list of session recordings, you can use either the funnel data, heatmaps, or both, depending on your specific objectives.
For example, let’s say your funnel analysis revealed a significant drop-off rate during the checkout process. Then you can narrow down your recordings to those sessions where users abandoned their carts. Similarly, if the heatmap highlights unusual interactions on a specific webpage, you can focus on recordings that correspond to sessions on that particular page.
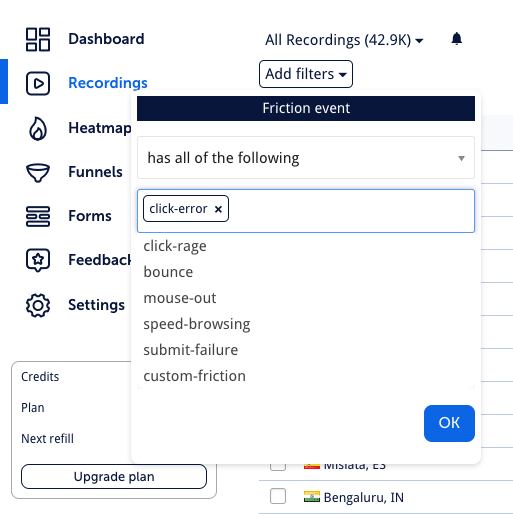
Using filters to filter out session recordings with click-errors.
5. Observe Users’ Actions
Now, watch the selected session replays closely to see firsthand how users actually interact with your website. Again, pay special attention to recordings with click rage and click errors, as they signify points of frustration or confusion in the user journey. In Mouseflow, these are marked with unhappy red or yellow emojis. You can filter the recordings list so that only these are visible, if you want.
During this step, your objective is to thoroughly analyze your visitors’ behavior and understand the reasons behind their actions. Here are some examples of what you can learn by watching session recordings.
By the way, don’t forget to take notes on your observations to look for patterns later.
6. Compile a List of Findings
Once you’ve finished reviewing the selected recordings, it’s time to organize the facts you’ve uncovered into a structured list. It’s advantageous to categorize these findings into two distinct groups.
- The first category should include insights in which you have a high level of confidence because you observed multiple users repeatedly engaging in the same behavior.
- The remaining anomalies that you’re unsure about should go to the second group. You can revisit them later if you encounter similar cases.
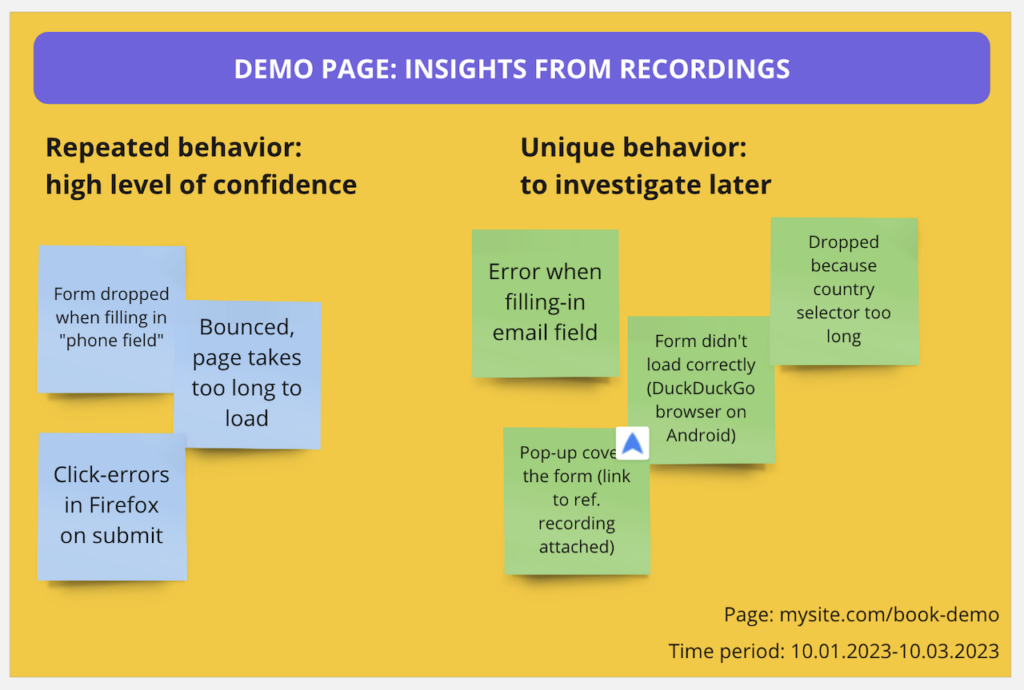
You can use a Miro board to gather and group insights from session recordings
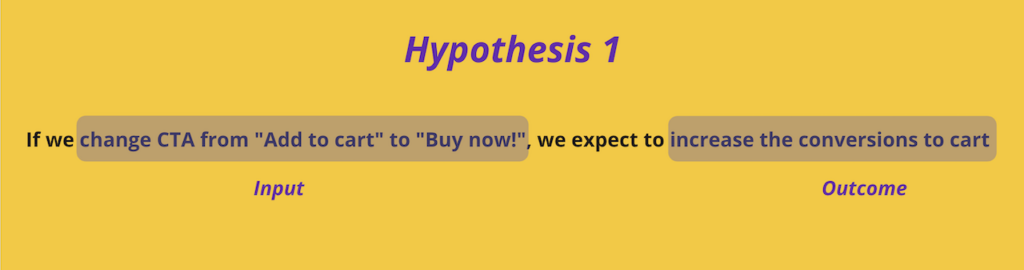
7. Formulate Hypotheses
This step involves generating hypotheses about potential issues or areas for improvement based on your findings and insights. Now that you know what went wrong and why, consider what could be changed, added, or replaced to enhance the user experience. These hypotheses serve as a bridge between your observations and actionable changes to your website.
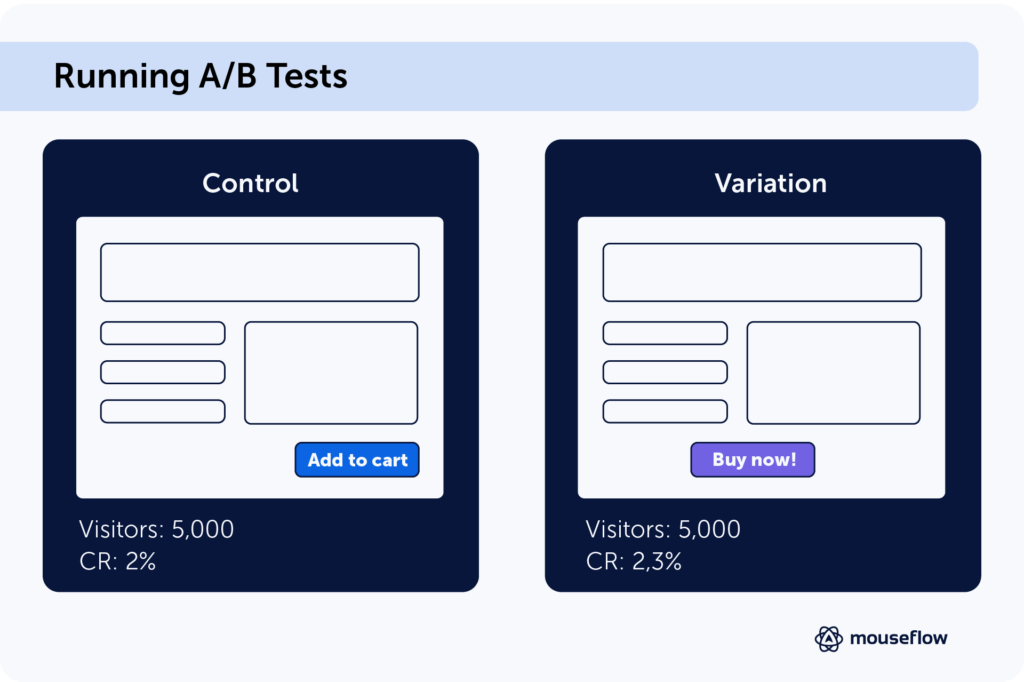
8. Implement Hypotheses and Run an A/B Test
Now comes the action phase. Prepare and run an A/B test, where one of the versions of the web page contains the necessary changes. As you make these changes, tag the modified elements with Mouseflow custom tags for easy tracking and analysis.
If you don’t have an A/B testing tool, it’s not the end of the world. You can still implement the changes on your website. Thanks to the data you’ve gathered, at this point you have quite some certainty that you’ve pinpointed the cause of the problem.
9. Evaluate the Result
Time to look at the results of your test. If you didn’t rely on an A/B testing tool, you can use the funnels that you’ve set up. Assess whether the changes have a positive impact on the conversion rate, and whether your test was statistically significant and conclusive.
If the test is conclusive, you can implement the changes site-wide and enjoy the improved user experience. If not, time to come up with a new hypothesis (and jump to the next stage)!
Don’t forget to assess the impact of your implemented changes. To ensure that the modifications function as intended, examine session recordings with a custom tag from the previous step. This is how you check that you haven’t introduced new website friction points.
10. Rinse and Repeat
It’s important to continue exploring recordings after implementation. Do that to identify any overlooked usability issues that may not have surfaced during user testing.
Additionally, keep observing whether your design changes are achieving their intended outcomes. After all, the design process is an ongoing, iterative process. These post-implementation insights can form the basis for future refinements.
How to Integrate a Session Replay Tool into Your Google Analytics Setup
Now, for the final question: how do you add the session replay feature to your Google Analytics?
You have two options. You can use Google Analytics and Mouseflow separately, compiling their respective insights manually. Or you can integrate the platforms to make it easier to identify the recordings of interest right from GA4. Here you can find a comprehensive guide on how to integrate Mouseflow with Google Analytics 4, but basically you need to do the following:
- Create a custom dimension in Google Analytics.
- Set up the integration, depending on whether you installed GA4 using gtag.js or Google Tag Manager (GTM).
- Access Session IDs in Google Analytics.
- Find session recordings related to these Session IDs in Mouseflow.
The ultimate result of this integration is that you can get Session IDs from GA4. Use them to locate and watch the corresponding session recordings in Mouseflow. By the way, we also have an integration guide for Mouseflow and Adobe Analytics (Omniture).
