
Black Friday / Cyber Monday doesn’t start on Friday (or Monday) anymore.
If you’re already running early access campaigns, timed drops, or email countdowns, your site is seeing increased traffic right now. That means many of the problems you’ll face on Black Friday are already there, just hiding in plain sight.
Waiting until the big day to spot friction on your website is waiting too long. By combining Shopify, GA4, Mouseflow and other website analytics, you can monitor users in real time, spot what’s not working, and fix it fast before it costs you sales when traffic surges.
The real challenge: Spotting problems before they turn into bigger ones
You already know the usual pitfalls:
- Pages that look great on big screens but break on mobile.
- CTAs that hide below the fold or even have the wrong color.
- Promo banners that confuse more than they convert.
- Checkout forms that make your shoppers drop off.
Tools like GA4 can show you when metrics dip, and Shopify will show you what was (or wasn’t) purchased. But neither will show you why. That’s where behavior analytics come in, to highlight friction, frustration, and hesitation, in the exact moments they happen.
Mouseflow gives you that layer of clarity. And if you’re running campaigns right now, it’s the perfect time to act. That’s what made the difference for Scotts Miracle-Gro. As Hailey Schraer, Lead UX Researcher, puts it:

“Mouseflow helped us identify where customers were getting stuck in the checkout process. We made changes based on those insights and saw an immediate 5% lift in conversions.”
What you should be doing today
Your traffic is already there. We’ve already established that. Here’s how to use it to fix what matters most.
Run a friction scan on your top landing pages
Your campaign landing pages are under pressure. If those pages are already causing friction, like confusing layouts, broken interactions, or anything that makes users hesitate, they won’t hold up when traffic peaks.
In Mouseflow, use the Friction Insights Dashboard to identify the highest-friction pages. From there, you can analyze friction trends over time to understand when and how problems are escalating. For example, in the chart below, 16% of all sessions during October showed friction, and that number adds up fast when scaled across thousands of users.
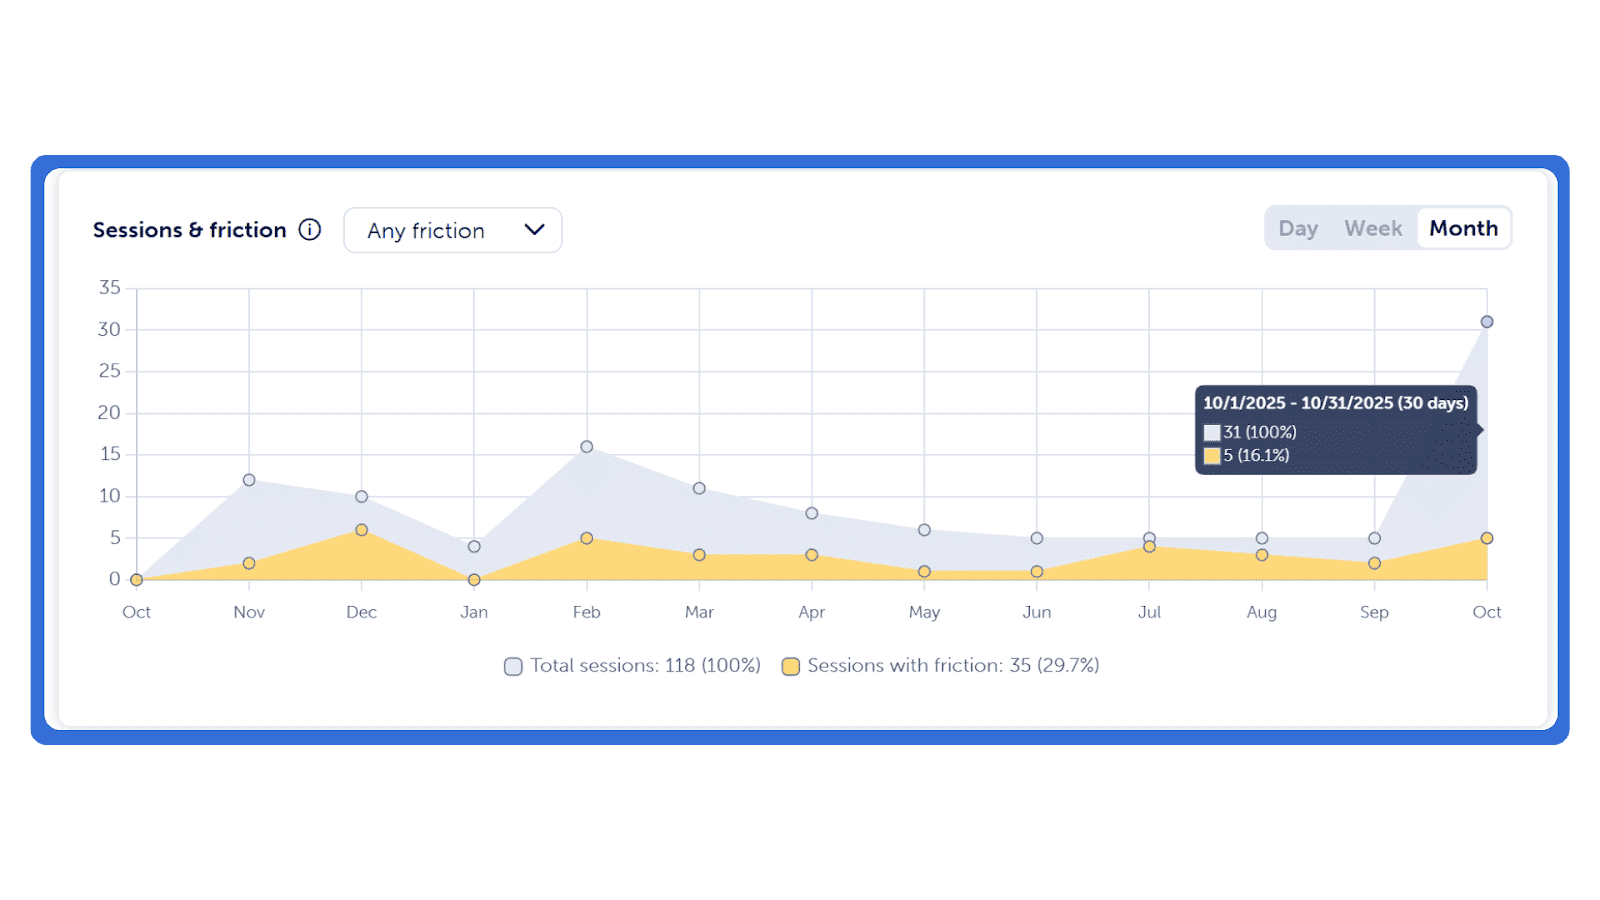
If you notice spikes, try to tie them back to campaign launches, new layouts, or recently added functionality, if there are any. Identifying friction early helps you fix issues before they become expensive problems.
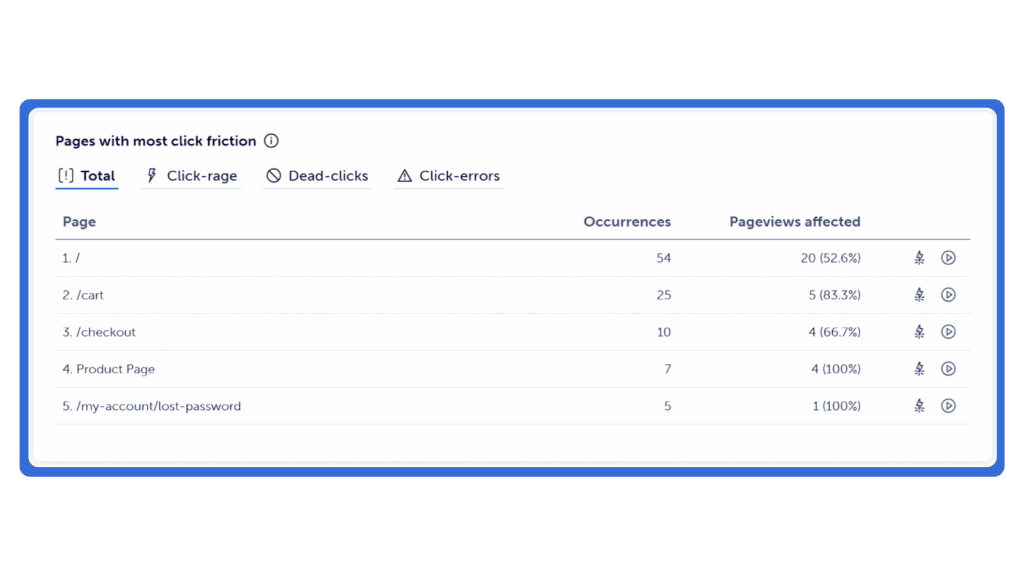
Next, look into the pages with the highest click friction. This view ranks the specific URLs causing the most frustration, so you’re not guessing where to focus.
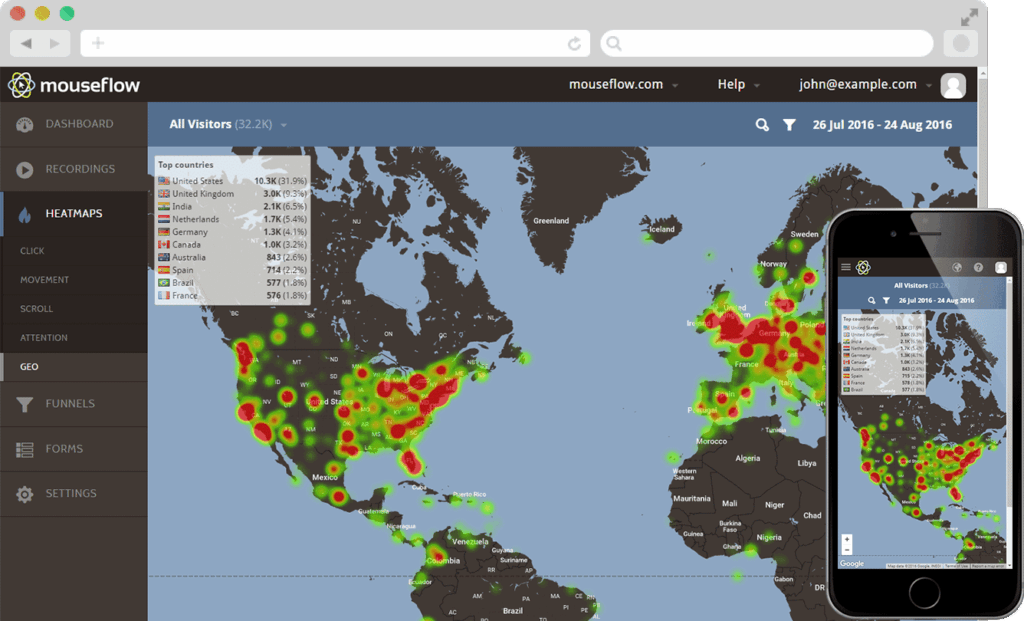
And if you want to see where users are struggling, you can also open a heatmap for the affected page. Mouseflow offers seven different types of heatmaps – Click, Scroll, Movement, Attention, Friction, Interactive, and Geo – each uncovering a unique layer of insight about how users experience your site. Together, they don’t just show what people do, but why they do it.
And if you’re running campaigns across multiple countries or regions, check your Geo heatmaps to see which markets are driving traffic, and whether that traffic is performing. If a high-traffic region has low engagement or conversions, that could signal issues with language, offer relevance, or local expectations around shipping or pricing. Use that insight to localize copy, tweak creative, or adjust targeting while there’s still time.
Pair all these findings with Session Replay to see what actually happened and why. Once you know which sessions to focus on, you can watch exactly what happened in real time. It’s like running a usability test on your most valuable traffic based on real users, not assumptions.
You can filter sessions by behavior, device, entry page, or specific friction events. You can also filter by duration. Sessions that last exactly 10 seconds with no interaction at all are a quick giveaway – that’s likely bot traffic.
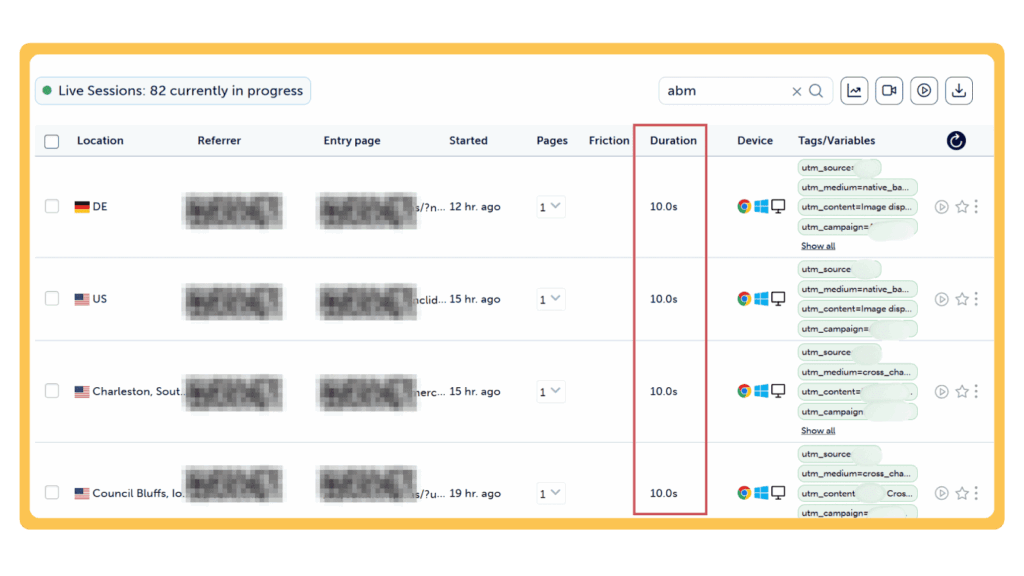
If you see a spike in those sessions, check where they’re coming from. If it’s tied to a specific campaign or traffic source, you can either refine your targeting or stop the campaign altogether. Spotting and stopping bot visits early keeps your landing pages focused on the visitors who actually convert, and makes your analysis far more reliable.
Use funnels and journeys to pinpoint where users drop off
Once you’ve spotted friction and watched sessions from users experiencing friction, it’s time to step back and ask: how much is it costing us?
That’s where Funnels and Journeys in Mouseflow come in.
Funnels show how users move through critical steps on your site, from homepage to product page, or cart to checkout. They highlight where users drop off and how much potential conversion is lost at each stage.
Because Mouseflow funnels are based on actual pageviews, setup is fast. Define the steps you care about, let the data roll in, and jump to session replays from any drop-off point to see the story behind the numbers.
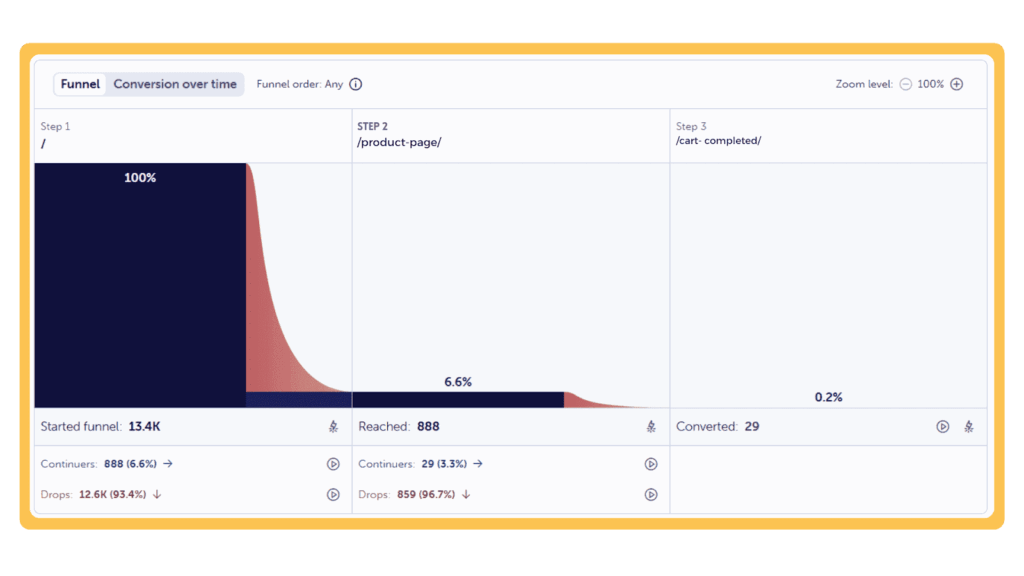
In the example above, 93% of users dropped off after landing on the homepage, long before reaching the pricing or demo booking steps. That’s a signal something isn’t working. Maybe the homepage lacks clarity. Maybe the next step isn’t obvious. Watching those sessions fills in the gaps. One customer summed it up this way:
“Mouseflow session recordings, together with conversion funnels, showed that users were confused by the login page and often abandoned the process. They seemed to think they needed to log in, and were discouraged by that, even though the website offered a guest checkout option as well.”
Journeys shows you the customer’s journey through your website. Just set a focus step, like your product or checkout page, and Mouseflow will show you the steps the customer took before landing to that page and what they do after. You’ll see if they are bouncing around, taking routes you didn’t expect, or worse, dropping off entirely before making the final purchase.
Together, Funnels and Journeys give you a fuller picture of the entire customer journey.
Set alerts now, not when it’s too late
You won’t catch every issue manually. That’s why real-time alerts in Mouseflow help you stay ahead.
Set up alerts in Mouseflow for:
- Spikes in friction on high-traffic pages
- Increases in form abandonment on checkout
- Multiple rage clicks – quick, repeated clicks when something doesn’t respond
Tie these alerts into your team’s workflows, Slack, email, whatever works, so nothing gets missed. It’s your early warning system. The faster you know, the faster you fix it.