Website Heatmaps
The Ultimate Website Heatmap Tool to Optimize UX & Conversions
Visualize how users click, scroll, and navigate your website with Mouseflow’s heatmap analytics.
Book a demo
1-1 personalized gold
Take an interactive tour 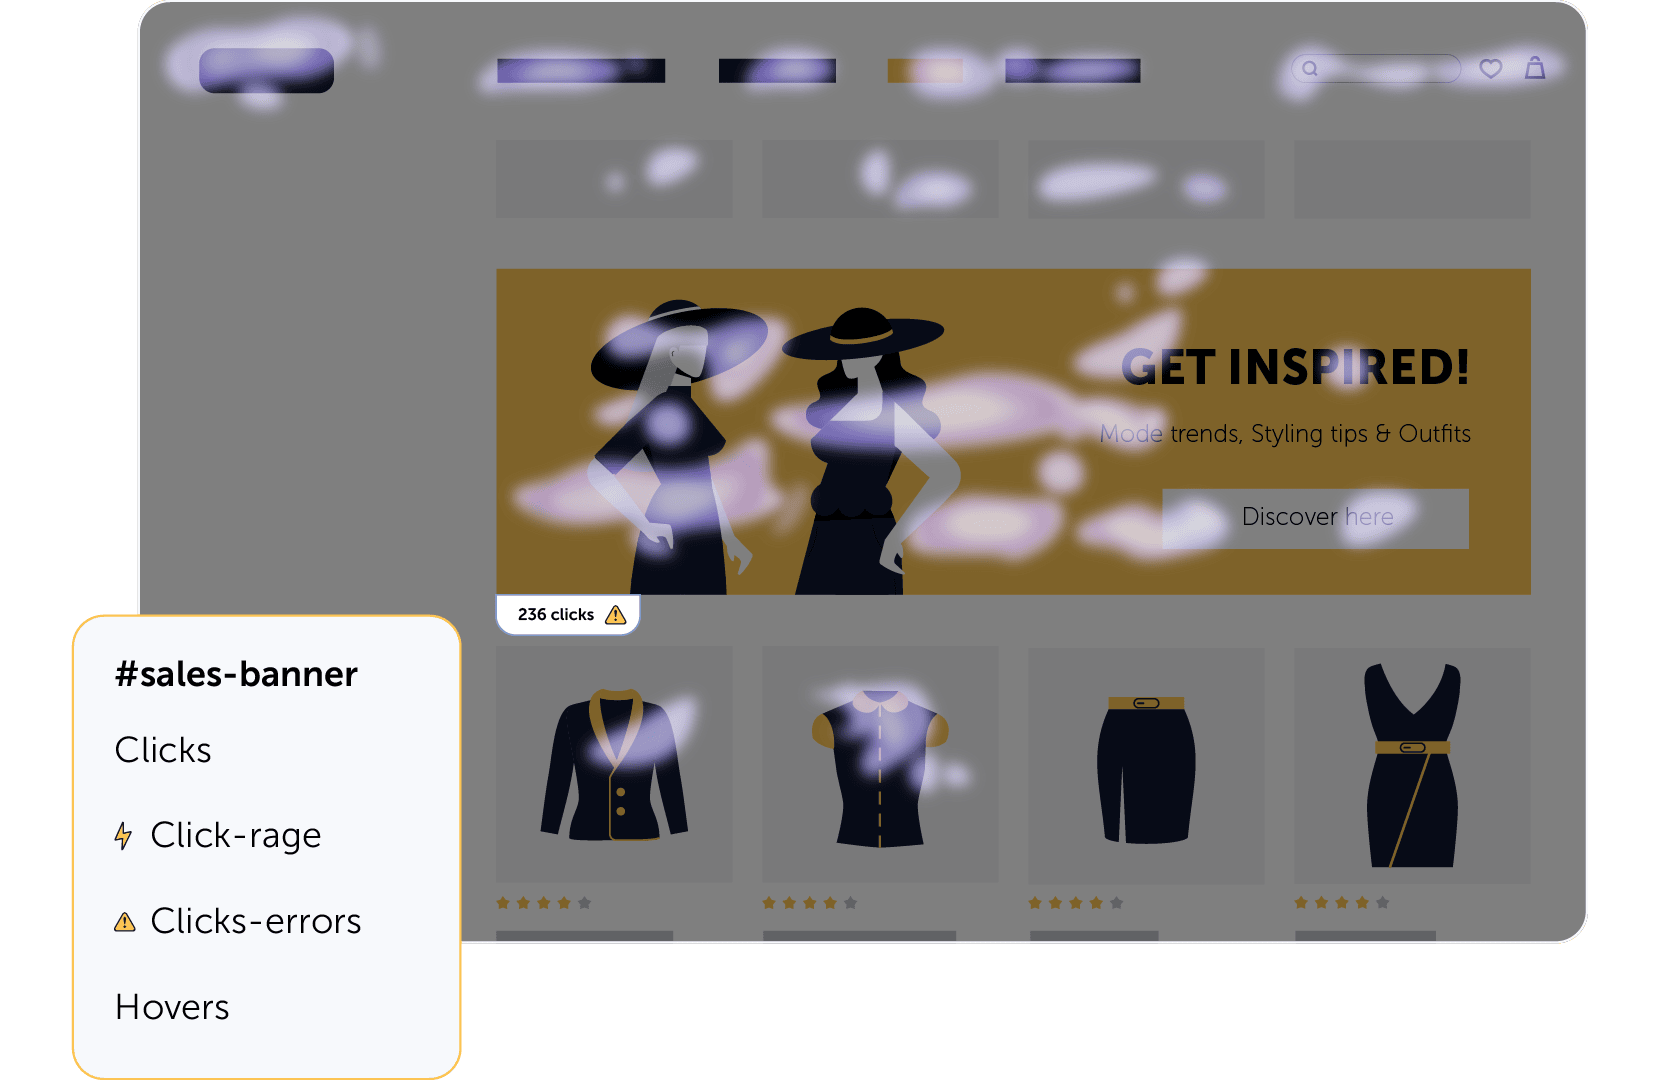

Click, Move, Scroll – in High Def
Track every user interaction with pixel-perfect precision using our all-in-one website heatmap software. Visualize clicks, hovers, scrolls, and more – all in one unified view.

Filters That Dig Deep
Segment your heatmaps by device, traffic source, or campaign. With our powerful heatmapping tools, you’ll understand user behavior in full context – not just what happened, but why.

Frustration Detection Built In
Detect rage clicks, errors, and bounce behaviors with smart heatmap analytics. Know when something breaks UX – and how to fix it fast.
Discover our 7 different website heatmaps
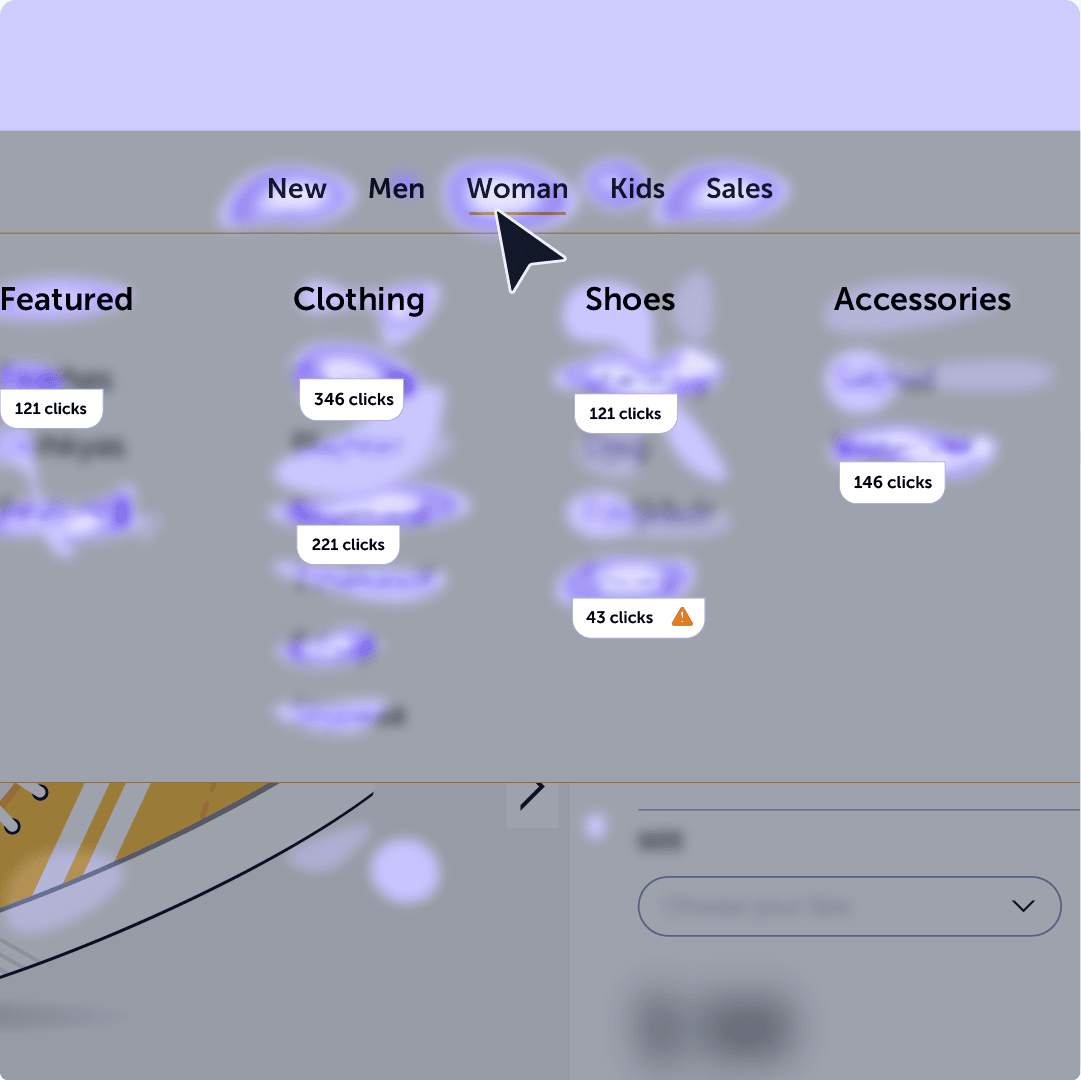
Click
Click heatmaps show where people actually click (or try to). Use them to see if your CTAs are working – or if users are getting sidetracked.
Track clicks
Analyse hovers
Discover distractions
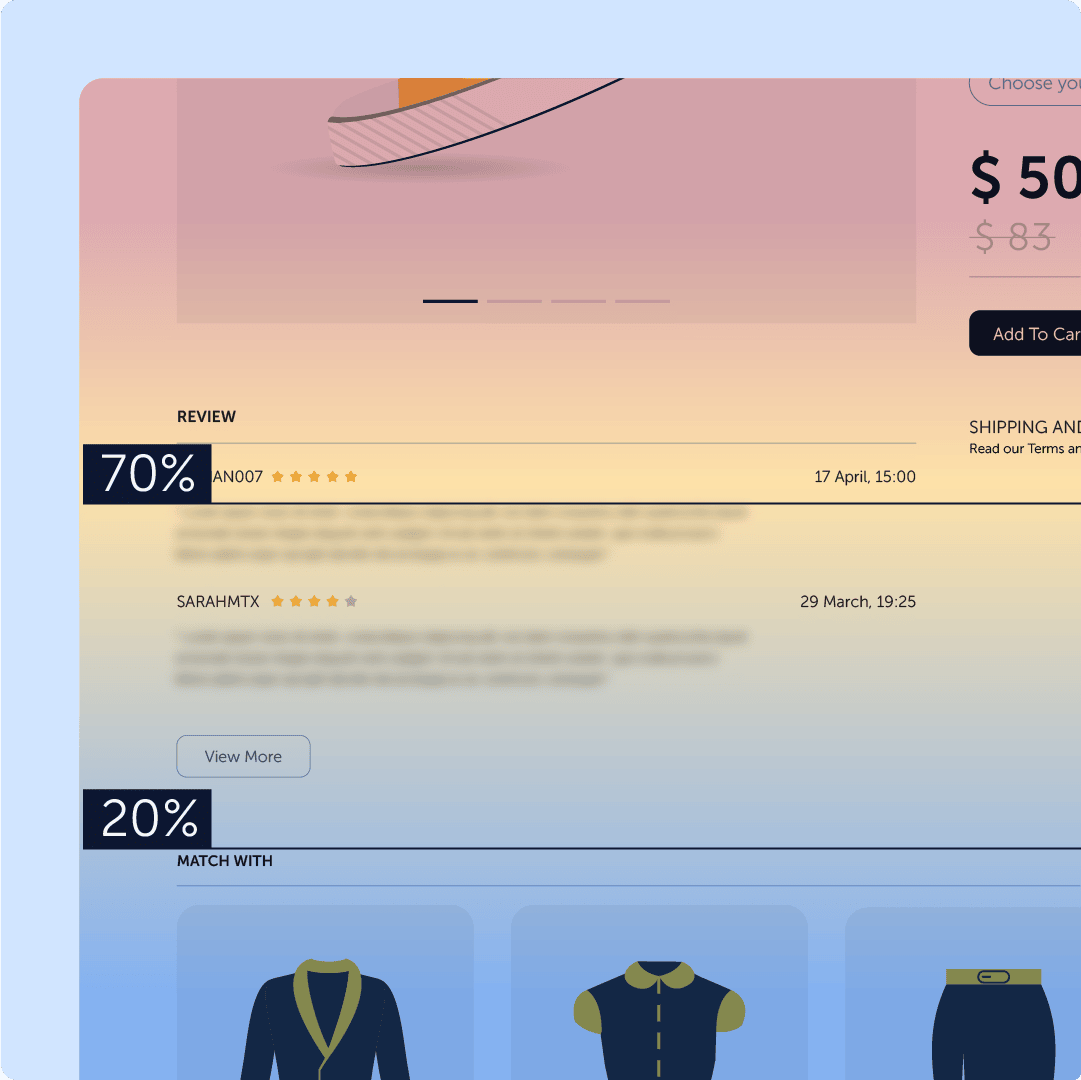
Scroll
See how far down users scroll. Find out if key content is seen or lost in the depths of your page.
Measure content visibility
Reorder for impact
Spot drop-off points
Movement
Track where users linger and hover, even if they don’t click. A sneaky way to understand what grabs their attention.
See hover patterns
Understand hesitation
Optimize placements
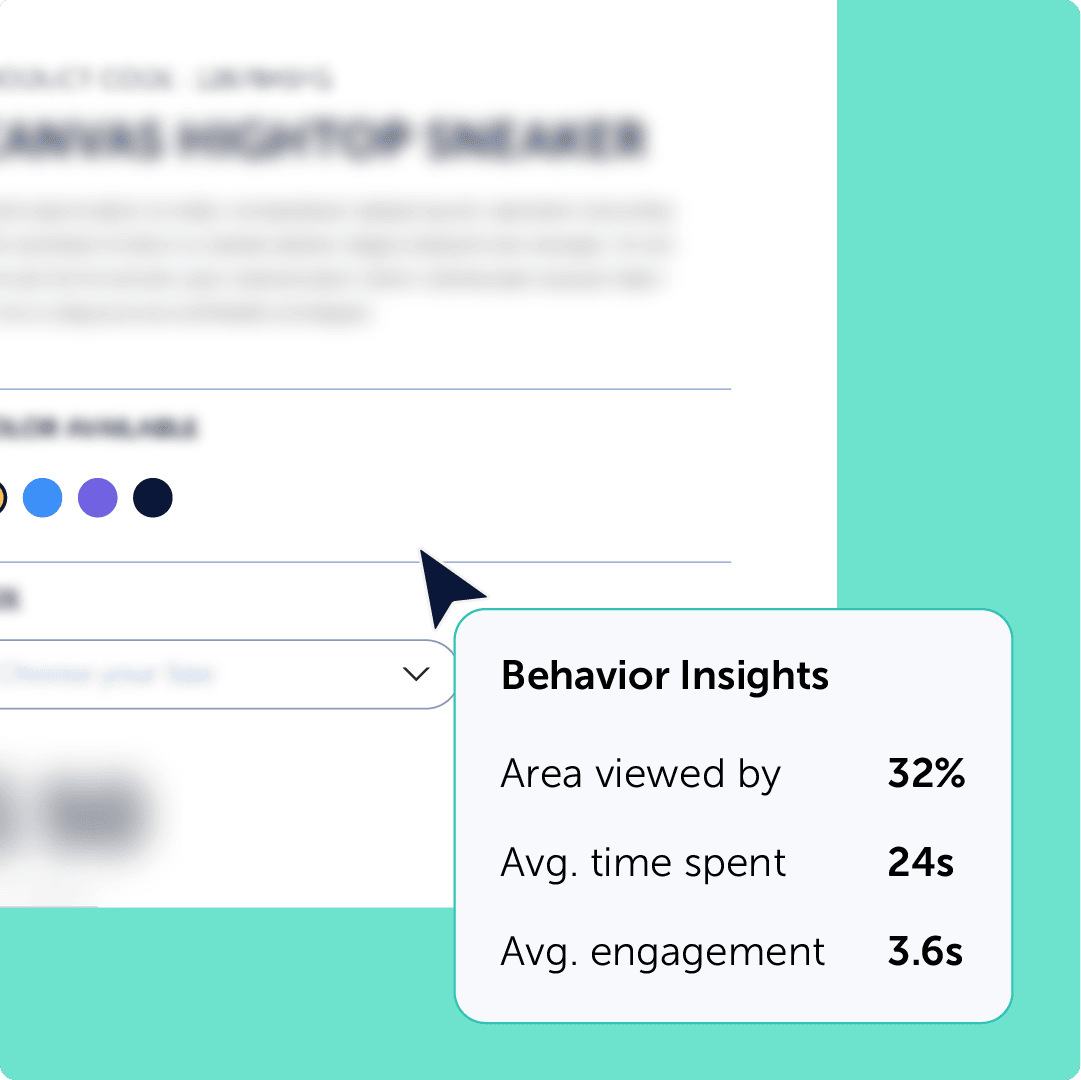
Attention
Blend clicks and scrolls to show where users are most engaged. Great for testing CTA spots or layout changes.
Find high-engagement zones
Prioritize visible content
Guide better design choices
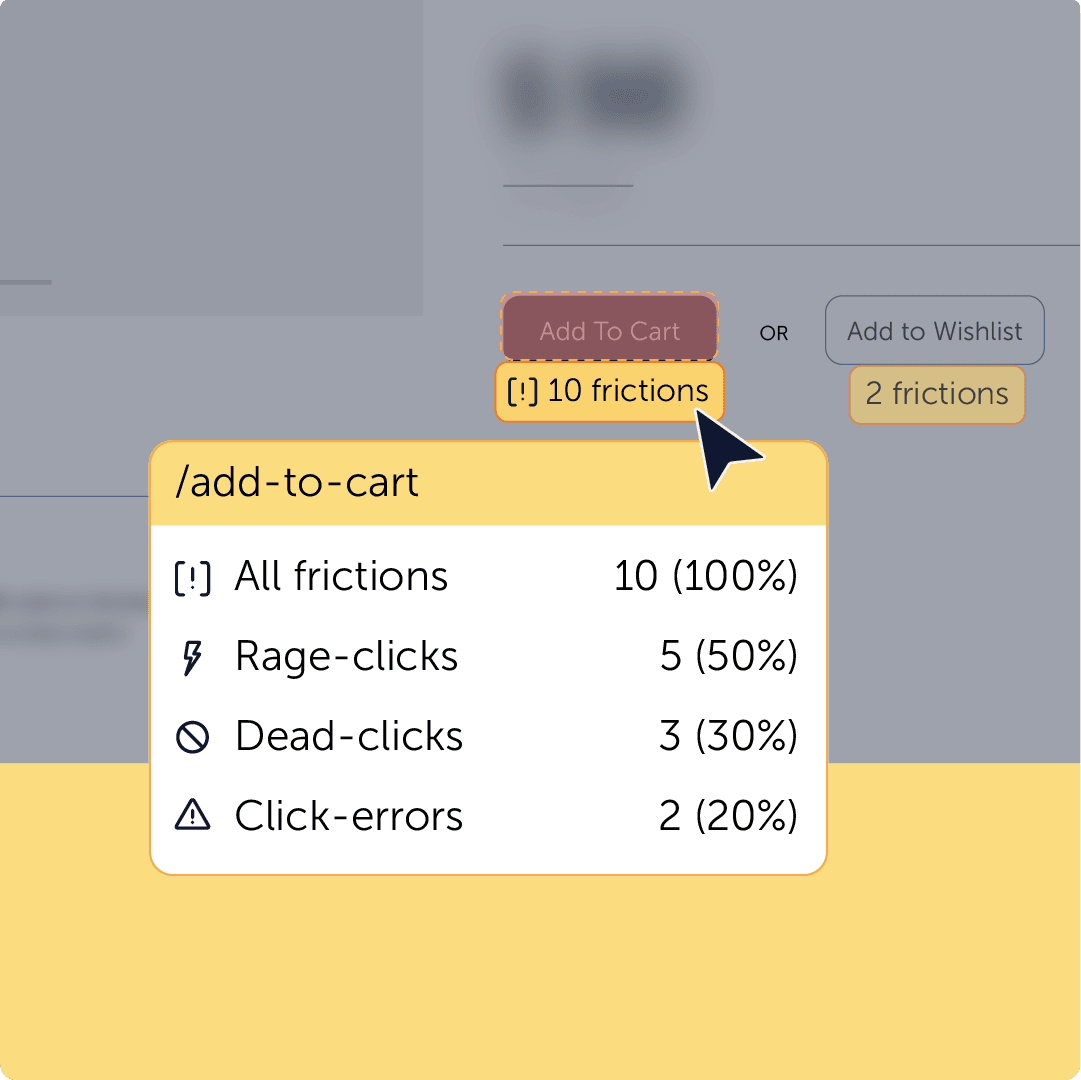
Friction
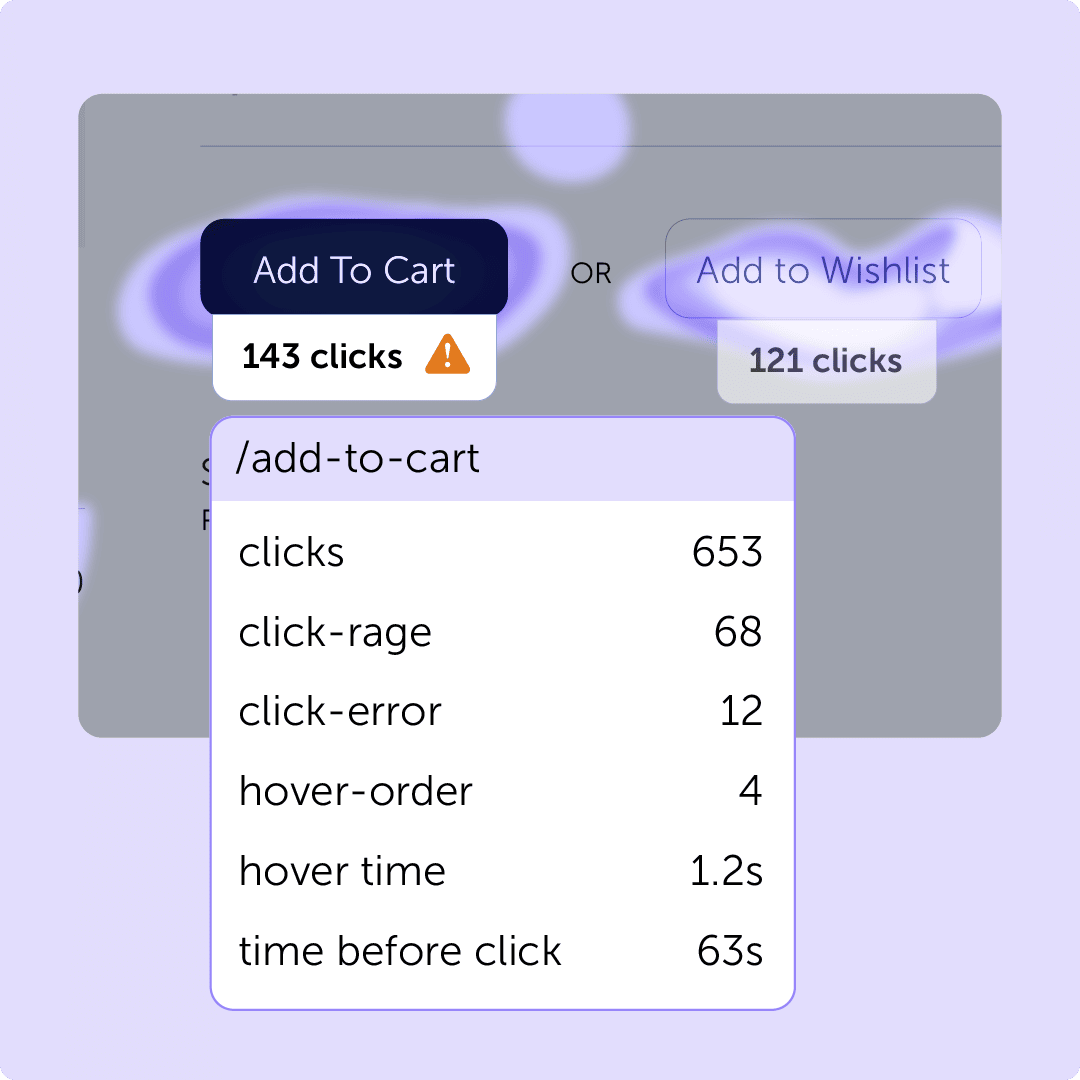
Catch where users rage-click, experience errors, or get stuck. Perfect for squashing bugs and smoothing journeys.
Detect frustration points
Surface UI blockers
Streamline user paths
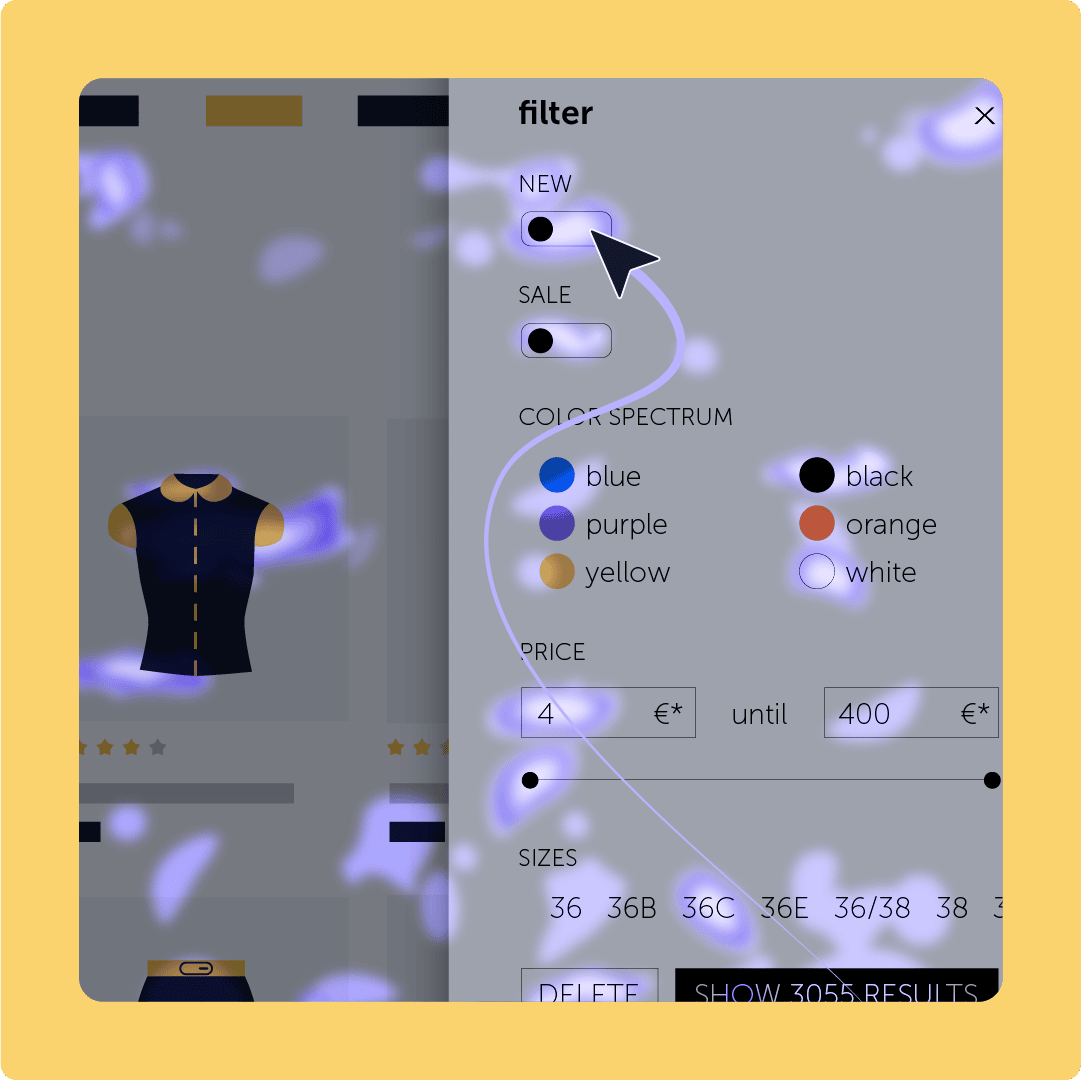
Interaction
See how users interact with menus, sliders, tabs – anything clickable. It’s insight beyond the basics.
Track dynamic UI behavior
Understand multi-layer clicks
Improve UX elements
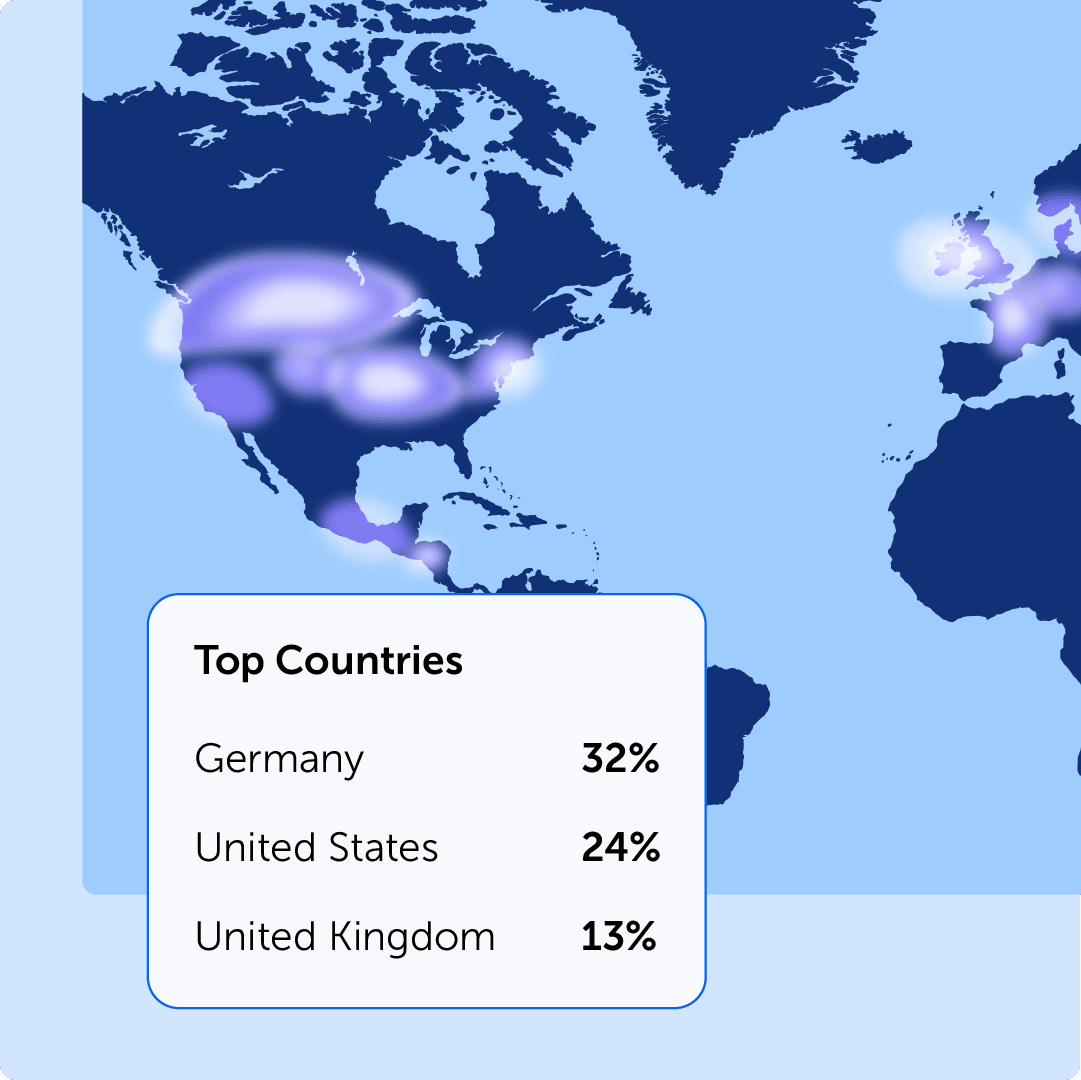
Geo
See where your users are in the world. Use it to localize content or sharpen ad targeting.
Map user locations
Target top regions
Align content to geography
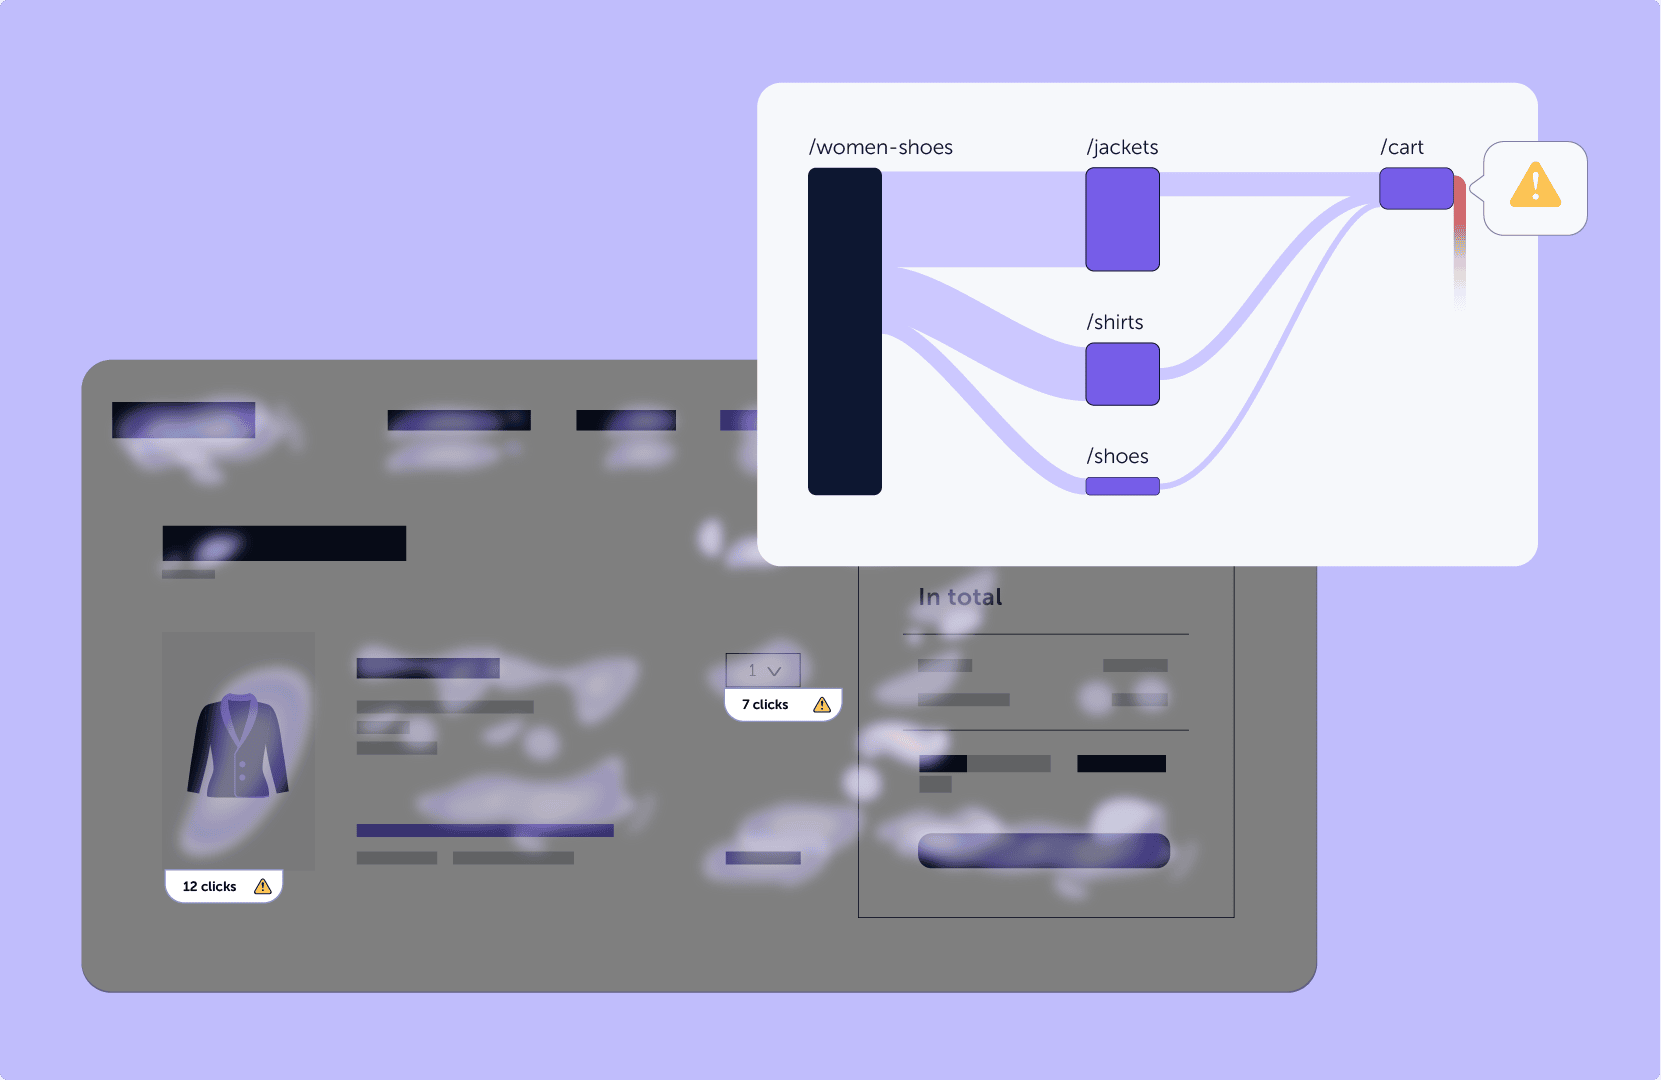
From Heatmaps to Journeys – All in One View
Don’t just analyze isolated clicks – combine our heatmap tools with our intuitive journey analytics to see how users actually move through your website. Track every scroll, rage click, and drop-off across the full experience. Our advanced heatmapping software helps you pinpoint where users struggle – and what to do about it.
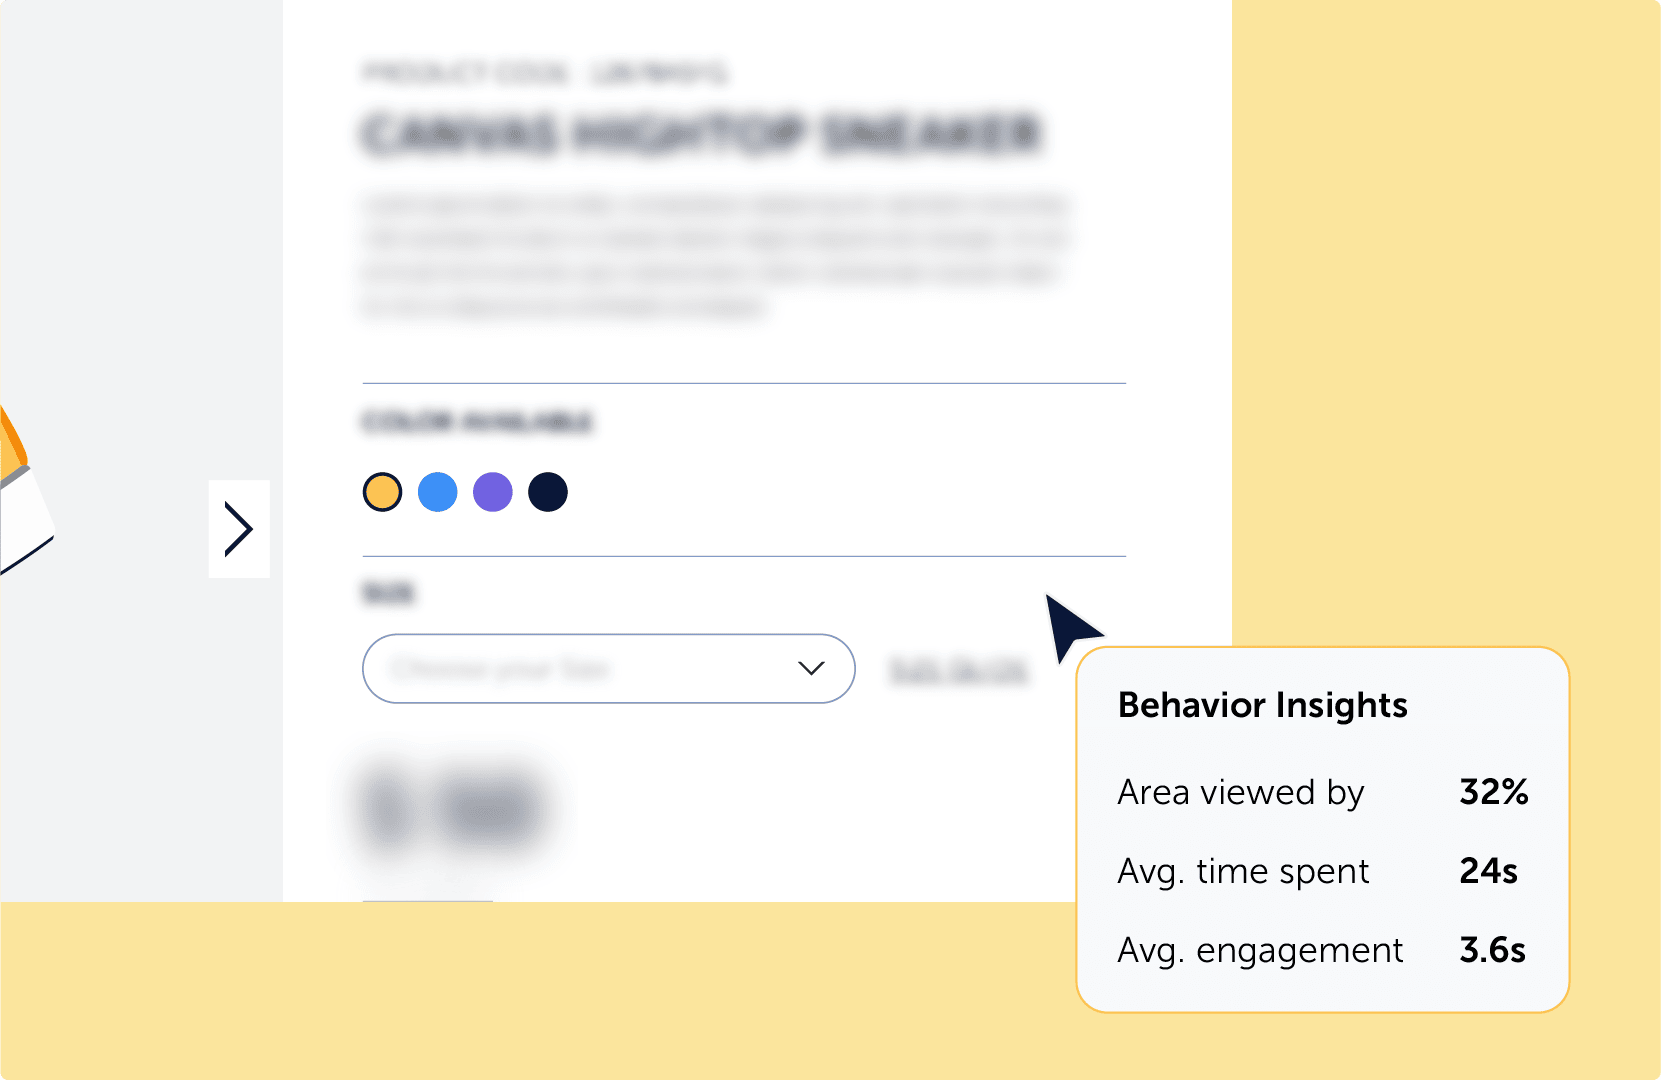
Make Every Pixel Count with UX Heatmap Analytics
Your landing page looks great – but are visitors really seeing what matters? With our heatmap software, you can track how far users scroll, where they stop, and what content gets ignored.
Whether it’s above the fold or deep down the page, our website heatmaps give you the clarity you need to design with purpose and optimize for engagement.
Pair that with Conversion Funnels, and you’ll finally connect behavior with results – not just pixels with guesses.
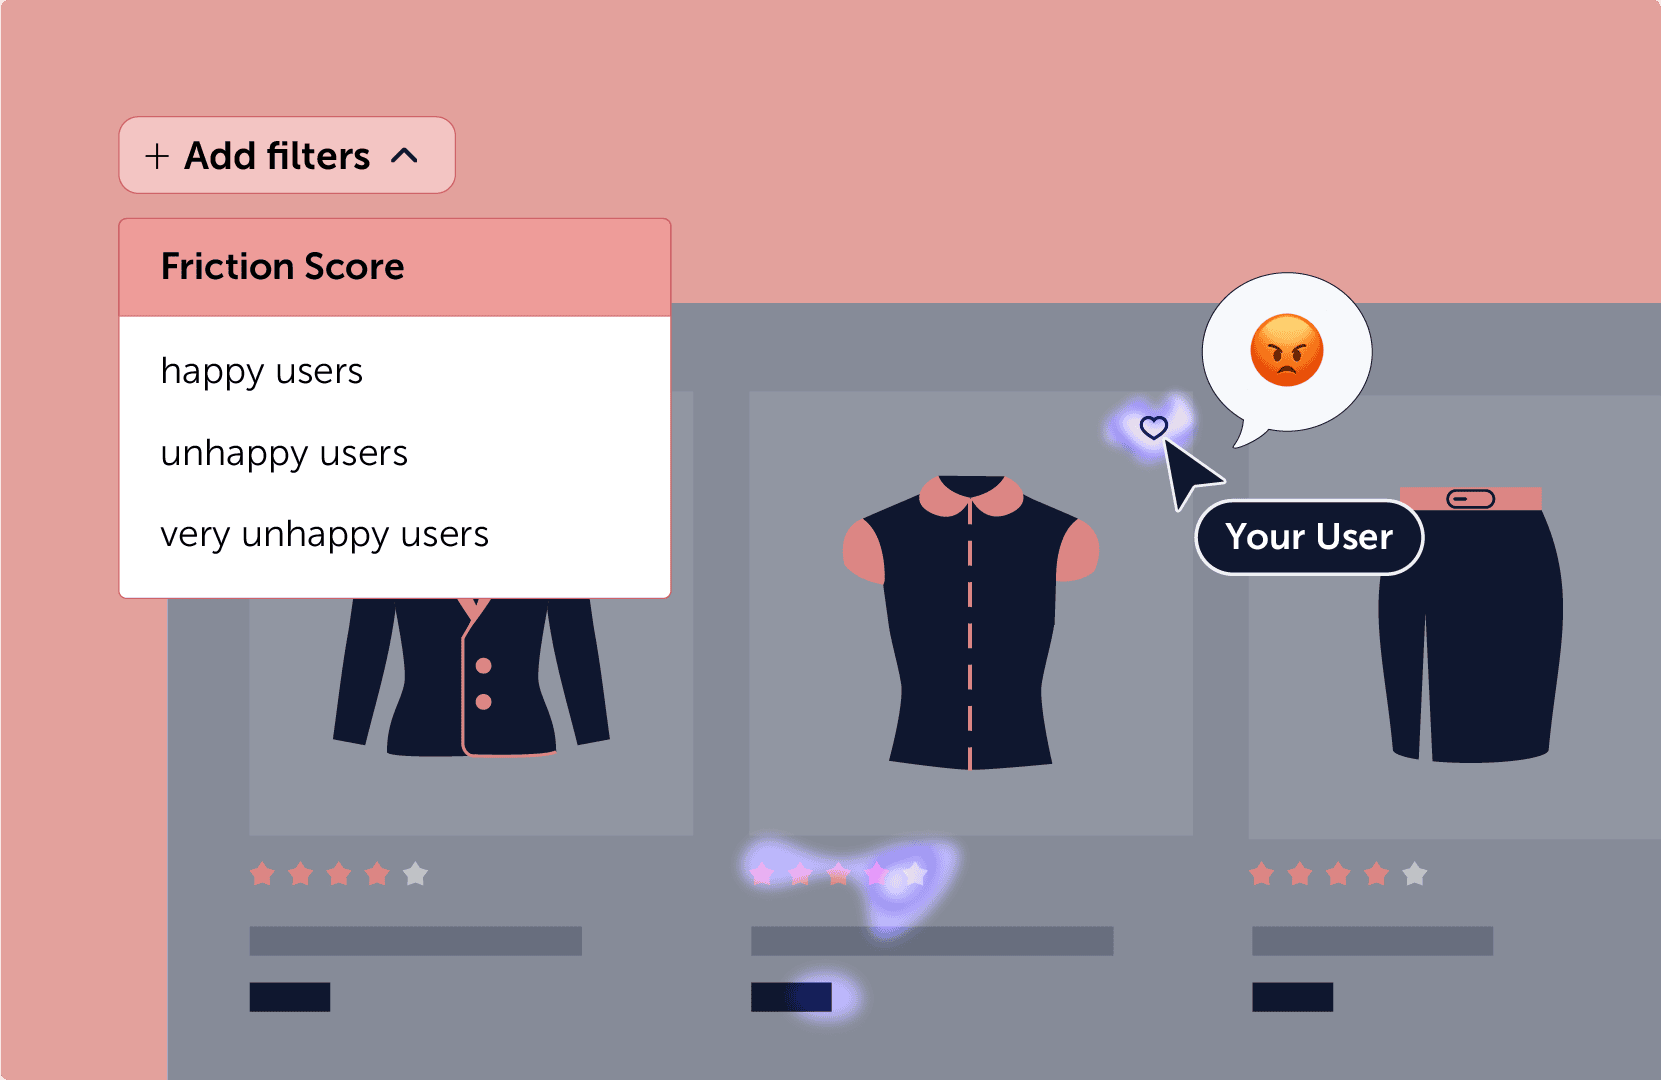
Find UX Issues Fast with Heatmap Analytics and Friction Detection
Thousands of sessions. Hundreds of pages. But where do you start?
Our heatmapping software automatically highlights where users rage-click, hesitate, or encounter errors – so you can skip the guesswork and fix what matters.
Our built-in friction detection finds unhappy users for you. Dive into the matching heatmaps to discover why — and turn frustration into conversion.

How Teams Use Mouseflow Heatmaps
For Marketing Teams
Find out what drives clicks, ignores CTAs, or tanks landing pages — then tweak, test, and track again.
For eCommerce Teams
Know where buyers drop, hesitate, or get stuck in checkout. Then smooth the path to conversion.

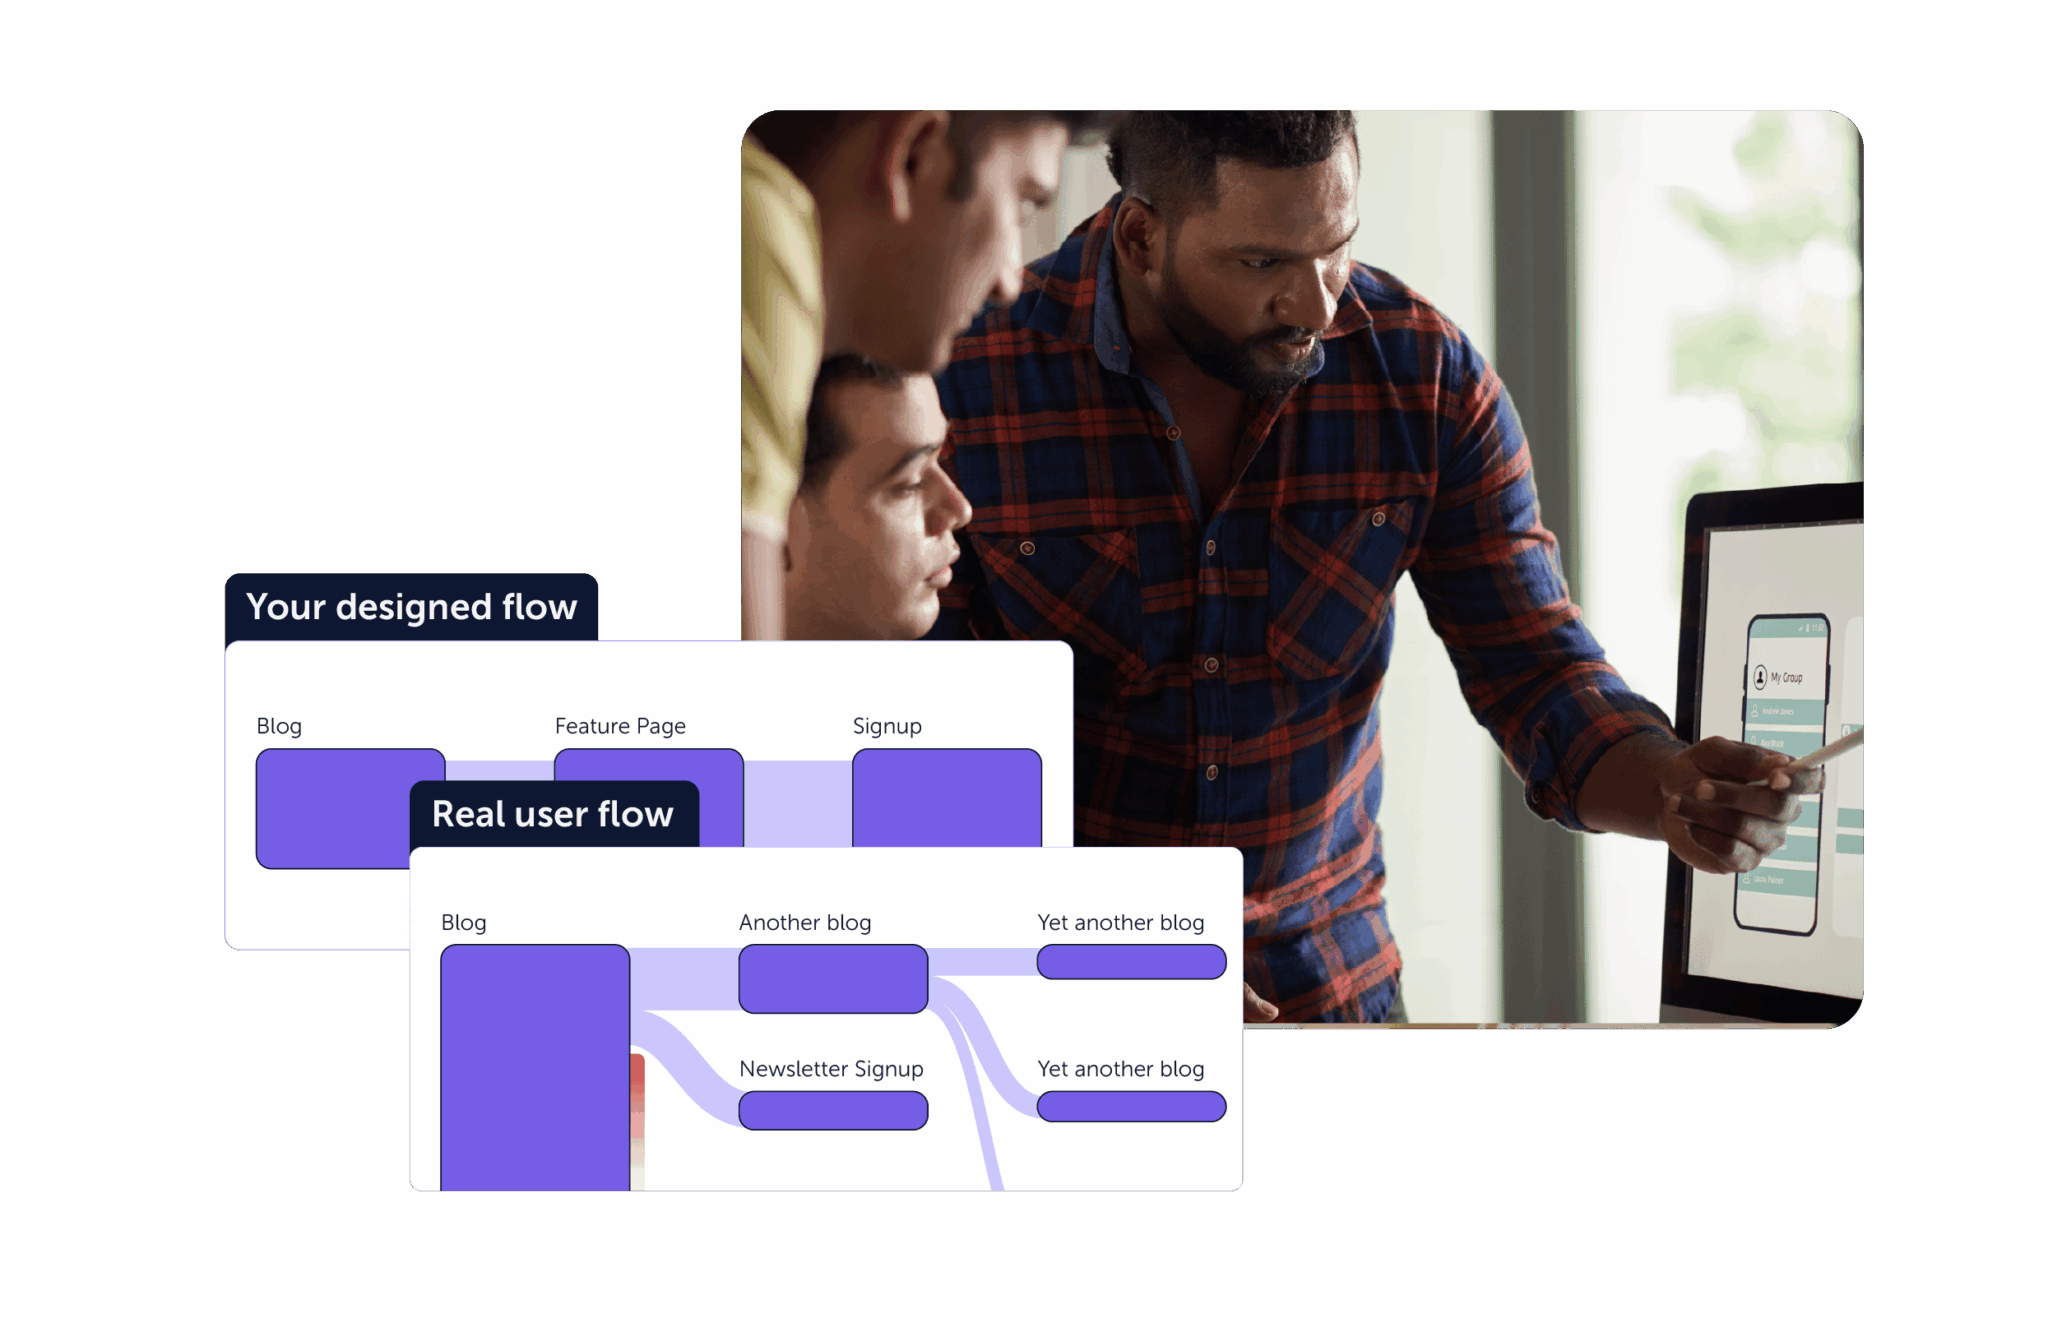
For UX Design Teams
See what users do vs. what you thought they’d do. Design with proof, not just pretty pixels.

For Product Teams
Validate feature usage. Catch dead zones. And spot hidden UX issues before users complain.
For CRO Teams
Back your experiments with real data. Heatmaps help prove what’s working and what’s not.


Common questions about Heatmaps
What is a Website Heatmap?
A website heatmap is primarily used by marketers, analysts, UX specialists, product specialists, conversion optimization specialists, and others focused on measuring and improving online user experiences. It visualizes user data — such as clicks, scrolls, movements, and more — as heat signatures. “Hot” spots represent high activity, while “cool” spots show low or no activity.
Website heatmap tools provide this data to enable teams to confidently identify areas of opportunity or challenge in their customers’ or users’ journeys. Using a website heatmap tool empowers optimizations to content, messaging, design, and more to deliver better experiences and business ROI from a website.
For a thorough explanation, check out guide to heatmaps.
How do I create a heatmap for my website?
Website heatmap tools work behind the scenes to anonymously track users on your websites — where they click, scroll, navigate, hover, etc. To create one for your website, simply sign up for Mouseflow, install the tracking code on your website in a couple clicks, click one more time to start recording, and voila — you’ll begin collecting website heatmap data.
Get started with our free website heatmap tool that scales as your business grows.
How are click, scroll, attention, movement, geo, and interactive website heatmaps used differently?
Click heatmaps tell you where on your web pages your users click with their mouse or trackpad, or their finger taps if on mobile. One way (of many) it’s useful is to help understand what users want to click in relation to what you intend for them to click, then rectifying the misalignment to improve conversions.
Scroll heatmaps look at how deep users scroll down the page. It’s useful in informing which content should be placed above the fold, for instance, to drive more purchases, sign-ups, clicks, etc.
Attention heatmaps combine click and scroll data to visualize high- and low-interaction sections of your site. If you’re trying to decide where to place a new CTA button, an attention heatmap can help you understand where it will get the most visibility and the highest likelihood of a click.
Movement heatmaps are similar to click heatmaps, except they track mouse position, not just its click point. So, it can help you understand where users may be searching for what they want, leading you to optimal placement.
Geo heatmaps are actually maps of Earth, not your web page. Geo heatmaps provide anonymized location data that gives insight into where your web visitors live geographically. One way to use this info is to better target regional PPC campaigns towards high-converting geographic audiences.
Interactive heatmaps provide an interactive way to visualize heatmap data, allowing Mouseflow users to engage with dynamic elements — menus, sliders, etc. — and understand their multi-layer click data.
For more information on heatmaps, check out our Heatmaps Guide.
How do website heatmaps increase conversions and drive online revenue?
Website heatmap software helps increase conversions, conversion rate, lead quality, and order value by visualizing how real users interact with your site.
Marketers use website heatmap tools to see which messaging, CTAs, and designs drive conversions, while analysts explore user behavior patterns and troubleshoot obstacles. Product managers and UX specialists rely on heatmaps to prioritize improvements, validate design hypotheses, and enhance user satisfaction. CRO experts use them to support test plans, attribute conversion lifts, and gain insights even on low-traffic sites.
Website heatmap software is also beloved by other teams: sales, web development, business intelligence, engineering, and more. Learn more about the advantages of using heatmaps.
Where does a website heatmap tool fit in with my other web analytics software?
A website heatmap tool like Mouseflow’s fits best when used in concert with other web analytics features, such as session recording, funnel analysis, form optimization, and user feedback. Mouseflow’s value can also be maximized by integrating it and using it in concert with web traffic analytics tools such as Google Analytics (we have an integration with GA4) or Adobe Analytics (we have an integration with Adobe Analytics too).
Whole other web analytics tools can tell you about traffic sources and performance, you need a website heatmap software like Mouseflow to truly understand users’ on-site behavior.
Luckily, Mouseflow boasts dozens of analytics integrations to make install, setup, and collaboration a breeze.