
Understanding how users interact with your site is key to improving UX, fixing leaks in your funnel, and growing conversions. Two of the most popular tools for this are Microsoft Clarity and Mouseflow.
Both offer session replays, heatmaps, and behavioral insights. One is free, the other is paid, with deeper, more advanced features.
So which one’s right for your team?
Let me break it down for you.
TL;DR: Mouseflow vs Microsoft Clarity
- Data ownership – With Mouseflow, you fully own your data. It’s stored securely and not shared. With Clarity, Microsoft can use your data to train their AI.
- Pricing – Clarity is completely free, with no traffic limits. Mouseflow is a paid tool, but you can start with a free trial where you get all the essential behavior analytics.
- Privacy & compliance – Both tools are compliant with major privacy laws like GDPR and CCPA. But with Mouseflow, you have more control over your data.
- Friction detection & form analytics – Mouseflow includes built-in friction scoring, form analytics, and feedback tools to help you identify where users are struggling. You can also add Friction Insights to your plan, which gives you access to a Friction Dashboard and Friction Heatmaps, offering a clear overview of where friction is happening across your website. Clarity doesn’t include these features.
- Funnels & journey mapping – Mouseflow lets you visualize how users move through your site with funnels and journey mapping. Journey mapping, however, is available on higher plans. Clarity has basic funnels but doesn’t support journey mapping.
- Native app support – Clarity supports native mobile apps and websites (like React or Native). Mouseflow focuses on websites only.
- Speed & performance – Mouseflow runs on one of the fastest tracking scripts out there, lightweight and performance-friendly. Clarity adds some overhead and affects load times on large sites.
- AI-powered insights – Clarity offers Microsoft Copilot, an AI assistant that can summarize session recordings and surface insights automatically. Mouseflow doesn’t have chat-style AI but does prioritize sessions based on friction to help you focus your analysis.
- Data retention – Mouseflow lets you keep session data for longer (based on your plan). Clarity only stores session data for 30 days (unless saved or favorited).
Finally, it’s important to mention that you can use both, for example some teams use Clarity for broad, ongoing monitoring (especially on high-traffic or secondary sites), and Mouseflow for deep-dive analysis where revenue and UX really matter.
Since Clarity is free, there’s no harm in running it to capture broad data even if you primarily rely on Mouseflow for heavy lifting (just ensure the added scripts don’t impact performance, which in both cases is minimal). Both Clarity and Mouseflow are continually evolving, Clarity is rapidly adding new features (funnels, AI, etc.) and Mouseflow is also innovating (journey analytics, integrations).
Quick Overview Comparison
Here’s a quick side-by-side look at how Mouseflow and Microsoft Clarity compare. From pricing and usability to heatmaps, session recordings, and advanced features, this overview helps you quickly spot which tool matches your team’s goals.
| Feature | Mouseflow | Microsoft Clarity |
|---|---|---|
| Session Recording | Unlimited, no sampling, easy to filter and full HD copy of HTML | Unlimited, basic filtering. |
| Heatmaps | Automatically generates 7 types of heatmaps: Click, Scroll, Attention, Movement, Interactive, Geo, Friction heatmaps. Side-by-side comparison. | Click, scroll, area heatmaps. Live view available via Chrome extension; supports SPAs to some extent. Side-by-side comparison. |
| Funnels & Journeys | Funnels are easy to set up, and you can visualize user journeys while grouping similar pages for a clearer overview. | Basic funnels, no journey mapping. |
| Friction Detection | Automatically captures 7+ friction events (Rage clicks, dead clicks, click errors, JavaScript errors, 404 errors, bounces, mouse out, speed browsing, custom friction), and generates a friction map. | Rage clicks, quick backs. |
| Form Analytics | Yes, built-in (errors, abandonments, hesitation). | No form analytics. |
| Feedback Campaigns | Unlimited responses, friction-triggered surveys. | No feedback tools. |
| Predictive Heatmaps | No AI predictions (human-driven insights). | Microsoft Copilot-powered predictions |
| Native App Support | Web only. | Supports React Native, etc. |
| Data Privacy & Ownership | You own your data, privacy-first. | Data shared for Microsoft AI training. |
| Performance Impact | Fastest script, minimal site impact. | Adds overhead, may slow down your site. |
| Pricing | Affordable, scalable | Free but you pay with your data. |
Feature-by-feature Comparison
Mouseflow and Microsoft Clarity both give you a window into how users behave on your site, but they’re built for different needs. Clarity is a great starting point for teams that want quick, easy access to behavior data without spending a dime, while Mouseflow goes deeper with advanced tools for conversion optimization, journey analysis, and friction detection.
Below, we’ll break down their key features side by side to help you figure out which one fits your team best.
Session Recordings (Session Replays)
| Feature | Mouseflow | Microsoft Clarity |
|---|---|---|
| Full resolution, HTML session video recordings | Yes | No |
| Recording all user sessions right out-of-the box, no further setup required | Yes, Non-stop | Yes, Non-stop |
| Recording all users, no sampling | Yes, but might stop recording once you’ve used your recording cap for the month. | Yes |
| Recordings instantly available for preview | Yes, you get recordings in real time. | No |
| Automatic friction event tracking | Yes, no need to set up. | Yes |
| Break down of the recording with time spent on each page | Yes | No |
| Can download session recordings | Yes | No |
Both Clarity and Mouseflow let you record actual user sessions on your site, so you can watch how users navigate, click, and scroll in a replay video. Microsoft Clarity offers unlimited session recordings for free with no sampling, meaning it records all users by default. This is great for getting a broad view of user behavior without worrying about hitting a cap.
Clarity’s recordings capture the HTML DOM and user interactions in near real-time. However, Clarity only retains recordings for 30 days (after which data is deleted), except a small sample and any ‘favorite’ recordings which can be kept for up to 13 months. There is also no built-in way to download the replay videos from Clarity’s interface (since it’s a cloud service).
Mouseflow’s session replay on the other hand, is part of a paid service that limits how many sessions you can record per month based on your plan (the free plan includes a small number of recordings, higher plans include more).
While not unlimited, Mouseflow’s recordings are highly detailed – it captures full-resolution HTML5 video replays of each session for high fidelity playback. Every mouse movement, click, scroll, and keystroke (except sensitive data) can be reviewed. All user sessions start recording automatically once you install Mouseflow without you having to do any setup.
With Mouseflow, you can see a full breakdown of each session, page by page, under what we call the ‘Waterfall’ view. It also shows useful details like time spent, friction score and interactions on each page, making it easy to spot patterns or understand what users are doing, even when they browse multiple pages at once. It also allows you to download session recordings if needed – a feature Clarity lacks.
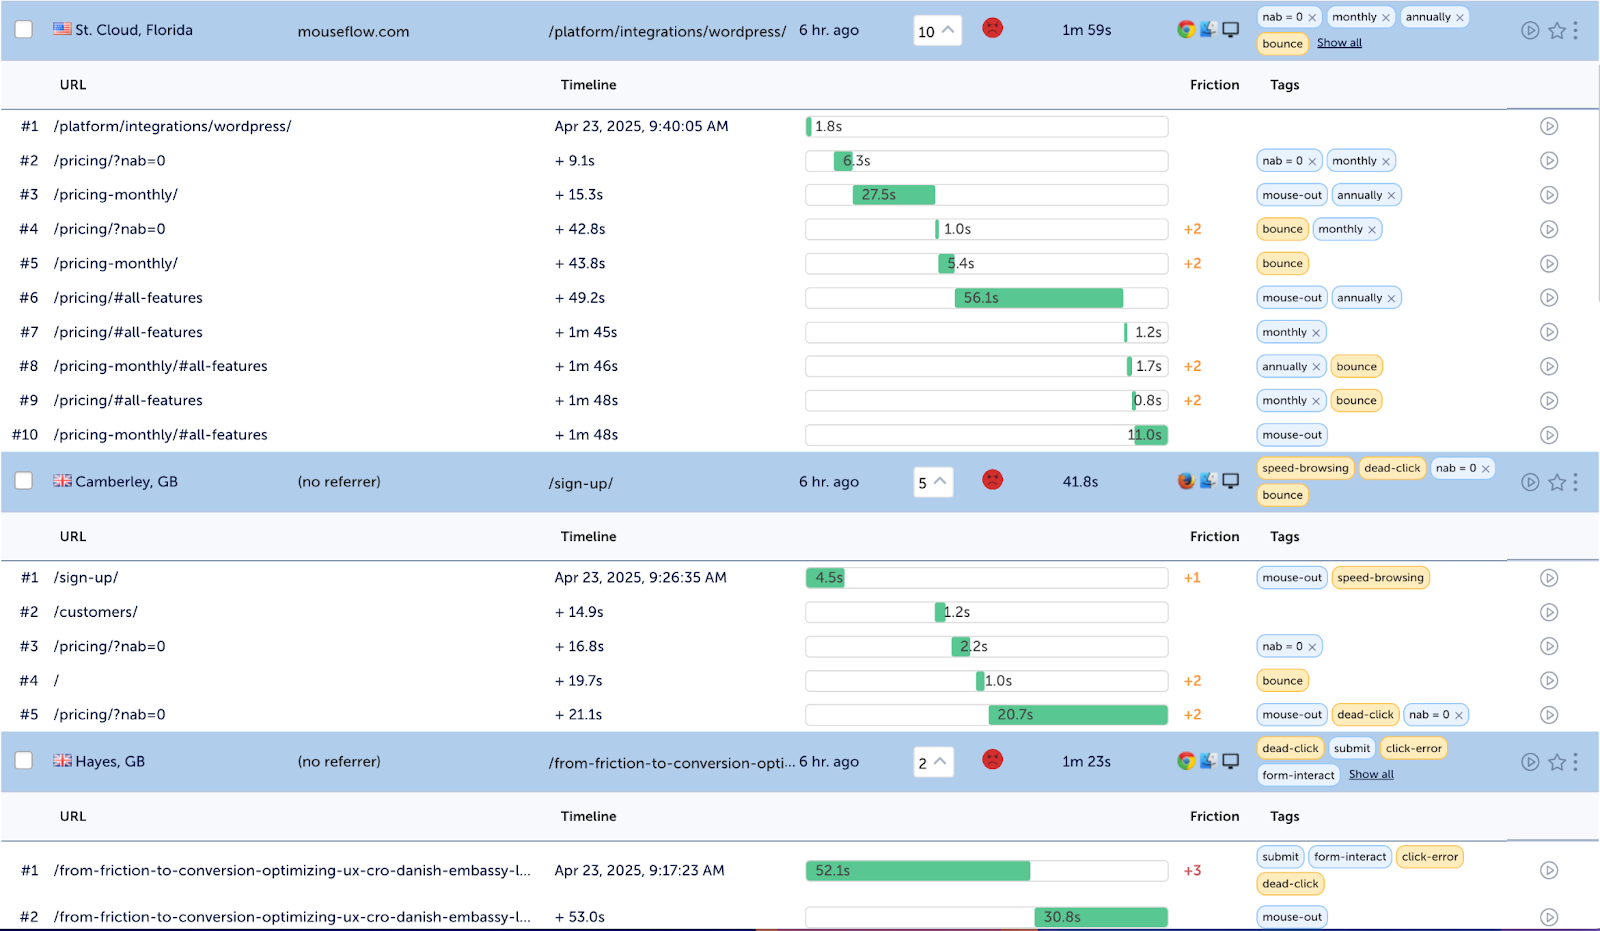
Mouseflow’s Waterfall View on Session Replay
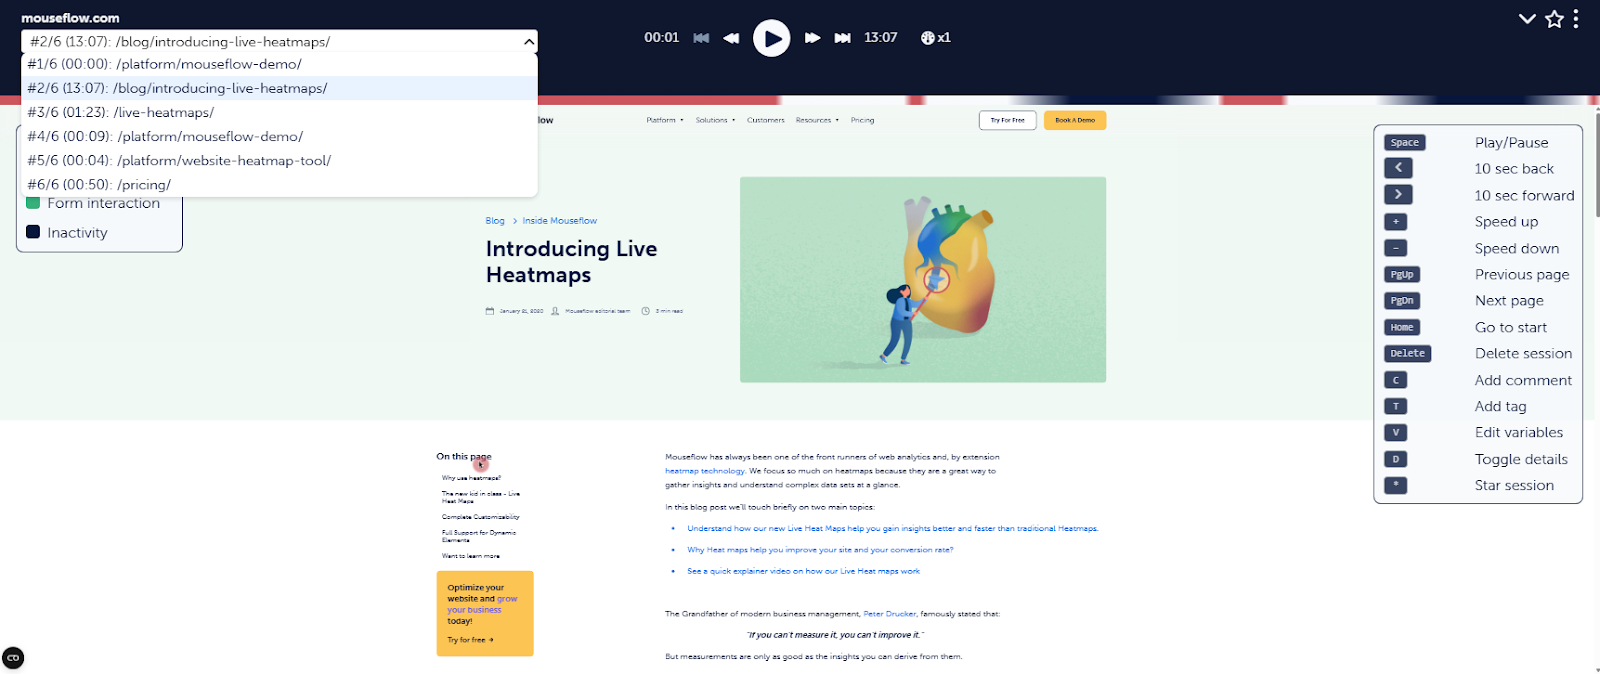
When you open a session in Mouseflow’s player, you’ll get a clear, step-by-step view of the user’s journey, what pages they visited, how long they stayed, and exactly what they did on each page. You can actually see where things go wrong, like where users hesitate, rage-click, or drop off. And if you want to share it with your team or save it for later, you can download the session too (something Clarity doesn’t offer).
One trade-off is that Mouseflow does not record every single visit if you exceed your session quota, whereas Clarity can handle very large traffic volumes for free (recording all sessions up to its retention period).
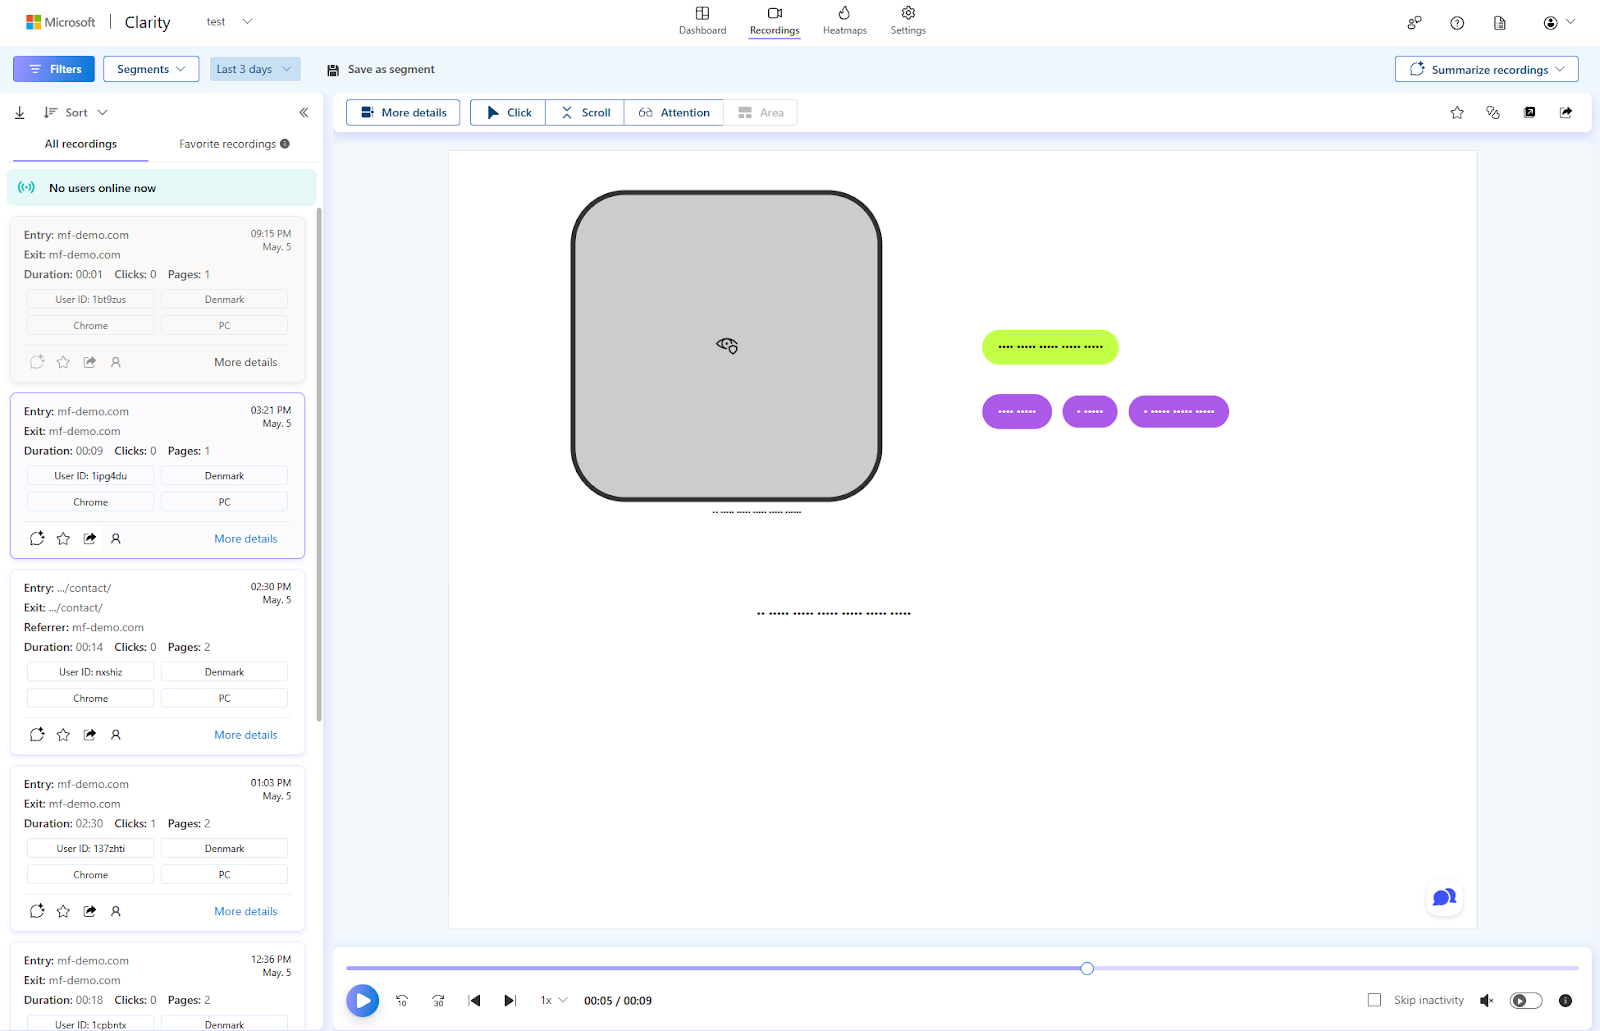
Mouseflow’s Session Replay Player
Mouseflow’s session recordings are a favorite for many professionals who are looking into user behavior analytics. It’s an indispensable tool to really understand how users behave on a site. The replay interface is super intuitive, so it’s easy to jump in and spot what’s working (and what’s not). Just keep in mind that depending on your plan, there might be limits on how many sessions you can record if your site gets a lot of traffic.
Heatmaps
| Mouseflow | Microsoft Clarity | |
|---|---|---|
| All pages, no setup required | Yes | No |
| Interactive heatmaps covering dynamic elements like SPAs, drop down menus, sliders and others | Yes | No |
| Geo heatmaps (user location heatmaps) | Yes | No |
| Advanced filtering (friction events, custom variables and more) | Yes | Yes |
| Date filtering | Yes | Yes |
| Click Heatmap | Yes | Yes |
| Scroll Heatmap | Yes | Yes |
| Movement Heatmap | Yes | No |
| Attention Heatmap | Yes | Yes |
| Compare Mode | Yes | Yes |
| Area Heatmap | No | Yes |
| Conversion Heatmap | No | Yes |
| Predictive Heatmap | No | Yes |
Next, let’s take a look at heatmaps. Both Microsoft Clarity and Mouseflow provide heatmaps. This helps you visualize aggregate user interaction data. Do your call-to-action buttons work? Are your visitors seeing the most important sections of your pages? How far do they scroll? Where do they click? What do they engage with and what don’t they engage with? Heatmaps help you answer these questions and more.
Microsoft Clarity offers 3 types of heatmaps out-of-the-box: Click/Tap Heatmaps, Scroll Heatmaps, and Area Heatmaps. Click heatmaps highlight the parts of a page on the desktop that receive the most clicks, tap heatmaps show you where users tapped on mobile and tablet, scroll heatmaps shows you how far down users scroll on average, and Clarity’s area heatmaps allow you to click on specific page elements and see how users interact with them. This is great for zeroing in on high-impact elements like CTA buttons, menus, or banners.
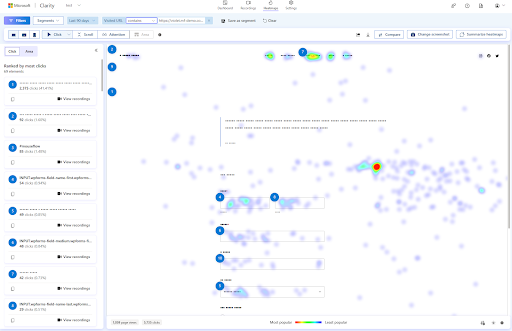
Clarity’s Click Map
Clarity automatically generates heatmaps for any page that receives traffic, with no extra setup once the tracking code is installed. It covers clicks, scrolls, and area heatmaps out of the box. While Clarity’s standard heatmaps are based on static page states, it does offer a live heatmap experience through its Chrome extension, which lets you interact with your site and see heatmap overlays directly on the page. That said, when it comes to tracking dynamic UI changes, like single-page apps or interactive menus, Mouseflow’s interactive heatmaps offer a more seamless built-in experience without needing an extension.
Clarity lacks a cursor movement heatmap, focusing only on clicks, taps and scrolls (plus the area overlay). However, Clarity recently introduced an AI-powered Predictive Heatmaps feature (see image below), which uses machine learning to predict where users are likely to click or pay attention on a page, even before you have real data. This is ideal for quick takeaways giving you a ‘glimpse into the future’ of how users might use a new layout. Predictive heatmaps are a cutting-edge addition unique to Clarity’s toolset (Mouseflow does not offer predictive heatmaps).
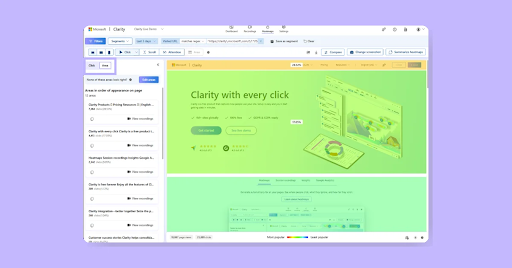
Clarity’s AI-powered Predictive Heatmaps
Lastly, Clarity also has a Conversion Heatmap. This shows how different audience segments (converters vs. non-converters) engage with your page, helpful for spotting behavioral differences between those who take action and those who don’t. However, to unlock this feature, you’ll need to set up and configure custom purchase events first. It’s not available out of the box and requires a bit of extra implementation to work properly.
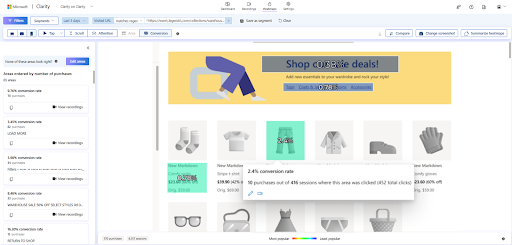
Clarity’s Conversion Heatmap
Now Mouseflow provides a wide variety of heatmaps – 7 in total: Click, Scroll, Movement (hover), Attention, Geo, Interactive heatmaps and Friction Map.
Both Mouseflow and Clarity offer side-by-side heatmap comparison. Mouseflow supports more heatmap types in comparison mode, including Attention, Movement, and Geo, giving teams more behavioral dimensions to work with.
In Mouseflow, Movement heatmaps track where users move or hover their cursor, which can indicate attention even if they don’t click. This is also crucial for you to find what elements are distracting your visitors from completing the action you want them to do.
Attention heatmaps combine scroll depth and time spent to show which sections of a page hold users’ attention the longest (a proxy for engagement) – which can really guide content creators on where to put the most important information.
Geographical (geo) heatmaps (see image below) show you their engagement by location, like which parts of a world map users from different regions click, or a map overlay if relevant – a feature Clarity doesn’t offer.
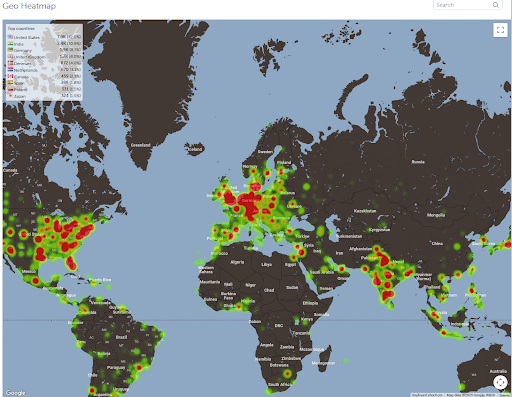
Mouseflow’s Geo Heatmap
The Geo Heatmap is a great tool for spotting where your most engaged visitors are coming from, whether that’s certain countries, cities, or regions. It helps you quickly see which areas are driving the most interest, so you can dig deeper into those audiences and run more targeted, location-based campaigns that actually speak to them.
For example, let’s say you’re running a SaaS lead generation campaign. After a few weeks, you check Mouseflow’s Geo Heatmap and spot a surprising cluster of highly engaged users from Houston, Texas, they’re spending time on your pricing and demo pages but not converting.
Having this insight, you can now tailor a regional campaign just for them, maybe create a localized landing page or a special webinar invite for businesses in the Houston area. Instead of guessing where to focus your next move, you’re letting actual user behavior guide your strategy.
Mouseflow’s Interactive heatmaps (also called Live or Dynamic heatmaps) let you track user behavior on dynamic elements, like dropdowns, sliders, menus, or single-page apps, in real time. Unlike traditional heatmaps, they don’t rely on static page loads, so you get a much more accurate view of how users actually interact with your site, especially when content updates dynamically.
To make it simple, you can find a quick comparison table below that shows how Interactive heatmaps stack up against Static Heatmaps, and when each might be the right fit.
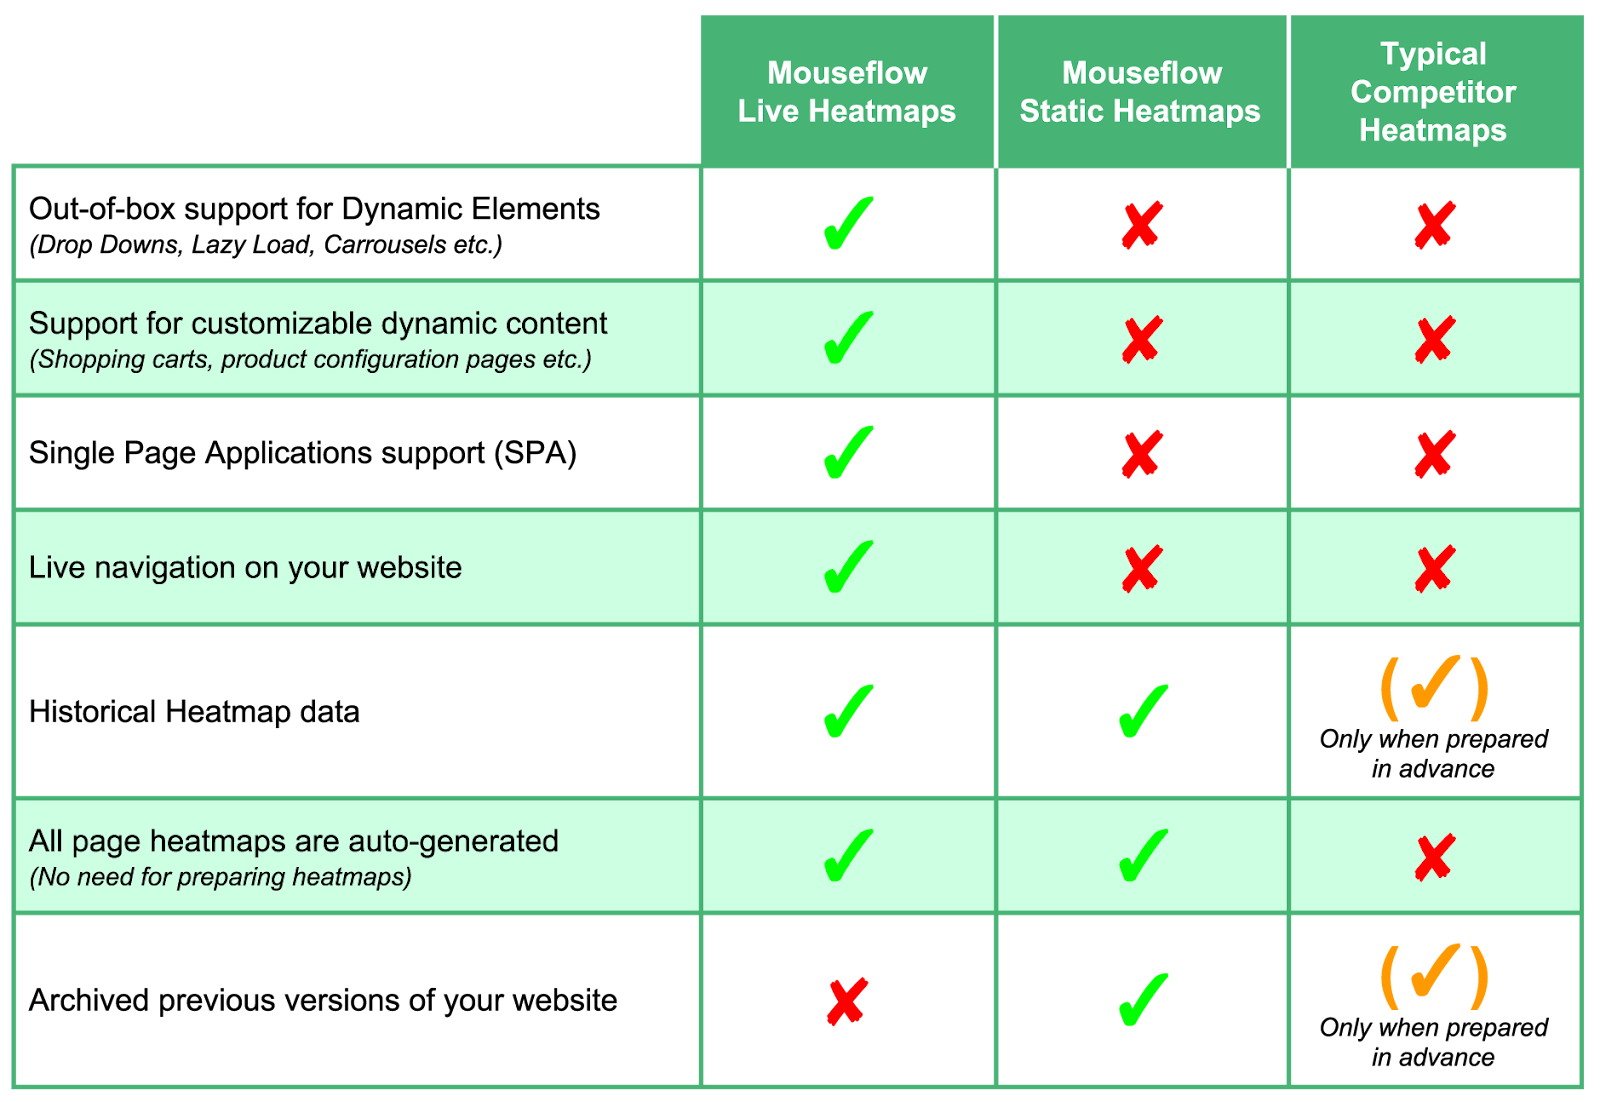
Comparison between Interactive (live) vs. Static Heatmaps
Lastly, Mouseflow just released a Friction Map, which shows you a map of all friction events happening on a single page. You can filter by the total friction, or go deeper and look closely on elements that cause either click rage, dead-clicks or click errors.
Mouseflow’s Friction Map Example
Both tools allow basic filtering of heatmap data by date range, device type, etc., but Mouseflow supports more advanced filtering and segmentation on heatmaps – for example, you can filter heatmaps to show only sessions with certain ‘friction events’ or users that end up on 404 pages or only a specific segment of users. Clarity’s filtering on heatmaps is more limited but it does let you filter by date, device, and some user attributes in the dashboard.
Mouseflow’s heatmaps are very advanced and suited for detailed analysis, answering questions like ‘how far do users scroll and where do they spend the most time?’ on each page. Clarity’s heatmaps cover the fundamentals quite well for a free tool – you get a solid sense of click hotspots and scroll reach without any extra cost or effort, which is great for quick insights on content placement and CTA visibility.
If you need to compare heatmaps across different segments or time periods, Mouseflow has a ‘compare mode’ and historical data retention, whereas Clarity might require you to look at separate time ranges manually (Clarity lacks a built-in compare mode feature).
For UX designers and marketers, Clarity’s simple heatmaps can immediately highlight, for example, that users never scroll to the bottom of a page or that a non-clickable element is drawing clicks. Mouseflow’s heatmaps, on the other hand, are ideal for conversion specialists who want to dig into nuanced behaviors – like whether users who ultimately convert engage with page content differently than those who bounce (Mouseflow even lets you filter heatmaps by conversion outcomes if you set up funnels or tags).
If you want to learn more about heatmaps, check out our blog, How to Interpret a Heatmap. It covers all the different types of website heatmaps and shows you how to use them to improve your website.
Form Analytics and Conversion Funnels
| Mouseflow | Microsoft Clarity | |
|---|---|---|
| Ready out of the box after setup | Yes | No |
| Populating forms with previously collected data | Yes | No |
| Funnels | Yes | Yes |
| Populating forms with previously collected data | Yes | No |
| Filtering (devices, locations, referrer URL and more) | Yes | No |
| Filtering (UTM tags, custom variable) | Yes | Yes |
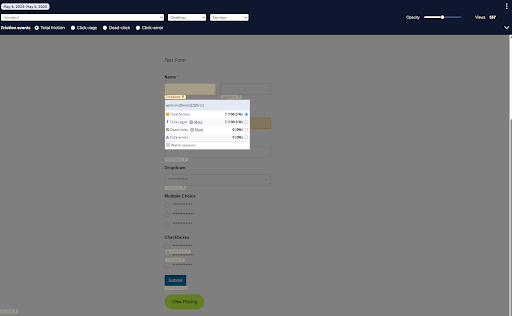
One area where Mouseflow sets itself apart is form analytics. Mouseflow includes a dedicated form analytics tool that tracks how users interact with forms on your site – measuring metrics like which form fields cause users to drop off, which fields they refill or correct frequently, time spent on each field, blank submissions, and error rates. This helps pinpoint usability issues in checkout forms, lead generation forms, sign-up forms, etc.
For example, you might discover that a particular field (like ‘Phone Number’ or ‘Billing City’) has a high drop-off rate, indicating it’s causing frustration. Mouseflow provides reports on form abandonment (drop-offs) – how many users start a form versus how many complete it – and even ties it back to session replays so you can watch recordings of users who abandoned the form.
Mouseflow’s form analytics view showing high drop off in the Billing ‘City’ field
All of this is extremely valuable for conversion rate optimization (CRO), since even minor form updates can increase your conversions. Clarity does not have native form analytics, it cannot automatically tell you which field in a form lost the most users or how long users take to fill each field. You could still infer some of this by watching session recordings or seeing if users rage-click on a form, but there’s no summary or report in Clarity for forms. In short, for form optimization, Mouseflow is the clear winner with its comprehensive analytics on form performance (Hotjar and some other tools lack this too, but Mouseflow offers it).
Both tools now offer conversion funnel analytics, but with different levels of sophistication. Microsoft Clarity added funnels in mid-2024, allowing you to define a sequence of steps (page views or custom ‘smart events’) that lead to a goal, and then visualize what percentage of sessions make it through each step.
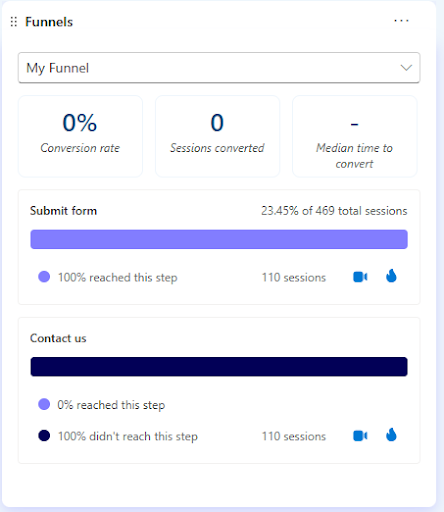
Microsoft Clarity’s Conversion Funnel
For example, you can set up a funnel for an e-commerce checkout:
Step 1 = Product Page view
Step 2 = Add to Cart
Step 3 = Checkout Page
Step 4 = Purchase Confirmation
Clarity’s funnel report will show the conversion rate through each step, where users drop off, and even lets you click on a step to view the heatmaps or session recordings of users who reached that step. This is incredibly useful to quickly jump from a quantitative funnel metric to qualitative insight (watching why users left at a certain step).
However, Clarity’s funnel feature is fairly basic in that it requires you to set up the funnel in advance (it cannot populate funnel data retroactively from before the funnel was created), and it doesn’t allow very granular filtering of funnel results by different segments (other than using Clarity’s general filters separately). It covers the essentials but lacks some advanced options.
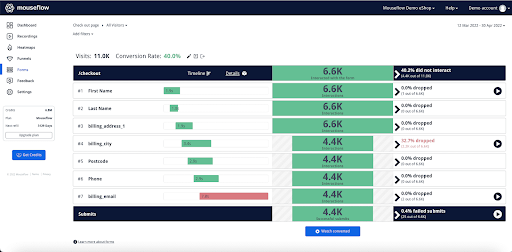
Mouseflow’s conversion funnel analytics is more mature. Since Mouseflow records all pageviews and form submissions by default (up to your plan’s limits), you can create or modify funnels and often populate them with historical data.
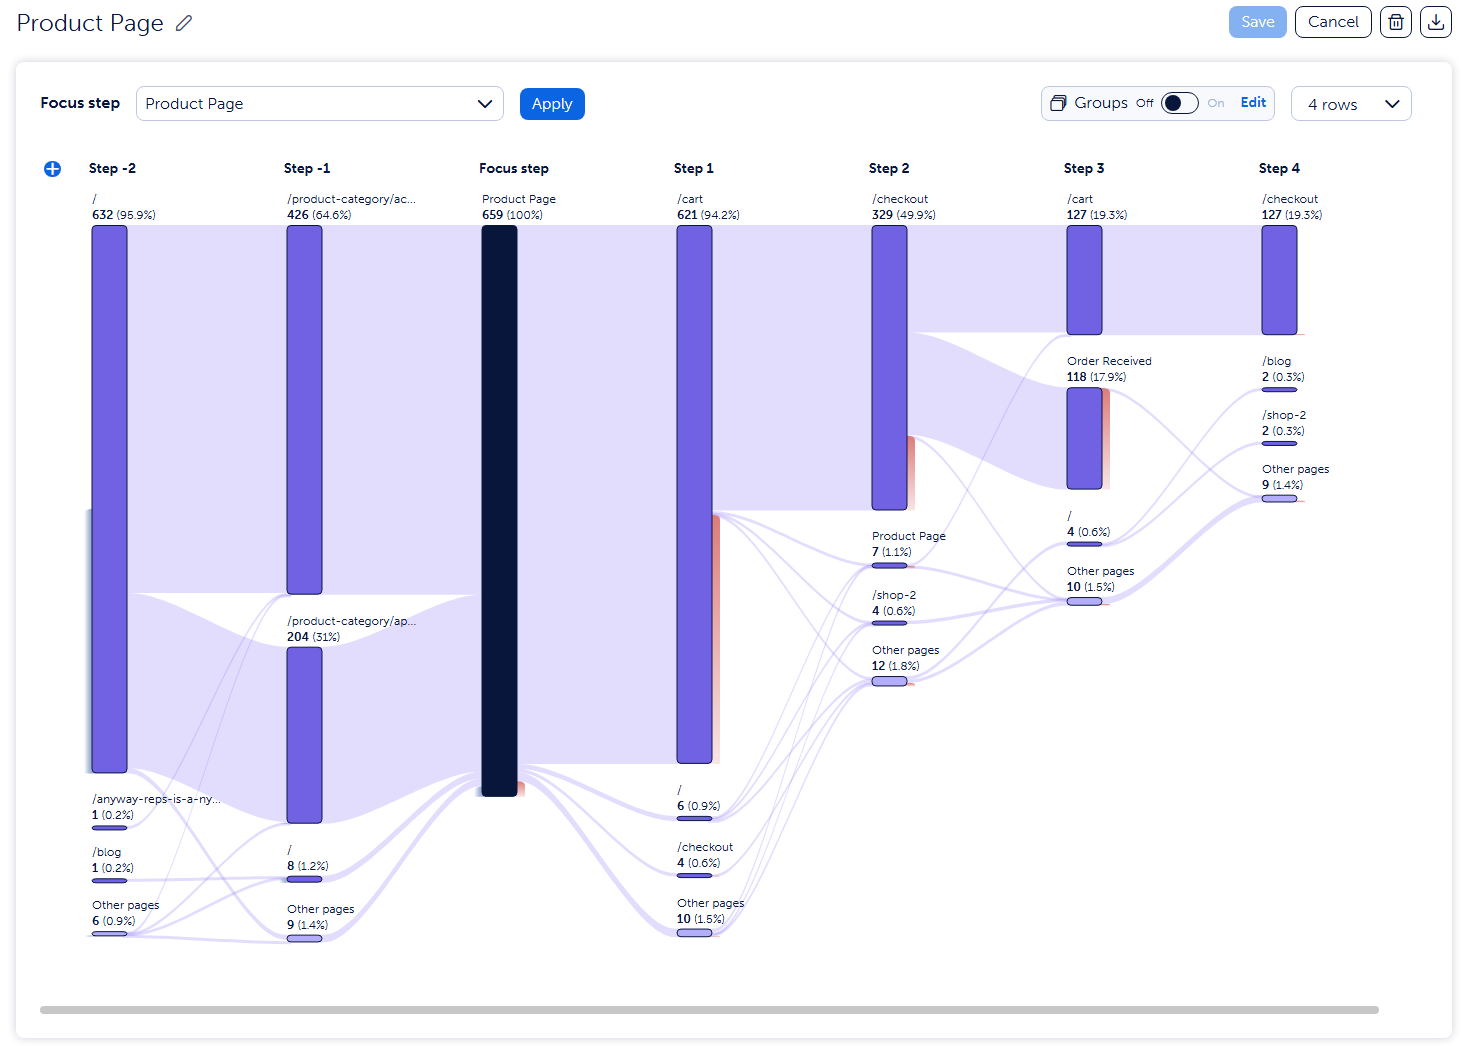
Mouseflow’s Conversion Funnel
Mouseflow funnels help you track multi-step conversion paths much like Clarity, but with the added benefit of deeper filtering. For instance, you can filter a funnel to see how it differs for mobile vs desktop users, or by traffic source (UTM parameters), something Clarity’s interface doesn’t directly support in funnel reports.
Mouseflow also integrates funnels with its other features: you can segment recordings or heatmaps by funnel completion, and vice versa. One unique advantage is Mouseflow’s ability to pre-fill funnels with previously collected data – you don’t lose past insights if you forgot to set up a funnel ahead of time.
The funnel visualization in Mouseflow is often presented as part of its new journey analytics (more on that shortly), giving a Sankey-style view of drop-offs. Overall, Mouseflow’s funnels are powerful for conversion optimization pros, while Clarity’s new funnels are a welcome addition for basic analysis of user flows on a budget.
From a use case perspective, if you are a small business or team just starting to analyze user flows, Clarity funnels provide an easy, no-cost way to spot major drop-off points in your site’s key journeys – you can then click through to recordings to diagnose issues. This can significantly help identify, for example, that many users drop off on the shipping page of your checkout, which may prompt a UX fix.
For larger scale CRO efforts or more complex funnels (multiple segments, retroactive analysis), Mouseflow gives more flexibility. A conversion specialist or product manager in an e-commerce company might rely on Mouseflow’s funnel and form analytics to fine-tune each stage of the purchase flow.
In summary: Clarity covers the funnel basics (simple conversion stats and the ability to inspect those steps in detail via replay/heatmap), whereas Mouseflow delivers a full conversion analytics suite – ready out of the box with form drop-off tracking and easily adjustable funnels for in-depth optimization.
User Feedback and Surveys
| Mouseflow | Microsoft Clarity | |
|---|---|---|
| Feedback surveys | Yes | No |
| Triggering feedback surveys on friction events | Yes | No |
| NPS, Multiple choice, Free text and rating scale question formats | Yes | No |
| Performance dashboard | Yes | No |
| Watch recordings from respondent | Yes | No |
Talking to your users is one of the most valuable ways to add depth to your data, especially when you’re trying to understand why something is happening. While Microsoft Clarity doesn’t offer built-in feedback surveys, Mouseflow does.
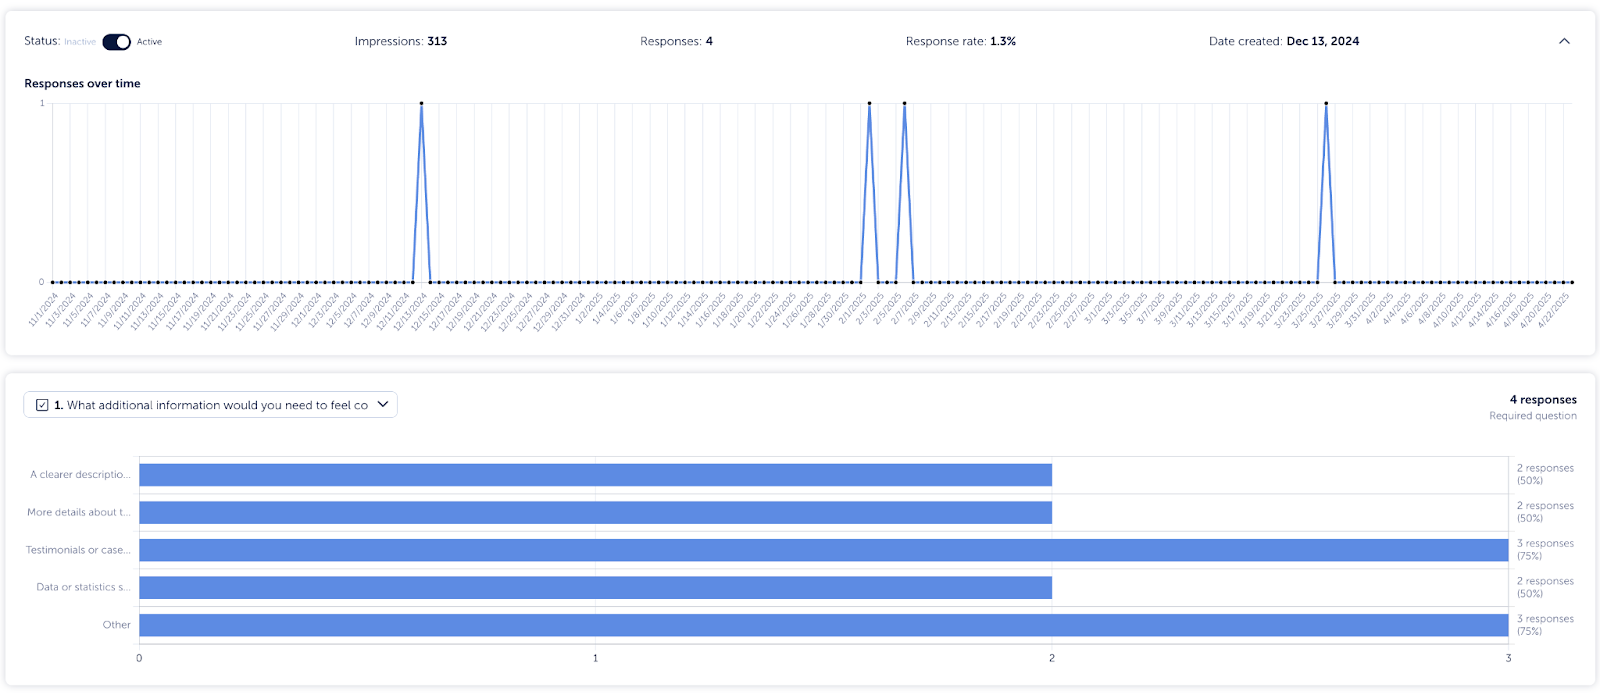
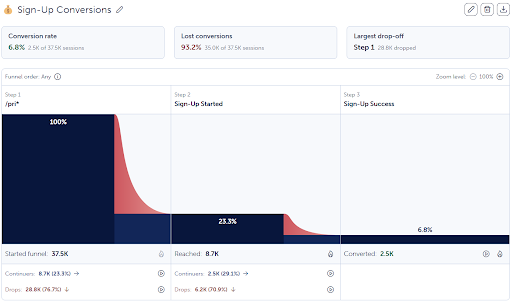
Mouseflow’s Feedback Survey feature
With Mouseflow, you can easily gather qualitative insights alongside your quantitative data. You can ask users Net Promoter Score (NPS) questions, multiple choice, open-ended (free text), and rating scale questions, all directly within the platform. The built-in reporting helps you quickly analyze the responses to spot patterns and take action.
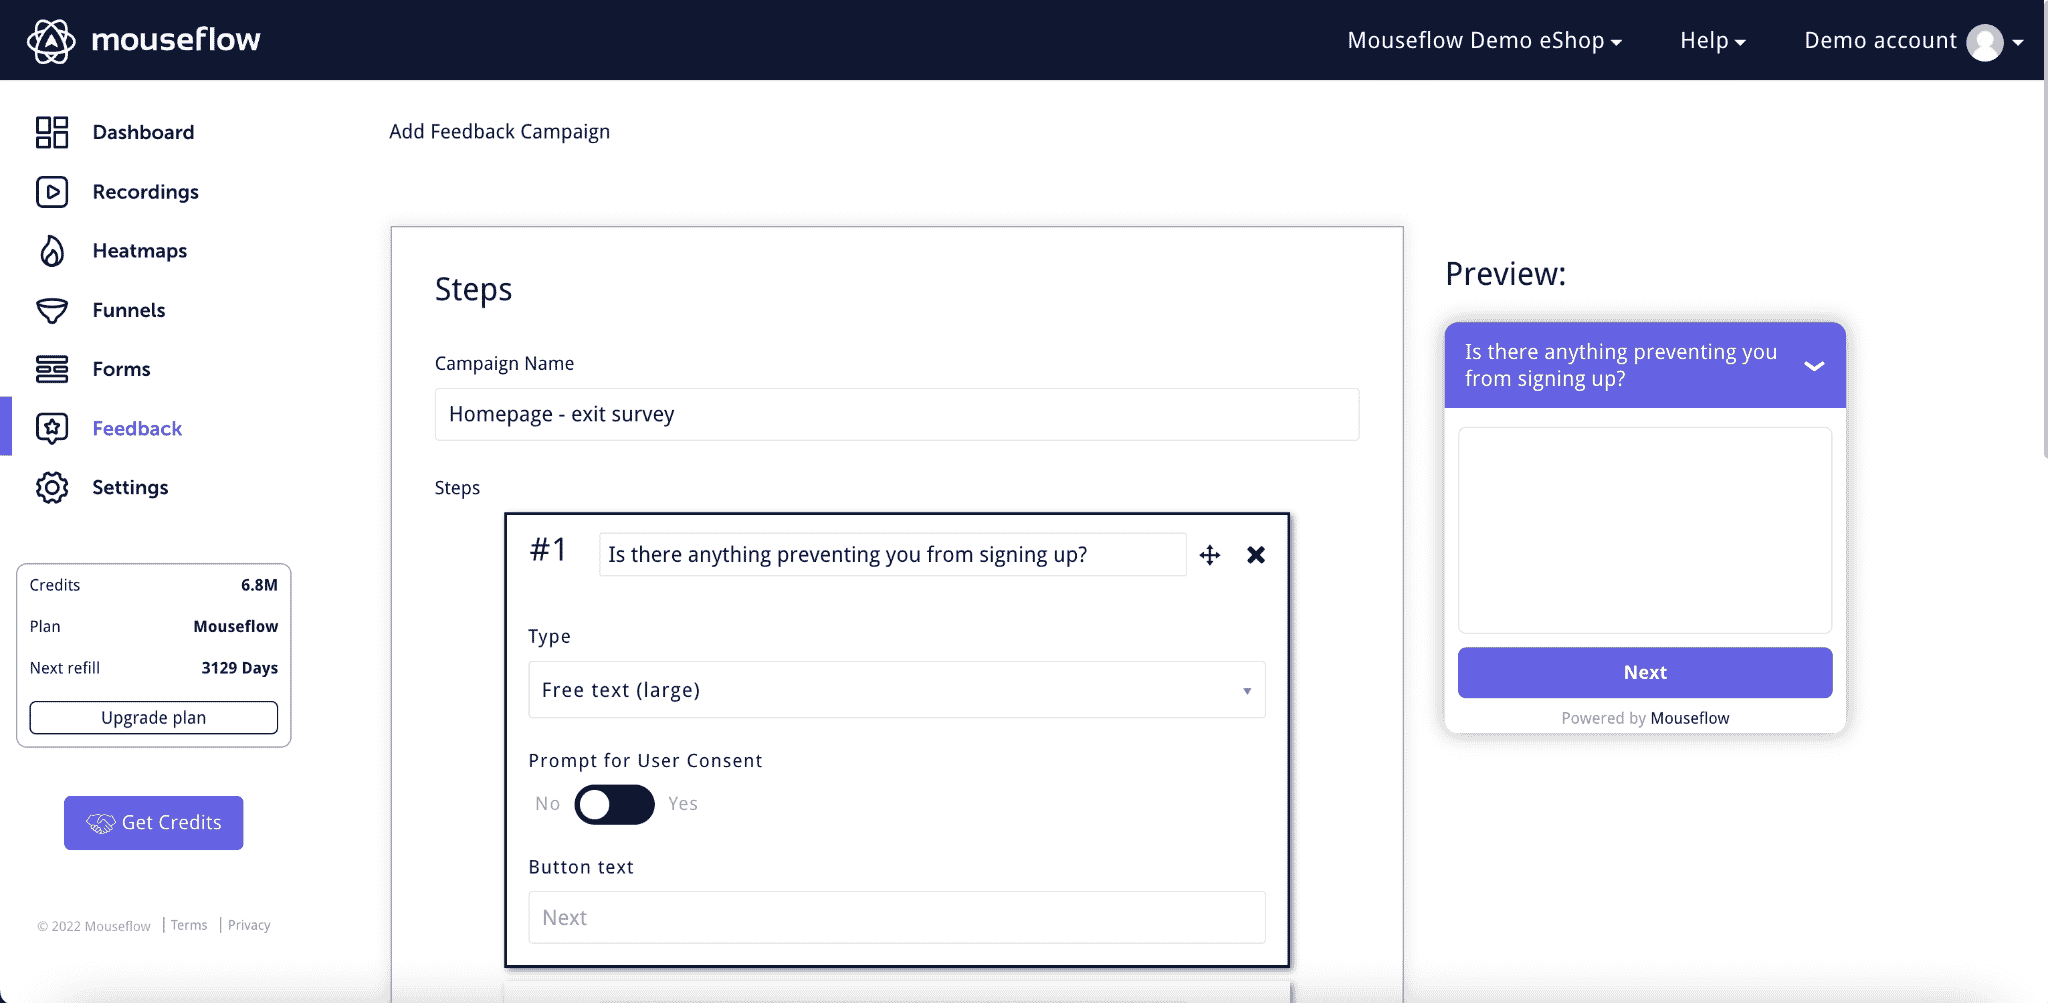
Mouseflow feedback campaign builder
You can even trigger these surveys exactly when it matters most. For instance, you can automatically show a survey when someone rage clicks, hits a JavaScript error, or abandons a form, capturing their thoughts in the moment, before they bounce. You can even trigger a survey after a successful form submission to ask what made them convert.
This is all built-in, fully customizable, and included in your plan, no third-party tools needed.
User Journey Mapping
| Mouseflow | Microsoft Clarity | |
|---|---|---|
| Sankey diagrams of your users’ journey | Yes | No |
| Visualize how they get to a focus page and where they go next | Yes | No |
| Grouping of similar pages | Yes | No |
One of Mouseflow’s newest strengths is the User Journey Analytics. Mouseflow provides a visual journey analytics tool that maps out the paths users take through your site in a flow diagram. This allows you to visualize how users navigate between pages and where they go next from a given page.
For example, you can pick a key page (like a product page or your homepage) and see what percentage of users came to that page from various other pages, and where they went after (to checkout, to other content, or dropped off).
Example of Mouseflow’s User Journey Mapping
Mouseflow’s journey tool can chart up to 10 steps in a user’s path, letting you identify unexpected routes or drop-off points in complex workflows. It also supports grouping similar pages (like grouping all blog pages or all product pages together) for a higher-level view, which is useful if your site has many pages and you want to see category-level patterns.
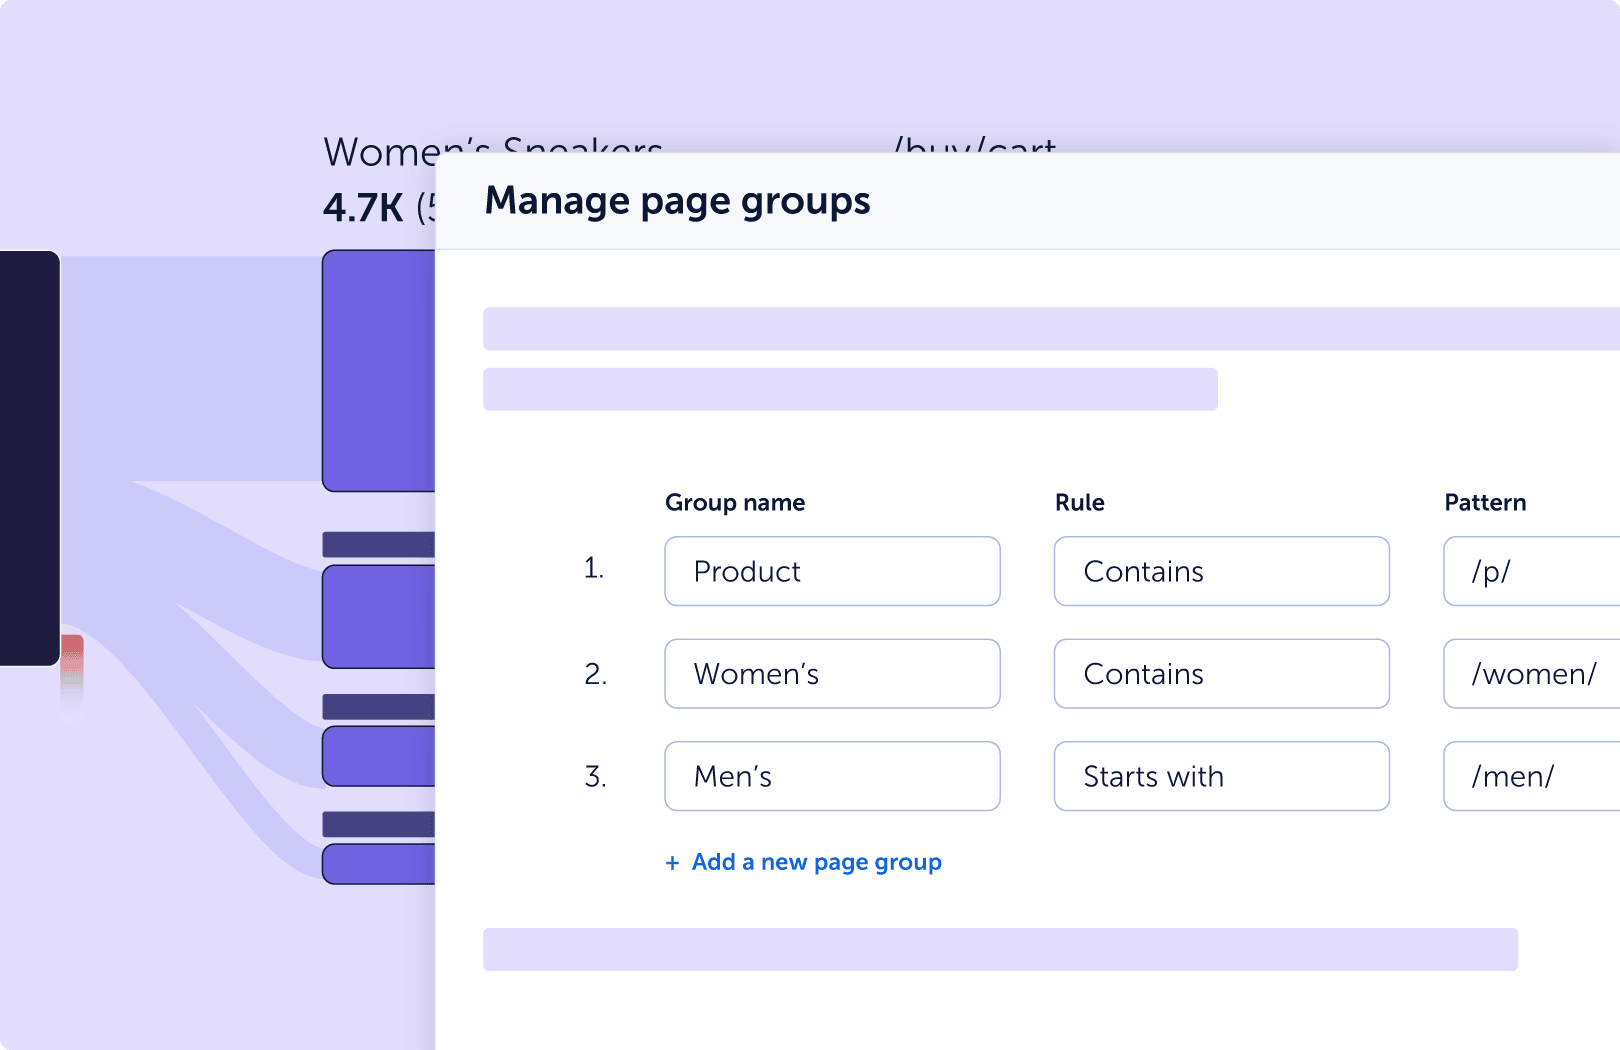
Example of grouping similar pages in Mouseflow’s Journey
Essentially, it’s a way to get a big-picture funnel of the entire site or specific segments, beyond the linear funnels you define manually. This kind of customer journey visualization is something Microsoft Clarity does not yet offer – Clarity has a basic ‘user paths’ feature that shows the sequence of pages a user went through in a session, but it’s more of a per-session path and not an aggregated flow analysis with Sankey diagrams.
So, for product managers and UX teams interested in mapping out common user flows through the site or finding popular vs. failing paths, Mouseflow provides a clear advantage.
Friction Detection
| Mouseflow | Microsoft Clarity | |
|---|---|---|
| Friction Insights | Yes | Yes |
| Friction Score | Yes | Not available |
| Click Rage | Yes | Yes |
| Click Rage | Yes | Yes |
| Dead Clicks | Yes | Yes |
| Click Errors (JavaScript Errors) | Yes | Yes |
| Bounce (Quickbacks) | Yes | Yes |
| Speed-browsing (Excessive Scrolling | Yes | Yes |
| 404 Errors | Yes | No |
| Custom Friction | Yes | No |
Both Clarity and Mouseflow help identify points of user frustration or ‘friction’ – but again, Mouseflow goes a step further.
Microsoft Clarity automatically detects several types of what it calls ‘smart events’ or insights: for instance, Rage Clicks (when a user rapidly clicks an element multiple times out of frustration), Dead Clicks (clicks on something that doesn’t respond), and Excessive Scrolling (scrolling quickly or very far, possibly indicating they’re searching for something). Clarity will flag these in the dashboard, showing counts of how many sessions each issue had, and you can filter to see those sessions.
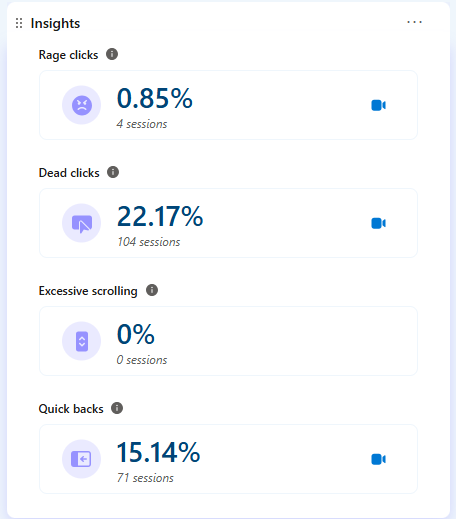
Microsoft Clarity’s Friction Events
Mouseflow similarly detects these signals – in fact, both tools cover rage clicks, dead clicks, rapid scroll (‘speed-browsing’), and even JavaScript errors or 404 error hits. Where Mouseflow stands out is its ‘Friction Score’ feature: Mouseflow not only logs individual friction events, it also computes a proprietary Friction Score per session (and page) which quantifies the level of user frustration based on 7+ types of events.
So if a particular session had multiple rage clicks, form errors, and a quick bounce, it will get a high friction score. This helps you prioritize session replays – Mouseflow can rank recordings by highest friction, so you immediately know which recordings likely show users struggling the most. It’s a very handy AI-like aid for large volumes of data: instead of watching 100 random replays, you can focus on the 10 with the worst friction scores.
Clarity does not provide a combined score or ranking, it surfaces the events individually (you can see ‘x sessions had rage clicks’ but not an overall frustration metric). Mouseflow also has ‘Friction Insights’ dashboards and maps that aggregate where on a page these issues occur.
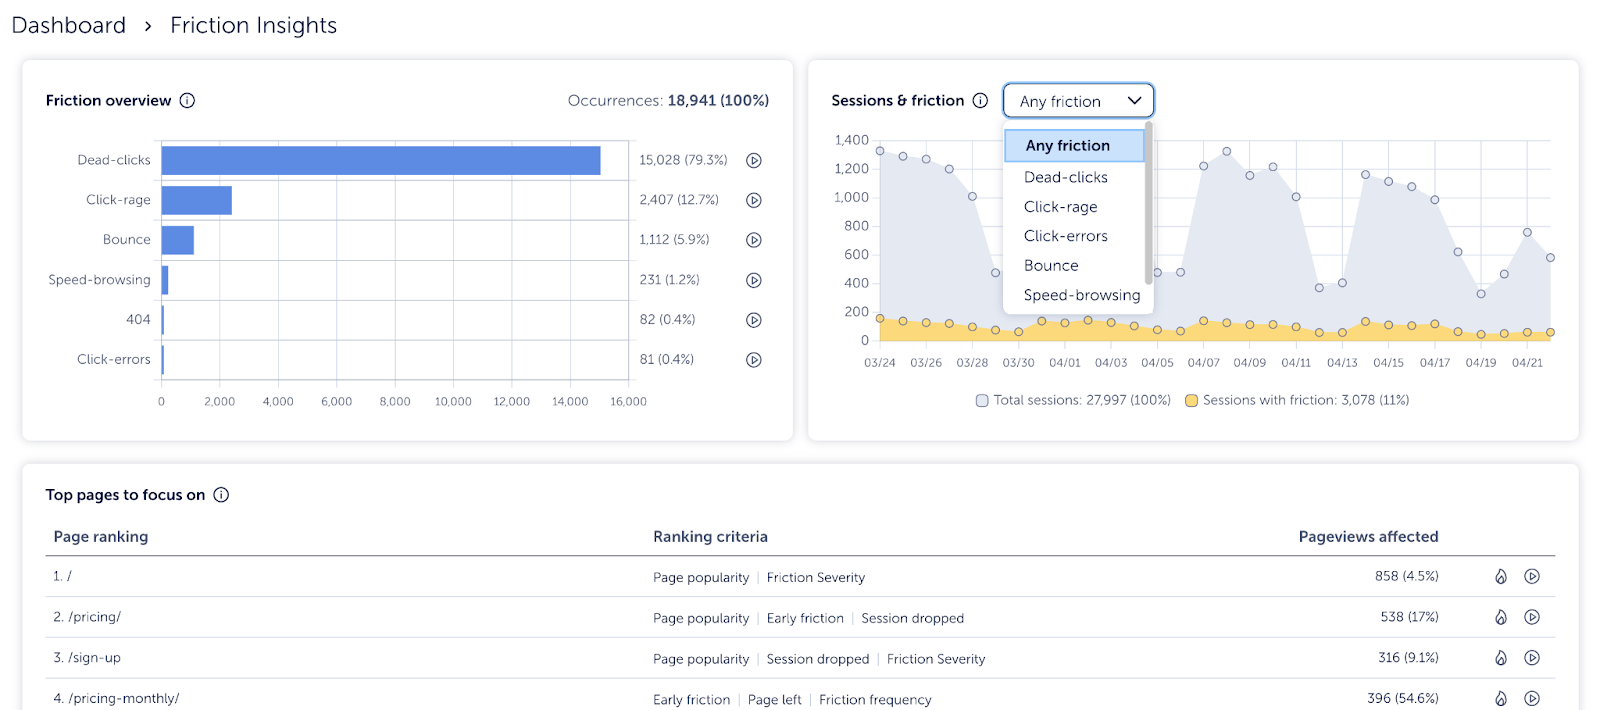
Mouseflow’s Friction Insights Dashboard
With the Friction insights dashboard, you’d get an overview of your users’ friction. You’ll get:
- Top Pages to Focus On – Pages where improving UX will drive the biggest results.
- Pages with Most Click Friction – Breaks down friction by page to help you target
specific problem areas. - Elements with Most Click Friction – Zero in on which buttons, links, or interactive
elements frustrate users most. - Top Click Errors – See which JavaScript errors are hurting your experience—and how often they’re triggered.
- Friction Overview – A high-level view of all friction types across your site.
- Sessions & Friction Over Time – Track how user frustration changes and spot
emerging issues. - Broken Links and 404s – Track down broken internal links and 404s so you can fix them quickly.
- Page Performance – Identify slow-loading pages that could frustrate users.
In short, both tools give you awareness of UX problems (both will tell you if users are clicking angrily on non-responsive elements, for example), but Mouseflow automates the prioritization of those problems via the friction score and the friction dashboard. Clarity users might need to manually go through the insights or use the new AI Copilot to summarize them.
The ideal use case for Mouseflow’s friction features is when you have a lot of traffic and need to zero in on the worst pain points automatically – its Friction Score will ‘highlight high-friction user experiences in real time’ so you can fix issues faster. Meanwhile, an SMB or small team using Clarity can still catch major UX problems via Clarity’s simple rage click and dead click indicators (for example, Clarity might reveal that many users try clicking an image carousel that isn’t actually interactive – a sign you should link it or make it clearer).
AI features: Copilot vs. Smart Automation
Clarity has leaned into AI with features like Clarity Copilot, which can summarize session recordings for you and answer questions like ‘Which page had the most rage clicks this week?’ It’s like having a built-in analyst who helps you spot issues without digging through data yourself.
Mouseflow doesn’t have an AI chatbot, but it uses smart algorithms to flag issues automatically. Things like friction scores, JavaScript error alerts, and conversion drop notifications help you focus on what needs attention. Instead of giving you plain-language summaries, it surfaces high-impact insights in the dashboard, so you can dive in.
If you want a more hands-off, AI-assisted experience, Clarity is great. If you prefer working directly with smart metrics and custom alerts, Mouseflow gives you more control. Both options are built to save you time and work out of the box, no coding required.
The Real Cost of 'Free' (Why Data Ownership Matters)
Clarity being free sounds great, and for some teams, it might be enough to get going.
But here is the thing: Free is not really free when your data is being used to train outside AI models.
If you work with sensitive customer data, run an ecommerce business, or depend on behavior insights to guide product decisions, owning your data and staying privacy compliant is not a nice-to-have. It is a must.
Microsoft Clarity being free comes with a trade-off: your data is stored in Microsoft’s cloud and may be used to improve their AI systems. While Clarity is GDPR-compliant and transparent about masking sensitive info, you don’t fully own the data. Also, data retention is capped at 30 days, and there’s no option to extend that or export full session content in bulk.
Mouseflow, on the other hand, follows a paid SaaS model where you remain the data owner. You sign a Data Processing Agreement (DPA), choose where your data is stored (EU or US), and control what’s recorded and how long it’s kept. Mouseflow also offers advanced privacy controls, like masking sensitive fields, IP anonymization, and compliance tools for GDPR, HIPAA, and CCPA.
So if your team handles sensitive data, needs long-term storage, or simply wants tighter control, Mouseflow offers more flexibility and assurance.
Which Tool is Best For Your Team?
Choose Microsoft clarity if you:
- Want a completely free tool with unlimited session recordings and heatmaps
- Are just getting started with behavior analytics and want simple insights fast
- Prefer AI-generated summaries and predictive heatmaps to speed up analysis
- Are okay with data being stored in Microsoft’s cloud and used for model training
- Run a high-traffic site and need broad, cost-effective monitoring
- Work across both websites and native mobile apps
Choose Mouseflow if you:
- Need deeper insights like form analytics, journey mapping, and friction detection
- Want to understand why users drop off, not just where
- Work in ecommerce, SaaS, CRO, UX, or lead gen, where small UX wins mean big business impact as it tracks full checkout flows, identifies form drop-offs, and highlights friction like hesitation or rage clicks.
- Require advanced filtering, user segmentation, and full control over your data
- Care about privacy compliance (GDPR, HIPAA, CCPA) and data residency options
- Want to run on-site feedback surveys triggered by user frustration (rage clicks, inactivity, etc.)
- Prefer full HTML session replays with download and friction-prioritized viewing