
Social networks don’t want users to ever leave, so driving traffic from them to your website becomes costlier pretty much every day. Google doesn’t want people to go anywhere from the search engine pages either – which results in the same outcome: higher costs per click (CPC) and more time spent on bid adjustment.
In fact, I’ve run more than 1,000 ads this year and I’ve found that the more you keep your target natively engaged on the platforms, the better the campaigns will perform. Tip: Nurture them natively in the awareness and consideration stages of the funnel and only drive traffic away from the nurtured audience (retargeting) in the decision stage.
Still, for eCommerce businesses – and especially for direct-to-consumer (DTC) brands – pay-per-click (PPC) social and paid search are both worthy traffic sources.
Because of the nature of the products these businesses sell, it is more likely that a cold audience will visit your website. In this case, your retargeting game must be strong to make sure those website visits decrease in price when you acquire a new customer.
There’s another problem, though: Getting traffic is one thing, but converting this traffic is a completely different problem. It’s very easy to end up in the “high traffic, low conversion” situation, and the lack of conversion rate optimization on your website is not always to blame.
There are many things you might want to try changing to improve your PPC campaigns. In this article, we’ll talk about PPC campaign traffic optimization tactics that people often forget while digging too deep into bidding optimization and spending countless hours on bidding strategy.
Using these tactics helped us and many of our clients improve conversion rates, increase revenue, and get the most out of the PPC ad budget. We believe they can help you as well.
6 Campaign Traffic Optimization Tactics (That Our Head of Growth Swears By)
1. Establish Metrics for Quality Traffic
You probably already know firsthand that not all traffic is equally good. Some campaigns bring people that convert better and have a higher average order value (AOV) or deal size, while others bring traffic that doesn’t convert at all.
Sometimes, it’s fine that they didn’t convert if they at least engaged with the website. Maybe they were not ready to buy yet, but they’ll come back next time if you use retargeting. That’s still quality traffic, especially if you’re selling something unconventional. But conversion rate would not be a good metric for this kind of traffic.
So, before diving head-first into building your PPC optimization strategy, stopping some PPC campaigns, and starting new ones, make sure you have a set of metrics to measure the traffic quality. And no, that’s not just CPC.
Good Traffic Quality Metrics:
- Conversion rate. Yes, you still need it, but that’s not enough.
- Return on ad spend (ROAS). That’s the amount of revenue you get from spending a certain amount of money on a campaign. ROAS tells you if your PPC advertising campaign is actually bringing you money rather than wasting resources.
- Engagement time. That’s the amount of time the user actively engages with your site. This is a good metric to track if you care about those users that are not ready to buy. If an ad campaign brings traffic with high engagement time, it means that they at least were interested in what you have to offer and that you can retarget them later.
- Scroll depth. This metric is good for longer pages. If the scroll depth is high, it means that the visitors that a campaign brought are actively exploring the page. If not, it means that the landing page didn’t really interest them.
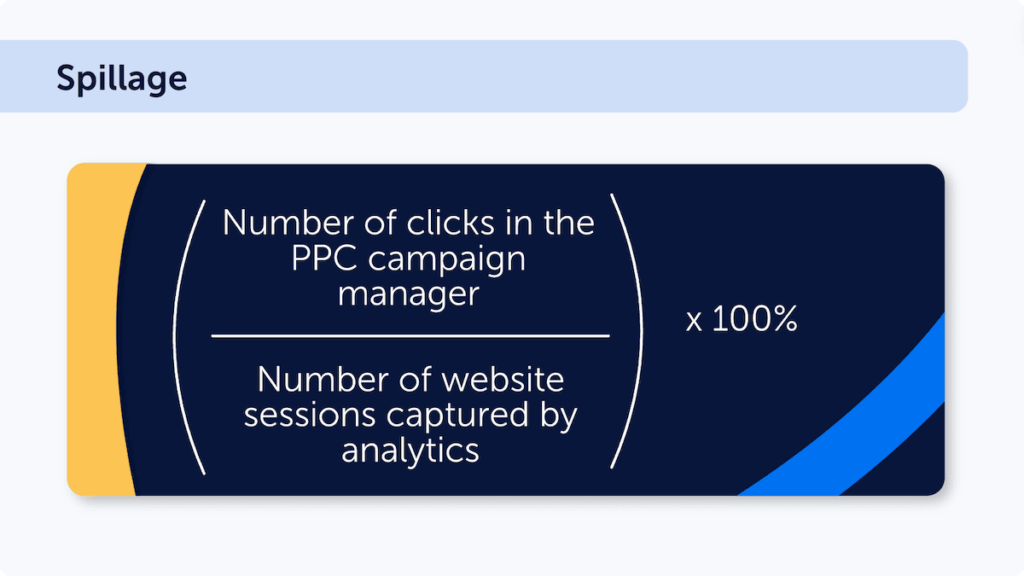
- Spillage. Now this might sound weird, but this is a metric I cooked up to understand the ratio between the clicks I am sold by my PPC campaigns, and the amount of people that actually land on the website and remain long enough to be recorded with Mouseflow.
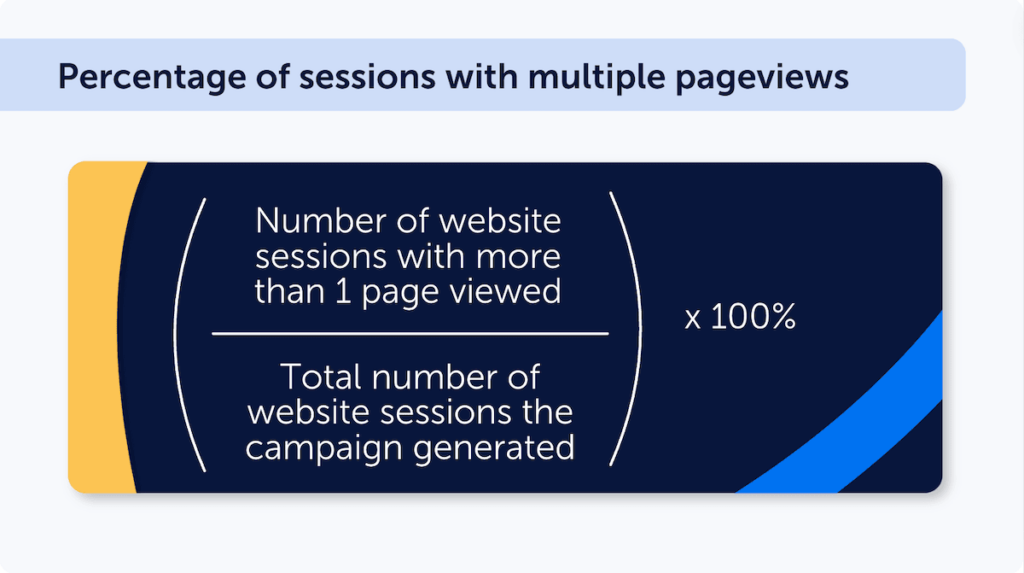
- Percentage of sessions with multiple pageviews. A great indication of quality traffic is whether your visitors expand their journey beyond the landing page. This means that:
- They want more information, and from analytics you can get new hypotheses to improve your landing page content.
- They know more about you than they did before launching the campaign.
Bad Traffic Quality Metrics:
- Clicks. It’s a bad metric because you don’t know who or what clicked your link. Statista says that ad fraud (clicks from bots, basically) wasted 84 billion dollars in 2023 and predicts that this number will reach 172 billion by 2028.
- Time on page/session duration. Both are bad metrics because they don’t tell if the users engaged with your website or if they just opened the tab and forgot about it. We’ve seen many sessions that lasted for dozens of minutes, but the user was engaged for mere seconds.
- Bounce rate. Like time spent on the page, this can be misleading. Make sure you analyze your bounce rate considering the intent level of the keyword that brought the traffic to your website.
While estimating PPC performance, make sure to pay attention to more than one metric. You absolutely need different metrics to properly estimate ad performance – from bottom line to conversions to engagement metrics that help estimate interest in your products. You can always retarget those who showed interest but didn’t convert just yet.
How to Track Conversions, Engagement Time, and Scroll Depth with Mouseflow
Mouseflow makes it quite easy to track various metrics for individual pages and campaigns, including conversion rate, engagement, and scroll depth. Once installed, it captures all the data automatically, and all you need to do to get the numbers in question is to know where to find them.
Engagement Time and Scroll Depth
For pages
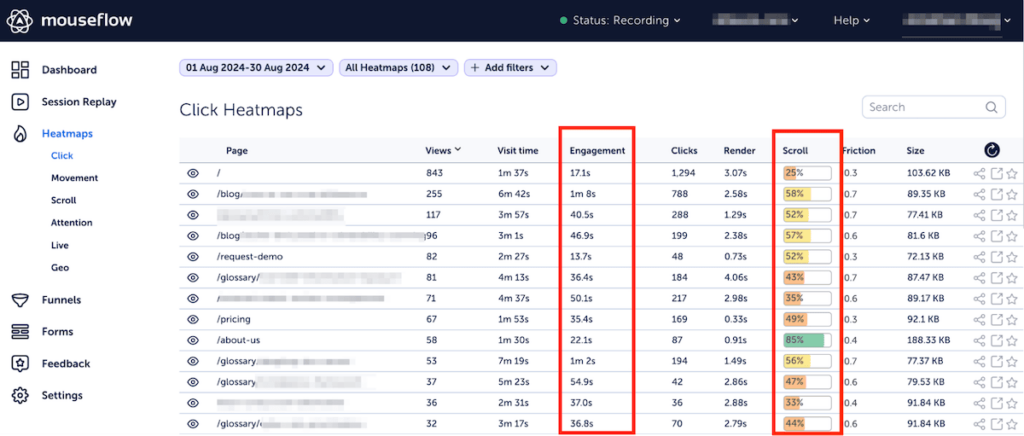
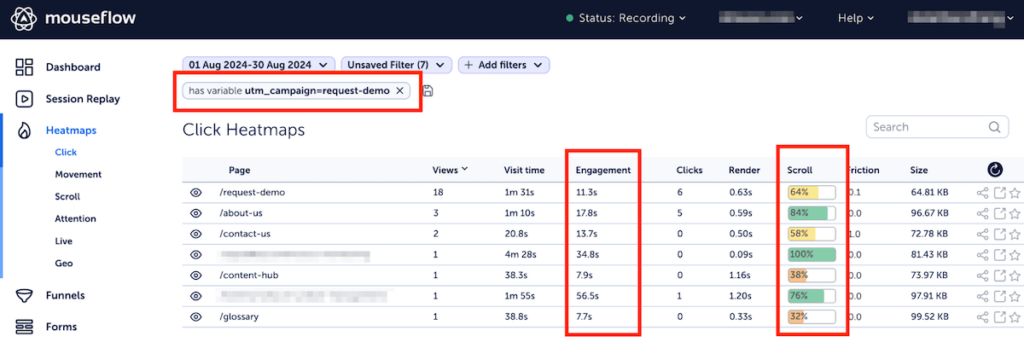
Open the list of heatmaps – and you’ll see engagement time and scroll depth in the respective columns.
For campaigns
On the same page, use filters to filter by variable, and select “UTM parameter” as a variable. Choose “UTM campaign” and select the campaign you’re interested in.
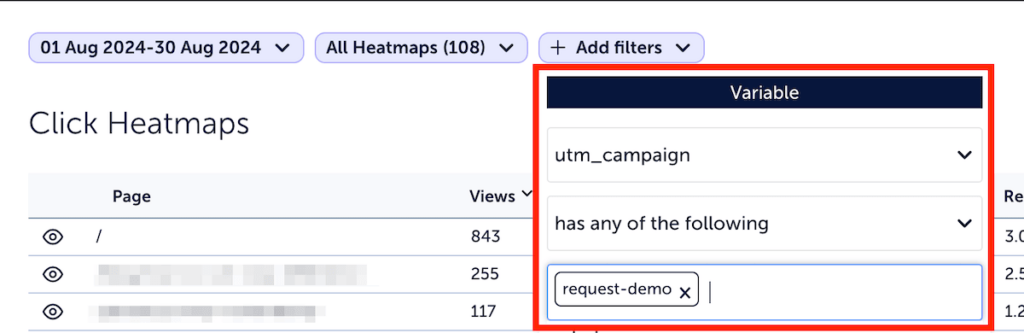
The numbers on the page will change to reflect the data for sessions brought by that campaign.
Conversion Rates
Mouseflow has conversion funnels – a feature that allows you to track how potential customers progress through a sequence of steps on your website (for example, product page -> cart -> checkout) and covers conversion tracking between steps.
To build a funnel, go to “Funnels” and click “Add new funnel”.
Just like with other metrics, if you want to see conversion rates for a certain campaign, just apply the same filter as discussed above to the funnel. You can also filter by UTM source, or UTM medium, or CIDs if you’re using Adobe Analytics.
2. Disable Audience Networks
Audience networks – extending reach beyond the advertising platform – could be good for awareness, but they bring extremely poor traffic. If you want quality traffic, audience networks are not for you, and excluding them helps tremendously with PPC campaign optimization.
How do you know if they are enabled? It’s easy: Check your campaign setup thoroughly and look for “optimized targeting” or “Audience Network”. Turn it off. If you’ve noticed that average engagement time in a campaign is suspiciously low – about a few seconds – it might mean that you have audience networks enabled.
Disable Audience Expansion Options
Using this will essentially tell the algorithm, “Here is my carefully crafted segmentation of my ICP, but if you feel like it, go spend money elsewhere”. You want to keep control over how your money is allocated. When in doubt, run limited tests to see if it benefits your campaigns, but I personally never have it on.
You Traffic Metrics Tell You If You Have Audience Networks Enabled
Audience networks are very easy to detect if you look at traffic quality.
In Mouseflow, look at the list of session replays and filter them by variable, choosing UTM campaign as the variable. If you see plenty of sessions that come from similar sources and have a duration of exactly 10 seconds – you certainly have audience network enabled and are getting some ad fraud clicks.
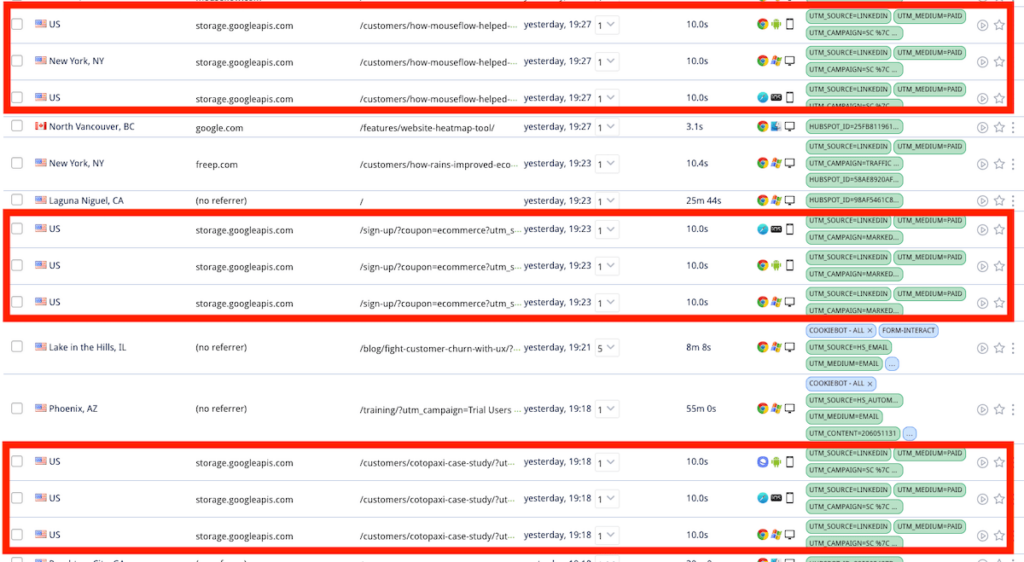
Doesn’t look like quality traffic, does it?
If there are plenty of sessions that are 10 seconds or shorter and have similar sources, these are likely coming from audience networks.
Among popular platforms, LinkedIn Ads, Facebook Ads, Microsoft Ads, and X (aka Twitter, there they call it X Audience Platform) all have this feature. So does Google Ads (there it’s simply “Networks.”) We’ll provide descriptions for how to disable audience networks on all these platforms or leave links to documentation if applicable.
How to Disable Audience Networks and Display Networks on Different PPC Ad Platforms
- LinkedIn provides full documentation on how to disable the LinkedIn Audience Network
- For Meta Ads, to disable the Audience Network feature for your PPC campaign, select “Manual placements” in the “Placements” settings as you’re creating the ad set. Once you do that, you can deselect the Audience Network (here’s how to enable Manual placement on Meta)
- On X, to disable the Audience Platform, select “Edit campaign” -> “Creatives”. There, you can deselect the Audience Platform.
- Formally, it’s not possible to disable the Audience Network for Microsoft Ads. But you can get almost the same effect by blocking some websites. In the campaign details, go to “Settings” -> “Exclusions”. Exclude msn.com, outlook.live.com, outlook.com, and bing.com and save settings. This way, you exclude most display placements that Microsoft has.
- Google Ads allows you to uncheck boxes that enable showing your ads across two different networks – Display Network and Search Network. To disable networks in Google Ads, go to your campaign and select “Settings”. There, choose “Network” and remove checkmarks from both Display Network and Search Network. Note that if you’re using Smart campaigns, you can’t disable them – your only option would be to run a regular campaign instead. Also, if you are running Display or Video campaigns, make sure you exclude apps as a placement. These will deplete your budget and deliver suboptimal results.
- In Amazon Ads, this feature is called “Sponsored Display Audiences” and these display ads can run both on Amazon and off Amazon. Fortunately, it’s a type of Amazon PPC campaign, not a hidden checkmark in the settings. So, if Display Audiences don’t fit your Amazon PPC strategy, don’t go for this type of ad campaign. If you already have them running, you can pause or archive them.
Getting rid of audience networks is a PPC optimization trick that worked for us and many other businesses, and it will likely improve your traffic quality as well. A lot.
3. Stop Campaigns With Low Engagement Time and Scroll Depth
While audience networks are notorious for bringing poor traffic to websites, they are not the only culprit. Sometimes, it’s the wrong geographic targeting. Sometimes, it’s the wrong audience.
To optimize ad spend and increase conversions, it’s better to disable all campaigns that bring poor quality traffic to your website, whether it’s audience networks or something else. Use the same traffic quality metrics you established in the beginning to identify campaigns that bring a lot of low quality traffic and either readjust targeting or stop them altogether.
Evaluate Traffic Quality With Mouseflow
If you’re using Mouseflow, a quick solution to evaluate campaign traffic quality would be to open the list of session replays and filter by UTM campaign (to select traffic coming from the campaign you’re looking to evaluate). Then, look at the traffic quality metric (we usually look at engagement time and scroll depth, but you can also look at the number of pages per session).
Compare this metric for different campaigns to understand which ones are bringing more engaged traffic.
This is what Sensorem, a DTC brand that creates personal alarms for elderly people, did. They stopped campaigns with low scroll depth and engagement time – and it resulted in a 2x conversion rate improvement. Check out their case study.
You can, of course, look at conversions as the ultimate quality metric. However, it doesn’t work equally well for everybody. For products and services that take many touchpoints to convert, getting engaged traffic from campaigns may be good enough, even if it doesn’t convert right away.
4. Experiment With Messaging and Creatives Consistently
In digital marketing, everything is a test. And so should be your campaigns.
It means never running a campaign with just one creative. Instead, always test different ones side by side and see which creative leads to better PPC campaign performance. The same goes for the ad copy, and for the landing page design and copy as well.
Ideally, from each campaign, you should get some ideas not only about what kind of creatives and messaging works best for your target audience, but also why it is so. The better you know your audience, the better you can target them and the more compelling ad copy and creatives you can create for them.
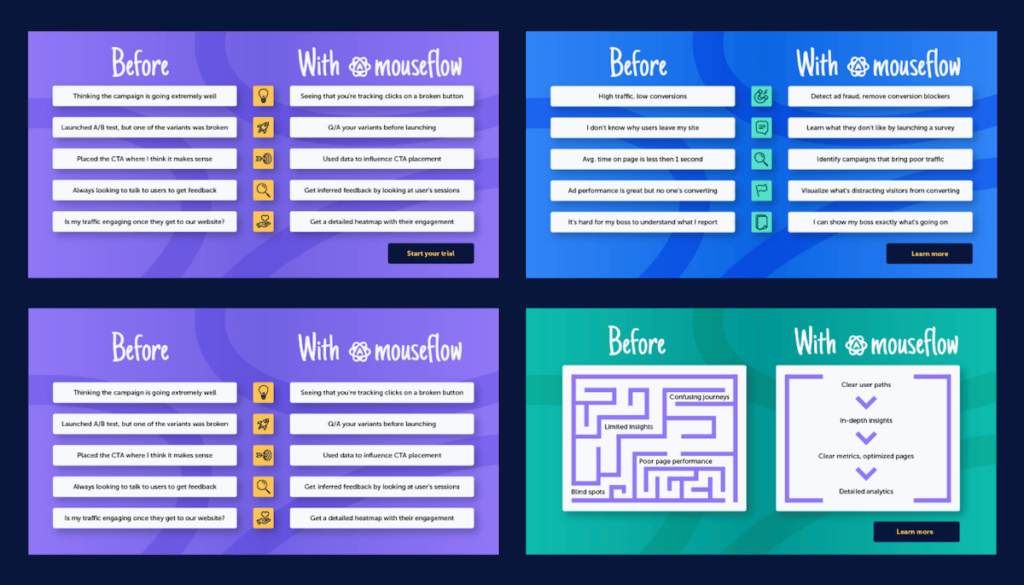
How we experiment with ad creatives. In fact, that’s only 4 out of 12 different versions we used for one campaign
When experimenting with ads, we encourage you to always look at other metrics besides just the click-through rate (CTR). Clicks don’t mean anything. Conversions and engagement do. Use data about conversions and engagement to keep building the persona of your ideal customer and generate better ideas for further campaigns.
Continuously running experiments and optimizing PPC campaigns from the creative standpoint can save digital marketing departments tons of money by getting better qualified traffic while only slightly increasing the resources they’re spending on designs and setting up ad campaigns.
5. Find What Causes Friction
The journey from browsing a social network to checking out a cart can be pretty long. And on this journey, there are so many places where potential customers can stumble upon something that isn’t right – and drop off. Fortunately, most of this journey happens on your website, so you can control it and fix problems by adjusting your website design.
These problems that occur on the user’s journey to purchase are often called friction. There are many different types of friction – from unclear website navigation to buttons that don’t work, and from the website not looking trustworthy enough to forms that can’t be completed.
Some of them are easier to catch than others – and there are ways to automate the process. For example, this applies to JavaScript errors and so-called rage clicks (rapid series of clicks on an element) that usually indicate frustration. Behavior analytics tools like Mouseflow can catch them and report them to you.
Friction that isn’t connected to broken technology is harder to detect, but you can still do it, even though it will require some effort. The simplest way to do it is by watching session replays captured with a session recording tool.
In a session replay, you can see what each individual user has been doing on your website from the moment they entered to the moment they left – as if you were sitting next to them. Reviewing recordings helps you see if there are logic loops on your website or if users get distracted or lost in the navigation.
Fixing this helps improve results from your PPC ad campaigns and every other source of traffic, so don’t sleep on improving website user experience.
Where to Start Looking for Friction
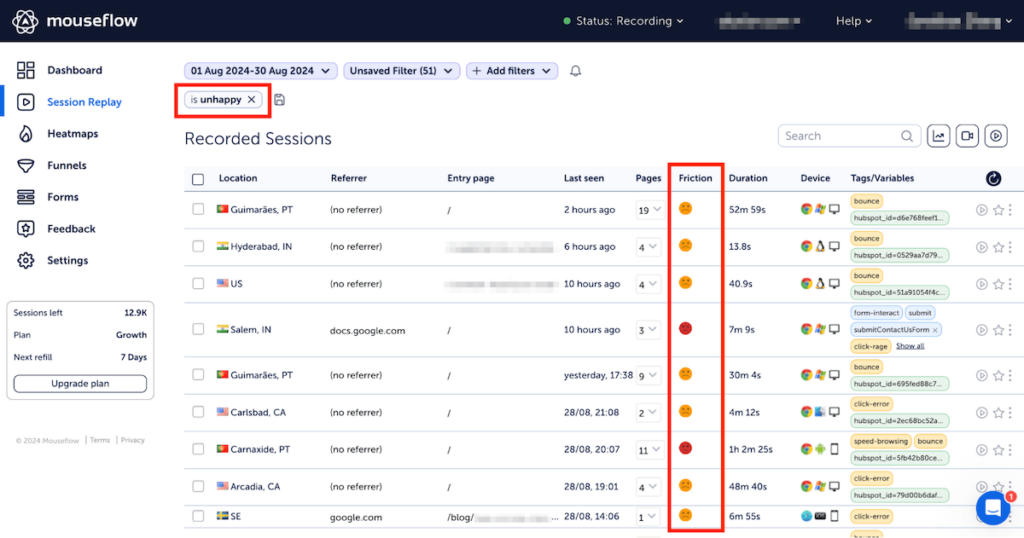
Mouseflow has a special feature called Friction Score. It takes into account all the friction events a user experienced (you can even set up custom friction events in addition to the predefined ones).
We recommend filtering the list of recordings by friction score and starting with reviewing recordings of those users that were marked as “unhappy” or “very unhappy” (they experienced high friction during their sessions on your website).
6. Set Up Error Tracking
The biggest problem is when something on the user’s journey is just completely broken. A payment method that doesn’t work, an unclickable add-to-cart button, or stuff like that. And these happen much more often than you may think, including to really serious brands.
Can you avoid these? Well, it would be great, but unfortunately, not always possible. What you can do is catch these errors early as they emerge and fix them as soon as possible. For that, you need to know that they have happened. And for that, you need error tracking and notifications.
There are many solutions that offer this functionality, Mouseflow is one of them. To catch errors early, you’ll need to enable notifications for friction events such as click-error (that’s JavaScript errors, meaning some of your website functions aren’t working as expected).
The frequency of notifications is up to you, but we’d recommend setting hourly notifications when there’s a significant amount of click-errors that happen over the course of an hour. This way you’ll immediately know if something has broken on your website. Review recordings with click-errors, see if they indeed impact conversions, and share them with your web developers so that they can quickly understand and fix the problem.
A recording is more than a video, it captures all the HTML of your website, and the errors are more than notifications, they show what exactly went wrong and when, including which piece of code produced them.
With error notifications, you can be sure that if there’s an error that’s preventing many users from achieving their goals on your website, you’ll quickly know about it. It saves money, time, and overall ensures that all your other PPC optimization efforts aren’t in vain.
Conclusion
PPC optimization doesn’t end with lowering costs per click. Tracking metrics like engagement time and scroll depth for your campaign landing pages allows you to evaluate your ad campaigns much better. Optimizing user experience and reducing friction on your website helps users successfully get to where you want them – the “checkout successful” page.
Stop the campaigns that bring poor traffic to your website, double down on the ones that bring qualified traffic, remove friction points – and you’ll improve PPC performance and save tons of money on PPC advertising at the same time. You’ll also end up improving every other important metric – from conversions to ROAS and revenue.