- TL;DR: Mouseflow vs Hotjar
- Hotjar Now Part of Contentsquare
- Quick Comparison Overview
- Data Capture and Sampling
- Heatmaps Comparison
- Session Replay Comparison
- Friction Detection and Error Tracking
- Form Analytics
- Funnels and Journey Analytics
- Surveys, Feedback, and User Research
- Collaboration and Workflow
- Pricing Considerations
- When to Choose Mouseflow
- Frequently Asked Questions
- Final Take
Mouseflow vs Hotjar (by Contentsquare): The Complete 2026 Comparison
If you are comparing Mouseflow vs Hotjar, you are likely evaluating more than just features. You are deciding how your organization will understand user behavior, identify friction, and improve conversions.
Both platforms offer session replay, heatmaps, funnels, and surveys. On the surface, they appear similar.
Under the hood, they are built with different priorities.
Mouseflow is designed for behavioral depth and conversion optimization.
Hotjar, now part of Contentsquare, is designed for usability, collaboration, and structured user research.
Important Context: Hotjar Is Now Part of Contentsquare
In 2021, Hotjar was acquired by Contentsquare. Since then, Hotjar has been positioned within the broader Contentsquare ecosystem.
This comparison primarily evaluates the legacy Hotjar product experience, meaning the heatmaps, session replay, funnels, and survey tools that historically defined Hotjar as a standalone behavior analytics platform.
However, if you purchase Hotjar today, you are not simply buying the original standalone Hotjar product. You are entering the Contentsquare ecosystem.
That distinction matters.
What This Means in Practice
Historically:
- Hotjar operated as an independent, mid-market friendly behavior analytics tool.
- Pricing tiers were structured around session limits and feature access.
- The product was optimized for ease of use and quick deployment.
Today:
- Hotjar is positioned within Contentsquare’s broader digital experience platform.
- Advanced capabilities increasingly align with Contentsquare’s enterprise roadmap.
- Pricing, packaging, and feature structure may differ from legacy Hotjar positioning.
- Enterprise buyers may be guided toward broader Contentsquare plans.
Why This Matters for Buyers
If you are evaluating Hotjar as an alternative to Mouseflow, you should clarify:
- Are you buying legacy Hotjar functionality?
- Are you entering a broader Contentsquare pricing structure?
- Do you need enterprise-level digital experience analytics?
- Or are you looking for a focused behavior analytics solution?
Contentsquare is a powerful enterprise platform with advanced digital experience analytics, journey mapping, and product analytics capabilities. But it operates at a different pricing and complexity tier compared to traditional mid-market tools.
TL;DR: Mouseflow vs Hotjar
Choose Mouseflow if you prioritize conversion optimization and behavioral depth.
Choose Hotjar if you prioritize collaboration and user research workflows.
Here is the difference in simple terms:
- Mouseflow captures all sessions without daily sampling limit. Hotjar distributes session capture using a sampling algorithm.
- Mouseflow provides 7+ friction signals and advanced filtering. Hotjar focuses on rage clicks, frustration scoring, and usability.
- Mouseflow offers dedicated form analytics with field-level drop-off tracking. Hotjar does not offer standalone form analytics.
- Hotjar includes built-in interview recruitment and stronger collaboration tools.
- Mouseflow emphasizes analytical control and segmentation.
Quick Comparison Overview
| Mouseflow | Hotjar (by Contentsquare) | |
| Sampling | No daily sampling | Monthly sampling distribution |
| Heatmaps | 7 types incl. attention & friction | 3 core types + engagement zones |
| Friction Detection | 7+ signals + friction score | Rage clicks + frustration score |
| Form Analytics | Dedicated field-level analysis | No standalone form analytics |
| Session Replay | 100+ filters | Unified multi-tab sessions |
| Surveys | NPS + feedback triggers | Surveys + feedback widget + interviews |
| Collaboration | Tags & dashboards | Highlights + Slack/Teams |
| Data Retention | Shorter on lower tiers | 12 months standard |

Data Capture and Sampling
Mouseflow captures all sessions until your monthly plan limit is reached. It does not throttle daily session recording.
This matters if you:
- Run paid campaigns
- Experience traffic spikes
- Optimize high-traffic checkout flows
- Rely on complete funnel visibility
Hotjar uses a sampling algorithm to distribute session recordings evenly across the month. This prevents early credit exhaustion and ensures stable coverage.
Strategic Take
If you want full behavioral fidelity and are comfortable managing session limits, Mouseflow gives you deeper control.
If you prefer predictable, automated session distribution without monitoring, Hotjar simplifies the process.
Heatmaps Comparison
Mouseflow offers 7 heatmap types:
It also includes advanced click metrics such as hover-to-click rate and time-to-click.
This is particularly valuable for:
- CTA optimization
- Content hierarchy testing
- Scroll-depth analysis
- Dynamic element tracking

Hotjar offers:
- Click
- Scroll
- Movement
- Engagement zones
Hotjar can only offer fewer types of heatmaps and no link analytics.
Strategic Difference
Mouseflow emphasizes interaction depth.
Hotjar emphasizes simplicity and team usability.
Session Replay Comparison
Mouseflow
- 100+ filters
- Mina AI, turning session recordings into instant, actionable insights with AI that works automatically with your analytics, understands natural language questions, and surfaces user friction and behavior patterns in seconds.
- Friction score per session
- Replay drop-offs in funnels
- Waterfall-style page breakdown
Mouseflow, Session Replay is built for analysts, Marketing and CRO teams.
Hotjar
- Multi-tab unified session view
- Clickable timeline navigation
- Shareable highlights
- Clean, intuitive player
Built for collaboration and storytelling.
Verdict
Hotjar wins on interface polish.
Mouseflow wins on filtering power.
Friction Detection and Error Tracking
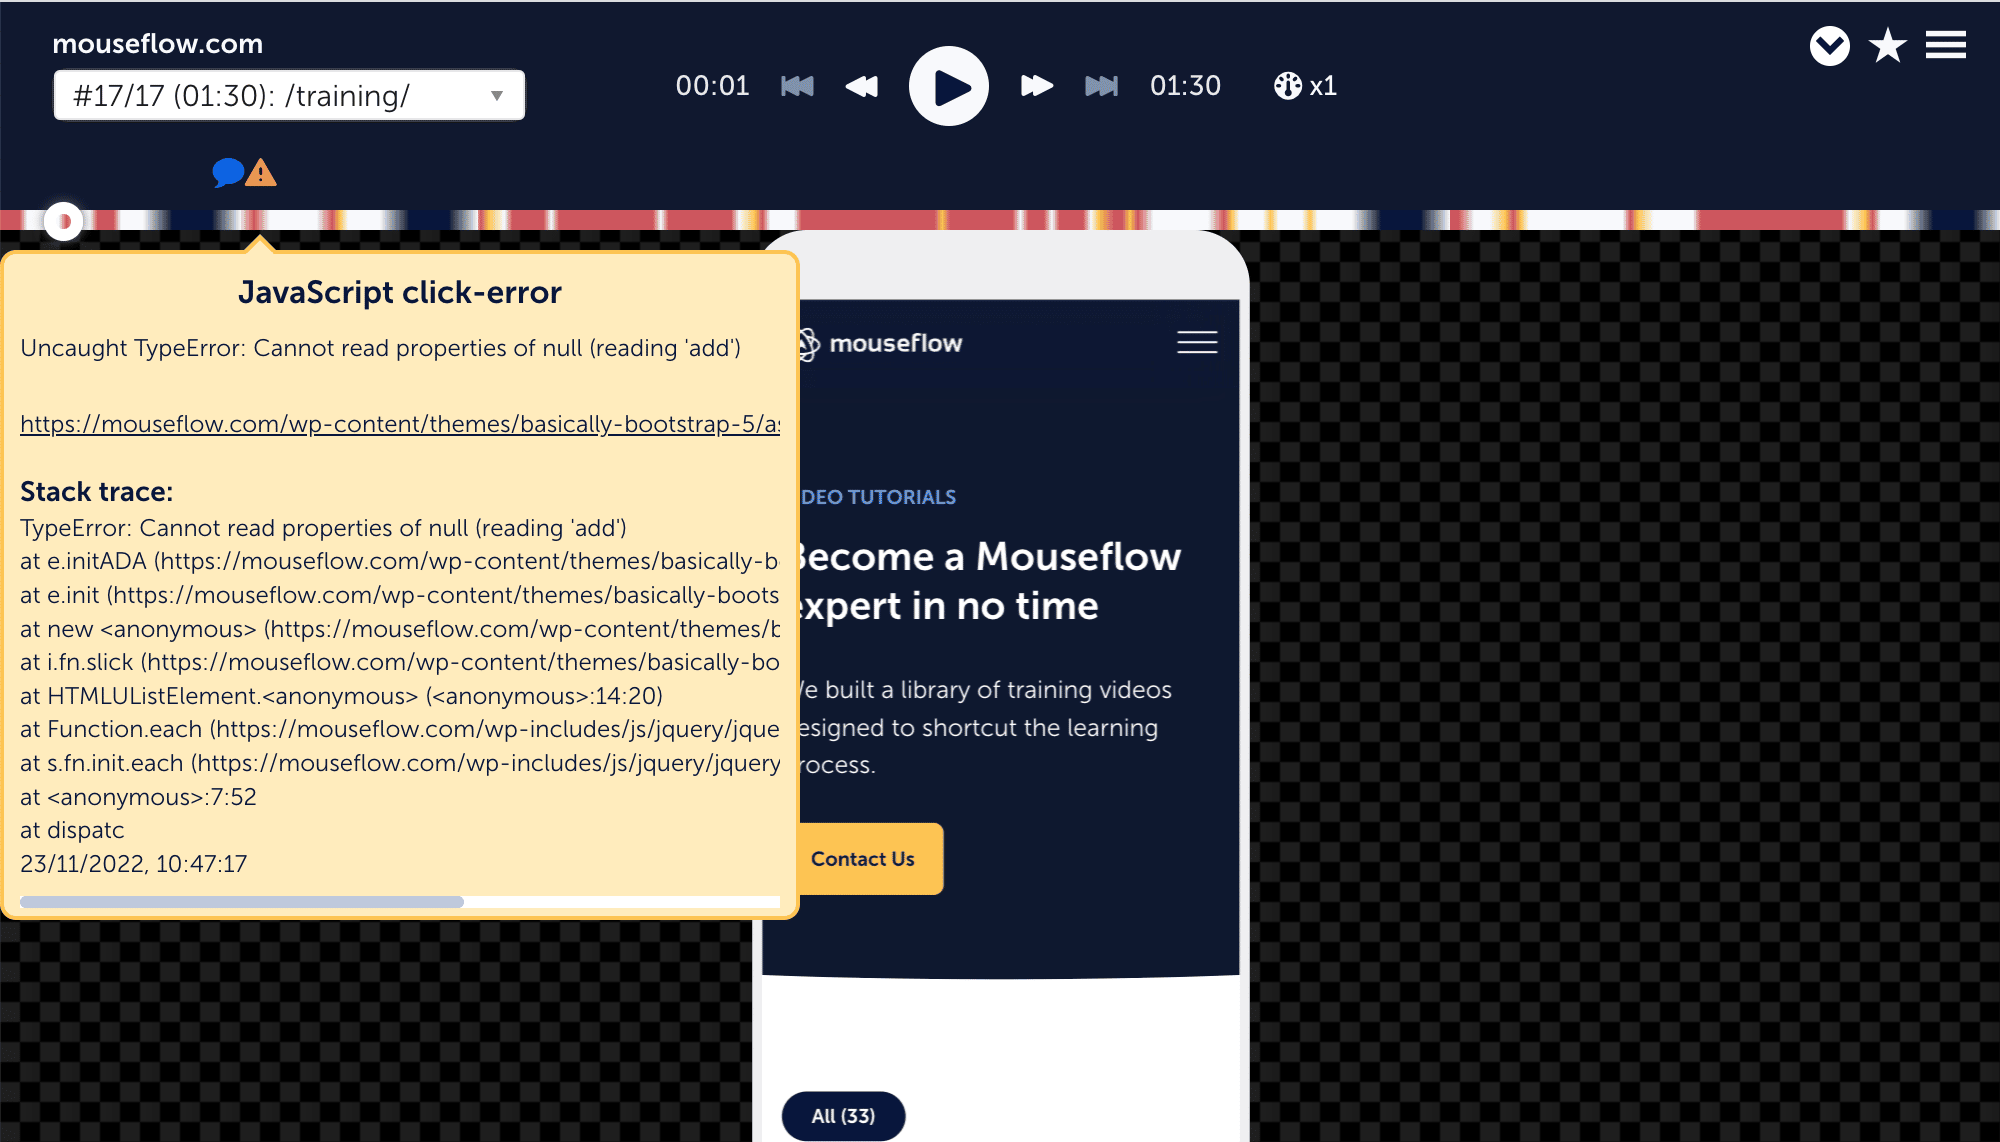
Mouseflow
Automatically detects 7+ friction signals, including:
- Rage clicks
- Click errors
- Submit failures
- Speed browsing
- 404 errors
- JavaScript errors. No extra set up needed and at no extra cost. This will facilitate your communication with developers when fixing issues on your website.
Includes:
- Friction score is included in all plans at no extra cost or additional set-up
- Friction heatmaps, allows you to easily visualize the different areas where friction was detected.
- Friction dashboard, uniquely designed to help you surface issues affecting your entire website. With Hotjar, you can only surface specific sessions where frustration ran high.
Hotjar
Detects:
- Rage clicks
- U-turns
- Frustration score
- Console error tracking, only available on higher plan.
Mouseflow provides broader friction classification.
Hotjar provides simplified frustration indicators.
Form Analytics
This is one of the clearest differentiators.
Mouseflow Form Analytics
- Field-level drop-off tracking
- Time-to-complete analysis
- Replay abandoned forms
- Retroactive setup
Ideal for:
- SaaS onboarding
- Insurance applications
- Checkout optimization
- Lead generation sites
Hotjar
- No standalone form analytics
- Can filter recordings by form interaction
If forms directly impact revenue, Mouseflow is stronger.
Funnels and Journey Analytics
Mouseflow
- Retroactive funnels
- Editable without losing data
- Advanced filtering within funnels
- User Journey visualization, combines pageviews to visualize the steps users take between entering and leaving your website.

Hotjar
- Funnels tool
- Trends overview for aggregated performance
- Do not offer a User Journey visualization
Mouseflow supports granular behavioral analysis.
Hotjar supports high-level performance tracking.
Surveys, Feedback, and User Research
Mouseflow
- NPS surveys
- Feedback campaigns
- Trigger surveys based on friction
Hotjar
- Survey logic
- Feedback widget
- External survey links
- Interview recruitment via Engage
- Slack and Teams notifications
Mouseflow offers unlimited responses on feedback campaigns, whereas Hotjar limits the amount of responses you can get from a campaign.
Collaboration and Workflow
Hotjar
- Highlights panel
- Clip sharing
- Slack integration
- Microsoft Teams integration
Designed for cross-functional teams.
Mouseflow
- Advanced filtering
- Custom dashboards
- Deep segmentation
Designed for analyst-driven optimization.
Pricing Considerations
Pricing is no longer a simple side-by-side comparison between two standalone tools.
Since Hotjar became part of Contentsquare, buyers should understand that pricing structure, packaging, and positioning may differ from legacy expectations.
Mouseflow remains an independent behavior analytics platform.
Hotjar is now positioned within the broader Contentsquare ecosystem.
Before comparing price points, ask:
- Do I need a focused behavior analytics tool?
- Or am I investing in a broader digital experience platform?
If you need deep behavior analytics, friction detection, and form optimization without entering a larger enterprise analytics ecosystem, Mouseflow offers a focused cost structure.
If you are building a full digital experience intelligence stack, Contentsquare may be part of that broader and more expensive investment.
When to Choose Mouseflow
Whether you are a startup, a big company, or an online business somewhere in between, Mouseflow is a powerful complement to your quantitative and qualitative analytics stack. Its features have been developed to provide flexibility and readily-available insights that improve efficiency and effectiveness, something that is highly valuable at any company regardless of its size or stage. It’s breadth of features ensures that you have everything you need as you grow your business.
Mouseflow’s benefits span across different areas of interest. Further, let’s highlight its benefits by roles and by company size:
- If you work in Product
Mouseflow can help you validate your user flows and ensure that your features suit your clients’ needs, collect feedback directly from your users to understand what to build next. Moreover, as Mouseflow doesn’t sample your data, you can review how changes in the product have impacted your visitors’ navigation by accessing historical data. - If you work in Digital Marketing
As a digital marketer, it has become increasingly important to understand why your customers aren’t converting. Mouseflow’s set of tools will help you improve your conversion rates by allowing you to build website conversion funnels per acquisition source, campaign, keyword, and/or content type. Analyze heat maps to understand how your visitors consume your website, what gets their attention, and replay sessions from dropped-off visitors to identify problems in your path to conversion. - If you work in UX/UI
With Mouseflow’s Friction Score you can quickly identify sources of issues with your visitors’ sessions to iterate rapidly and continually. By complementing your favorite analytics tool with Mouseflow, you can have the full picture with quantitative and qualitative data to truly understand what’s preventing your visitors from arriving at the aha! moment. You can also run feedback and NPS campaigns to learn more about how people perceive the product. - If you are a Startup
When you are a startup, it is all about efficiency, cutting costs, and getting the best bang for your buck. Resources are limited and you are always running against time. Mouseflow is not extraneous to this situation. In other words, the product has been developed around providing the most valuable insights in the least amount of time and effort. Our pricing plans are affordable and our product capabilities can scale alongside your startup quickly by just consulting with our A-team in support. Share or download recordings across teams, departments, and freelancers to speed-up your iteration and beat your competitors in finding product-market fit. - If you are a bigger company (Enterprise)
Mouseflow’s flexibility and advanced filtering capabilities are perfectly suited for multi-disciplinary teams focused on optimizing web properties. It is trusted by over 165,000 brands to deliver powerful insights that can change the course of a business into the path of success. Error tracking can facilitate communication with development teams, while Friction Score can free-up resources when analyzing vast amounts of recordings.
Frequently Asked Questions
Yes. Especially for CRO-focused teams that need deeper behavioral analytics and form optimization.
Yes, Hotjar distributes session capture using a sampling algorithm.
No, Mouseflow captures all sessions until plan limits are reached.
Mouseflow provides dedicated field-level form analytics. Hotjar does not.
Hotjar offers stronger collaboration and interview features.

Final Take
Mouseflow and Hotjar are no longer just two similar tools competing in the same lane.
Mouseflow remains a focused, independent behavior analytics platform built specifically for:
- Conversion optimization
- Friction detection
- Form analytics
- Deep behavioral segmentation
Hotjar, now part of Contentsquare, increasingly sits within a broader digital experience ecosystem that extends beyond traditional heatmaps and session replay.
So the real decision is not just Mouseflow vs Hotjar.
It is this:
Do you need a focused behavioral analytics engine?
Or are you investing in a broader digital experience platform?
If your priority is precision, friction analysis, marketing and CRO depth, Mouseflow offers a streamlined, purpose-built solution.
If your priority is cross-functional research workflows and enterprise-scale digital experience analytics, Hotjar within the Contentsquare ecosystem may align with that direction.
The right choice depends on whether you are optimizing conversions at depth or building a broader experience intelligence stack.