SaaS marketing teams have no shortage of data.
From leads and conversion rates to NPS, engagement scores, and recurring revenue, there’s always another metric to track, and another dashboard to check. The problem isn’t a lack of data. It’s knowing which metrics actually matter.
When everything is tracked, it becomes harder to see what’s driving real impact. Many SaaS marketers end up overwhelmed, struggling to connect metrics to meaningful outcomes or use them to guide strategy.
That’s because metrics only make sense in context. To be useful, they need to be tied to your overall SaaS marketing strategy, where each metric reflects a specific stage of the customer journey – from acquisition to retention.
In this guide, we’ll break down the 11 most important SaaS marketing metrics and how to use them to make better, more informed decisions.
First, Why Is It So Hard To Choose the Right Marketing KPIs?
Just one word: “Attribution.”
SaaS marketing is way more complex than promoting Amazon products. Before even becoming a marketing qualified lead (MQL), a prospect has around 54 touchpoints with a B2B SaaS brand after the first website visit.
It means that to subscribe and become loyal customers, it takes no fewer than a few hundred touchpoints with your marketing assets, sales team, customer support, and so on in a circle.
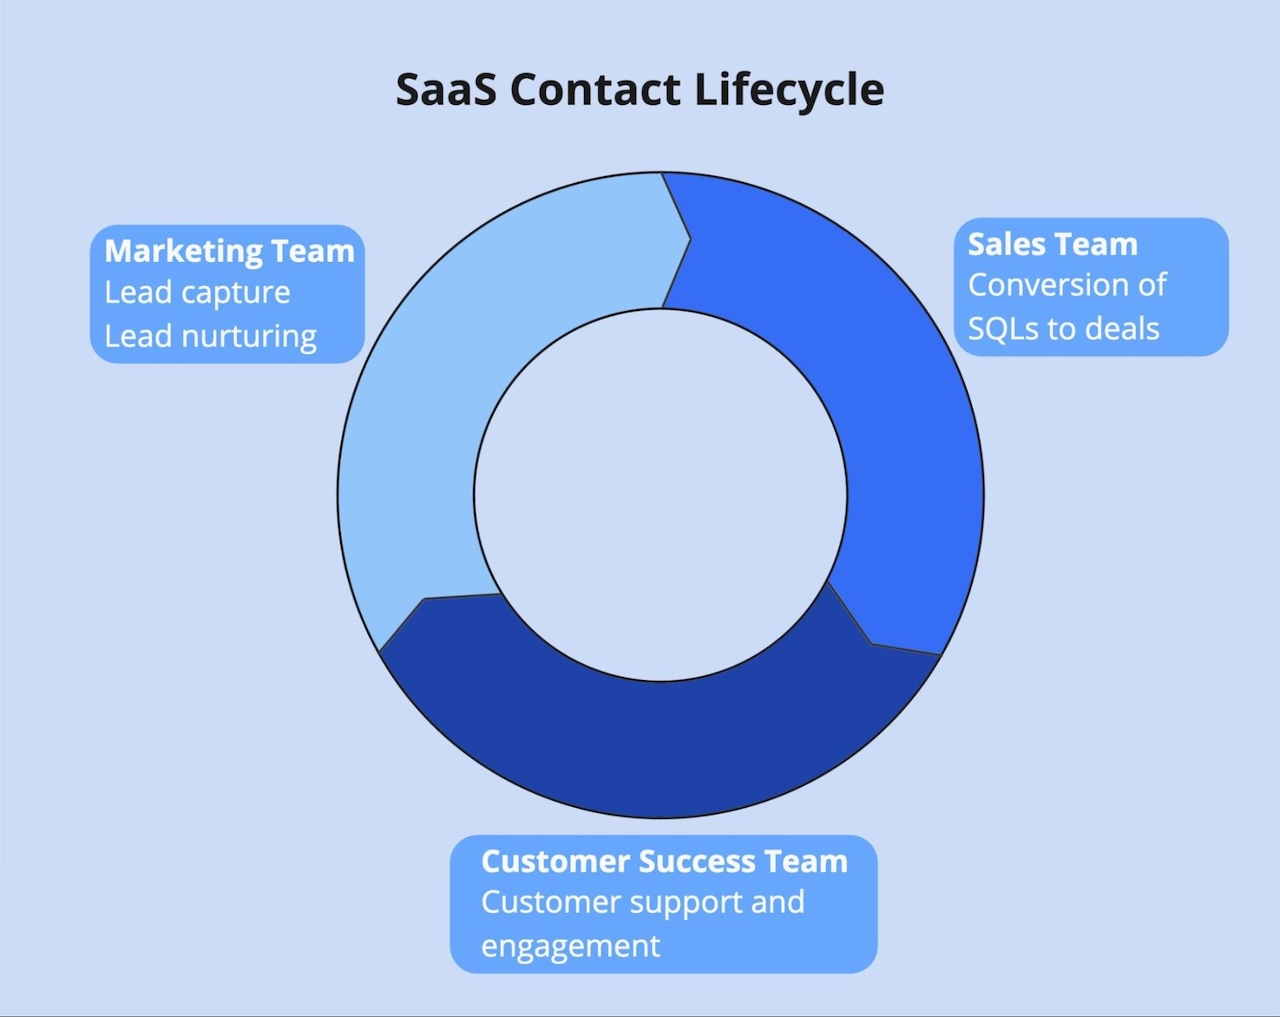
So, most deals happen as a result of joint efforts from the entire organization. And that’s what makes it so difficult to define the right SaaS marketing metrics — you can’t attribute it to marketing when everyone has a part in it.
Of course, you should still be tracking such crucial SaaS metrics as customer lifetime value (CLV) or customer churn rate.
But you can’t judge your marketing performance by these metrics alone. You need a set of KPIs that span from top-level indicators, such as web traffic, to bottom-level metrics, like monthly recurring revenue (MRR).
For marketing teams, financial metrics are essential, but they are only indicators of broader issues (e.g., poor revenue). From there, marketing needs to drill down into their own granular metrics to figure out the root causes of these problems.
11 B2B SaaS Marketing Metrics to Track
When compiling the list below, we’ve tried to include a mix of metrics that help SaaS marketing teams get a full picture of their strategy from top to bottom without overwhelming them with unnecessary detail.
1. Website Traffic
Wait, isn’t it a vanity metric?
As an isolated metric, yes. In fact, here’s a little horror story about prioritizing traffic over common sense.
But as you monitor its ups and downs, look into user behavior metrics, and spot your top-performing content (in terms of conversions) , website traffic becomes a useful performance indicator for your marketing team.

Monitoring site traffic is really important when you see dips in leads or revenue. The key is to look at the quality of the traffic and how well it converts. If traffic drops, it could mean fewer high-intent visitors, which affects leads and revenue. So, while high numbers are great, it’s the quality and conversion that matter most.
Whenever your bottom-level metrics drop, you’ll eventually end up analyzing site traffic to understand the causes behind the issue. When digging into your traffic, look at:
- Traffic trends of your top-converting pages;
- Behavior metrics like engagement time and bounce rates;
- Changes in traffic sources;
- User journey maps (aka behavior flows), etc.
All of these can be done in Google Analytics or right in your behavior analytics tool like Mouseflow.
For instance, if you notice a drop in lead quality, go check the pages that were previously top lead sources. How do the traffic numbers look? Have the traffic sources changed recently? You may discover that a spike in paid traffic has brought a lot of poor-quality leads to you.
2. Conversion Rates
The easiest way to gauge the performance of your marketing efforts is to analyze your results at the campaign level.
Whether you’re running a blog, paid ads, social media, or a combination of these, your top-level performance metric will be the conversion rate — measured per channel, per campaign, etc. This marketing metric indicates the percentage of users that convert after interacting with the specific marketing asset.
What you define as conversions will vary from one campaign to another. The most common options for SaaS are:
- Filling in a contact form
- Signing up for a free trial
- Requesting a demo
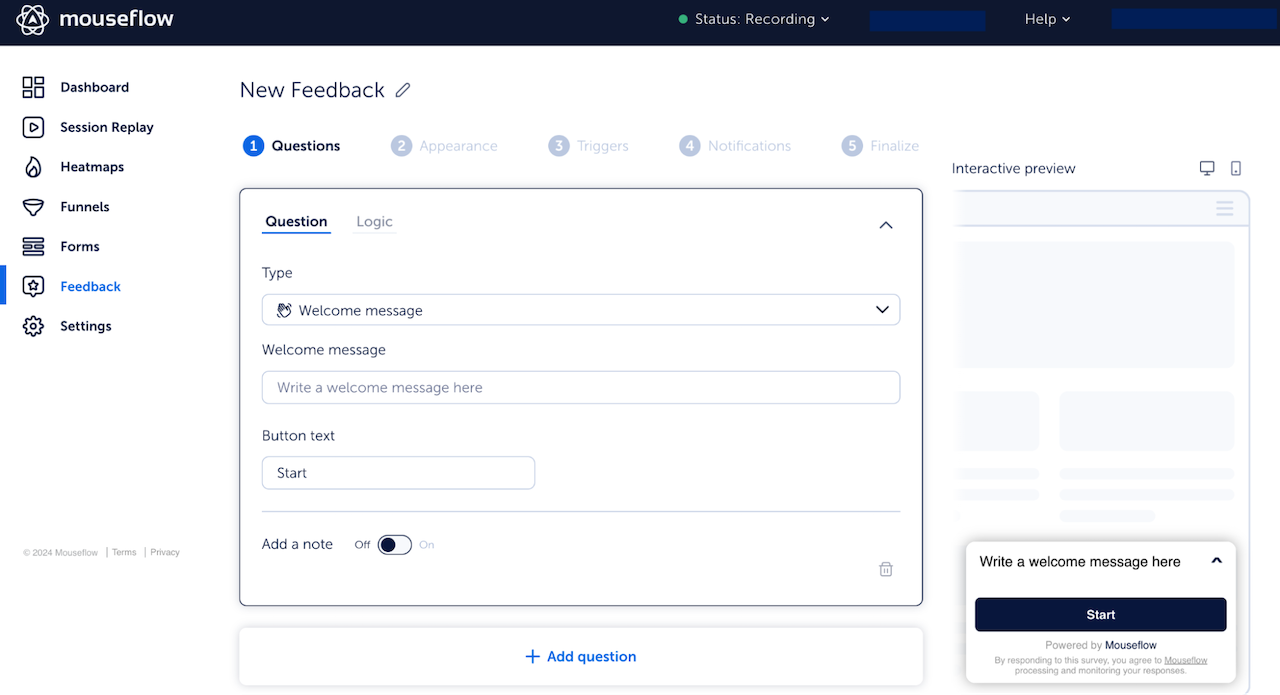
This is where Mouseflow’s conversion funnels come in handy. The tool not only measures the conversion rates of each campaign but also provides a detailed breakdown of your audience’s path to conversion. You can set up a funnel with custom steps for any campaign and watch your visitors progress through each stage of their journey.
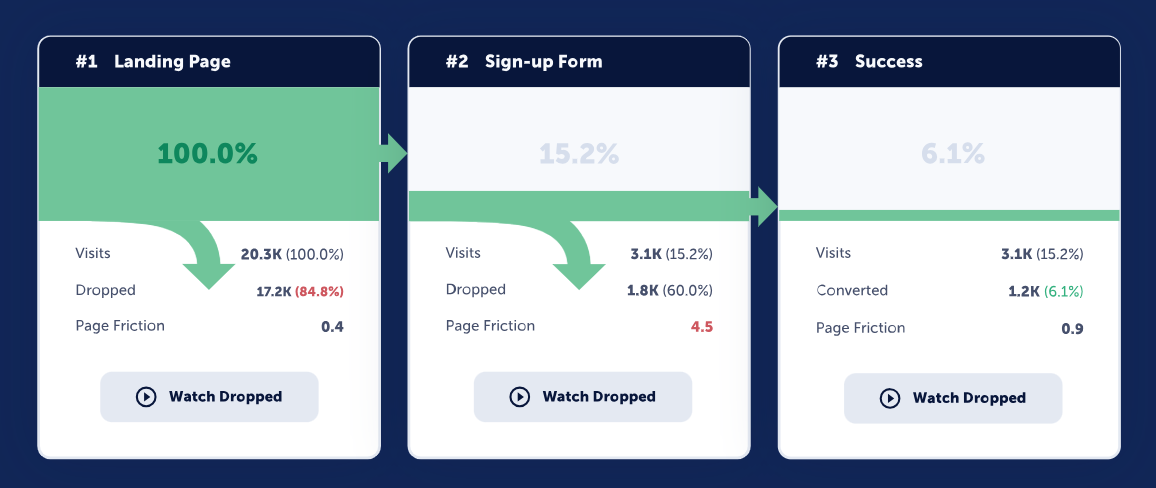
If you notice poor conversion rates, the funnels will reveal at which stage customers are abandoning the process. You can then use Mouseflow’s session recordings to see what’s causing them to drop off and make necessary changes to optimize your campaign for conversions .
3. MQLs/SQLs
Between the two, let’s start with MQLs (aka marketing qualified leads ).
These are the leads with a high likelihood of becoming customers based on their engagement with your marketing efforts. In other words, MQLs are the users who have recently entered your marketing funnel and shared their contact information with you, as well as engaged with some content afterward.
Every company has its own definition of MQLs and how they differ from subscribers. In any case, MQLs are, perhaps, the most important metric to track for pretty much every B2B SaaS.
Obviously, the more MQLs you’re driving, the better. But the sole number of MQLs isn’t enough of a success indicator.
How many of them are becoming SQLs?
An SQL stands for a sales-qualified lead , which is a lead deemed ready to be handed over to the sales team. You should have an internal workflow in place for determining whether an MQL can already be qualified as SQL, and we won’t delve into it in this article.
What’s crucial is tracking the number of SQLs generated each month and, more importantly, the conversion rate from MQLs to SQLs. This way, you can assess whether you’re attracting qualified leads to your funnel or if you need to make adjustments to your SaaS marketing strategy.
If scaling lead generation is one of your current goals ( and when isn’t it?) , you may also monitor lead velocity.
The metric will help you assess whether you’re driving more leads every month. To calculate it, subtract the number of leads (MQLs or SQLs) last month from the number of leads this month. Divide by the number of leads last month and multiply by 100.
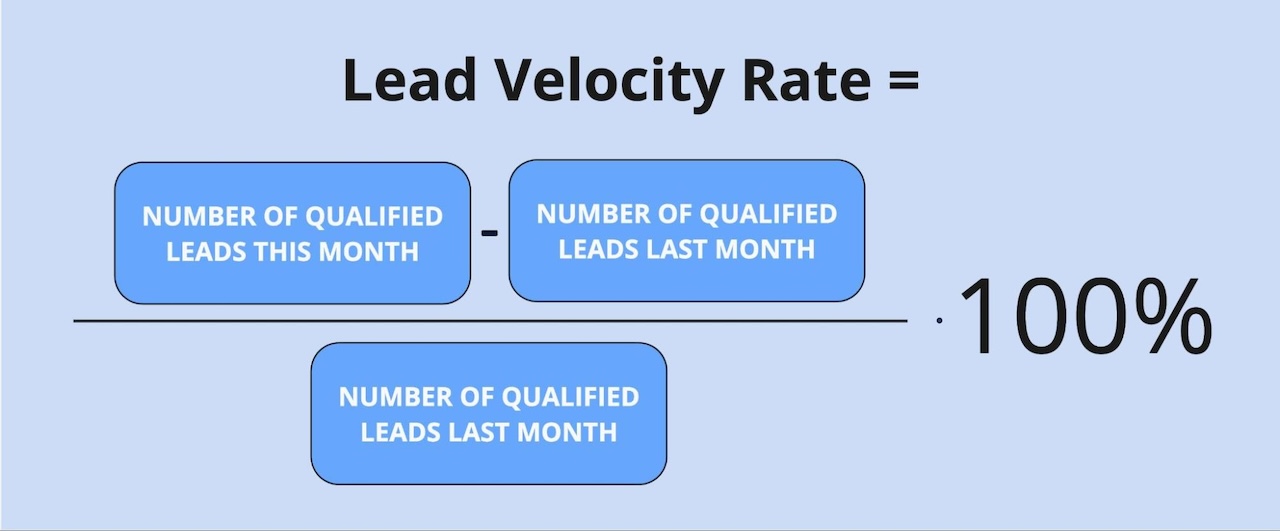
The lead velocity calculation formula
4. New Free Trial Users
Measuring free trial users isn’t as straightforward as you might think.
Do you offer self-service registration for free trials? And do you have a free tier?
If so, it’s important to differentiate between free trial users who registered due to your marketing campaigns (MQLs converting into free users) and those who converted after efforts from your sales team (SQLs converting into free users).
Tracking the first group is straightforward — you simply need to set up tracking for marketing leads who sign up for the free trial. However, the second group is more complex because you can’t entirely attribute these sign-ups to your marketing efforts.
Therefore, we recommend calculating the conversion rate from SQLs to free users in this scenario. The percentage will give you a much better understanding of the quality of SQLs you’re forwarding to the sales team.
5. Activations
Did all your educational content work? The answer lies in your activation rate.
An activation rate measures the percentage of new users who have completed a key action within your product, indicating they’ve realized its value.
This action (often called FMA — first meaningful action) varies depending on your SaaS product but typically includes actions like completing a setup process, using a core feature for the first time, or achieving the first success milestone.
A high activation rate indicates that your onboarding process is effective, and users are finding immediate value in your product.
Any pitfalls? Yes, there’s always one.
Which teams participate in creating an onboarding process for your users? Are sales reps providing detailed demos? Is the customer success team mapping out in-app onboarding flows?
It’s usually a joint effort of several teams to introduce users to the product, so you can’t fully attribute the activation rate to your marketing strategy alone. In this case, we recommend focusing on the growth rate of your activations as a result of your strategy improvements rather than the activation rate itself.
6. Free-to-Paid Conversion Rate
The closer we get to revenue metrics, the tougher it becomes to properly attribute results to your marketing efforts.
How do you attribute paid sign-ups when so many touchpoints are involved in the customer journey?
The harsh truth is, there’s no single correct answer. Each product team needs to choose their own attribution model and stick to it. Many marketers opt for first-touch attribution, where the most weight for conversion is given to the user’s first interaction with the brand.
If that first touch was a marketing resource, you can attribute the conversion to your marketing efforts.

You could try a multi-touch attribution journey, but that’s a whole mess and you’ll need the right tool or tools to pull it off.
We keep a close eye on the number of signups and then conversions to paying customers using our first-touch attribution model — especially for content/SEO initiatives.
7. Customer Acquisition Cost (CAC)
Finally, let’s talk money.

Lowering the CAC is one of our primary goals as a SaaS company. The less it costs us to acquire new customers, the higher our potential revenue is.
Customer acquisition cost (CAC) is one of the most important performance metrics for SaaS marketing teams.
It tells you how much you’re spending to acquire each new customer, including all marketing and sales expenses. To calculate CAC, add up all your marketing costs for a specific period and divide that by the number of new customers acquired during that same period.
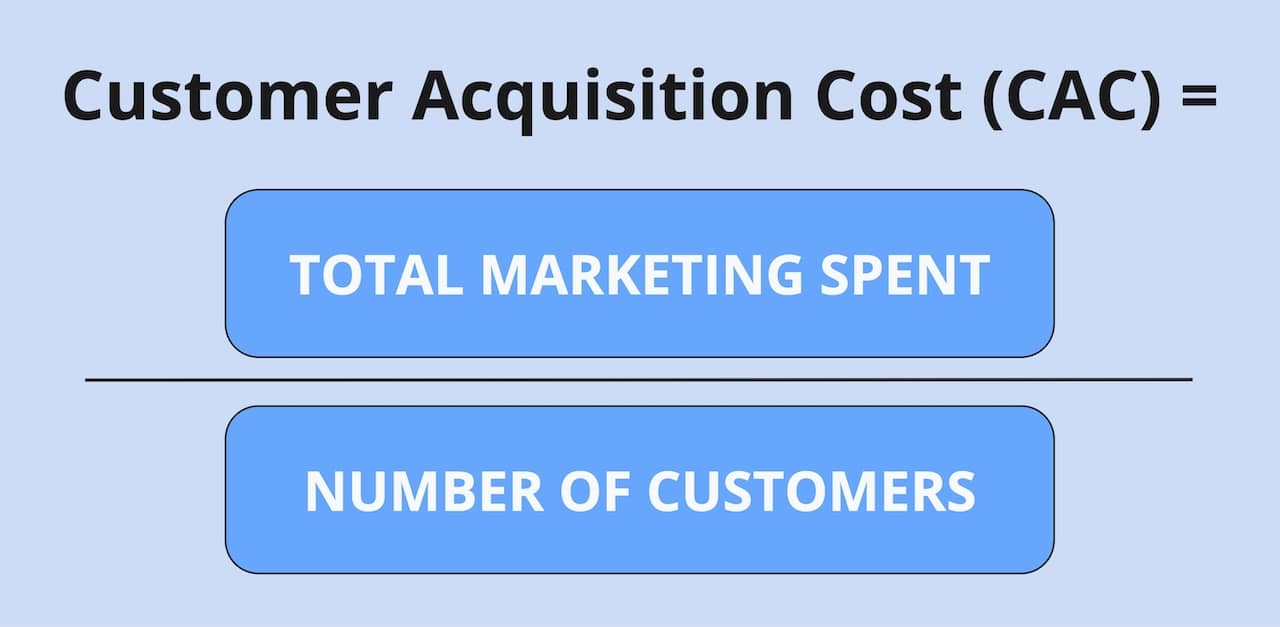
Most often though, the customer acquisition cost formula includes the sum of sales and marketing costs, which is more fair and realistic attribution-wise. What you can do is try to use two formulas: one to calculate CAC when the sales team is involved and one to calculate self-service conversions.
8. Customer Lifetime Value (CLTV or CLV)
CAC tells you nothing without understanding how much revenue one customer brings you.

There are two metrics we track obsessively: our CLTV:CAC to show profitable growth and activations to show product sustainability.
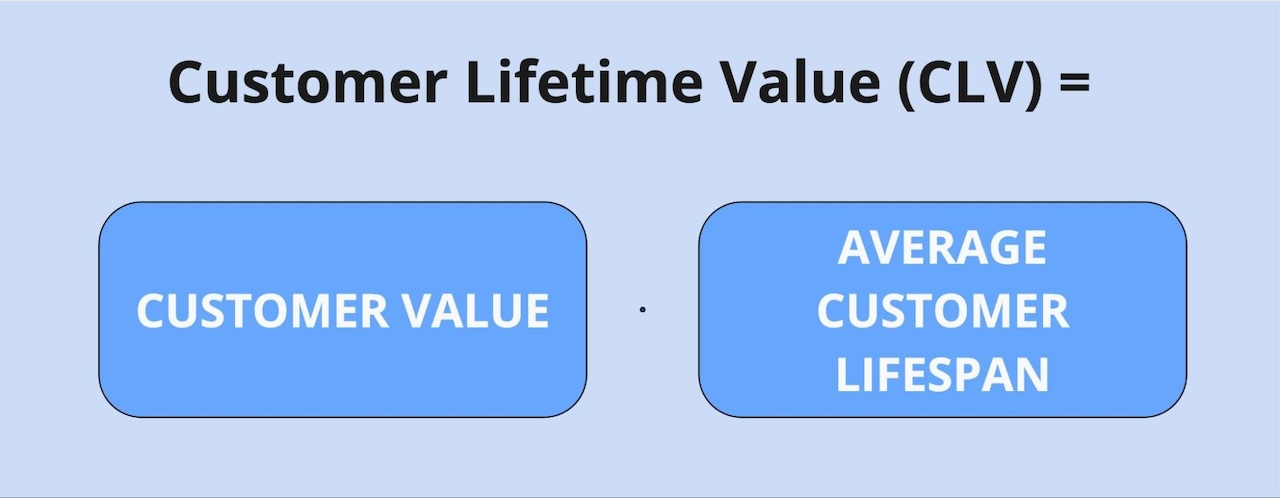
Marketing budgets are always determined by how much value you bring versus the expenses you require. And customer lifetime value (CLTV) helps to gauge this value.
CLTV is the total average revenue a customer brings to your company over their customer journey. Different companies use slightly different formulas for calculating CLTV. We stick to this one:
9. Retention Rate
The customer retention rate is a clear measure of the entire organization’s performance. After customers sign up, the impact of marketing interactions typically decreases, while product quality and customer service take over. So, how is the retention rate relevant to the marketing team?
Actually, it’s highly relevant.
Hubspot, the creators of the term inbound marketing, picture it as a flywheel with three key stages: attract, engage, and delight. The “engage” and “delight” parts both target existing customers. And communication with existing customers has two main goals: upselling and retention. So, apparently, marketing has something to do with it.
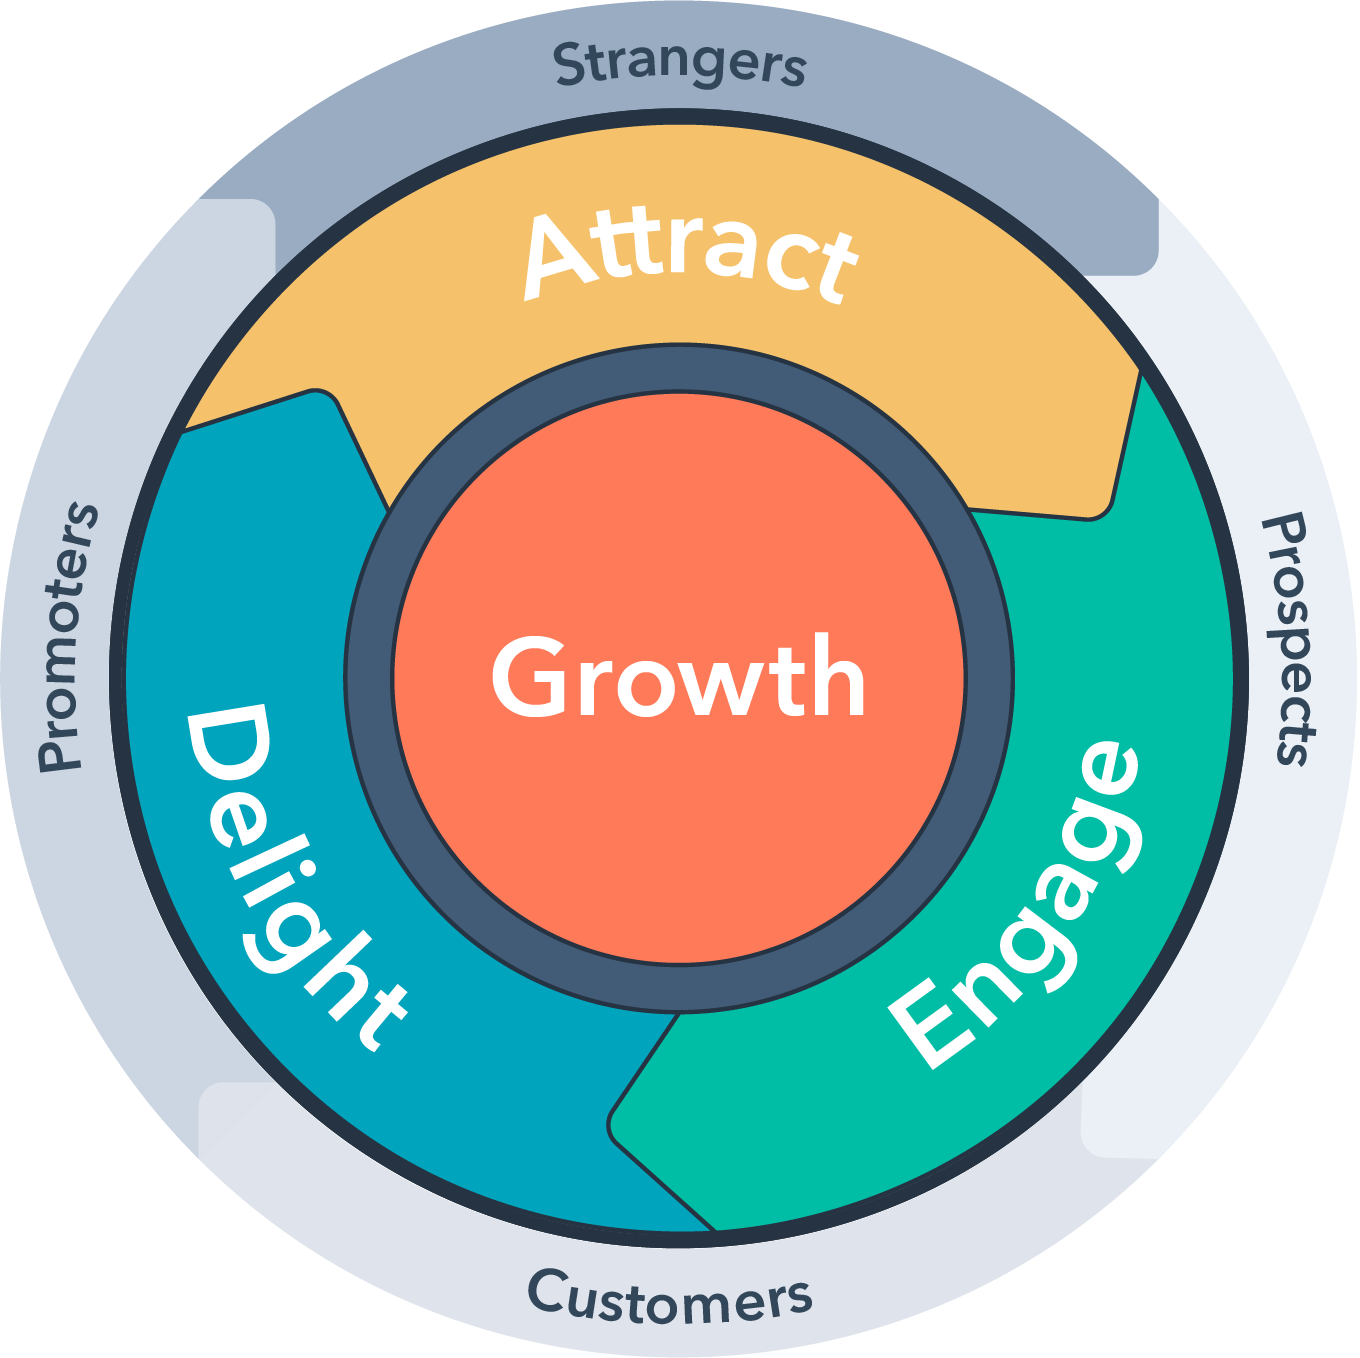
Source: Hubspot
Both “engage” and “delight” phases rely heavily on knowledge sharing, educating, and helping customers get the most out of your product. As long as they are happy and feel well cared for, they’ll continue to pay. Once they start running into problems that they can’t solve or feel abandoned, they leave, and that negatively impacts retention.
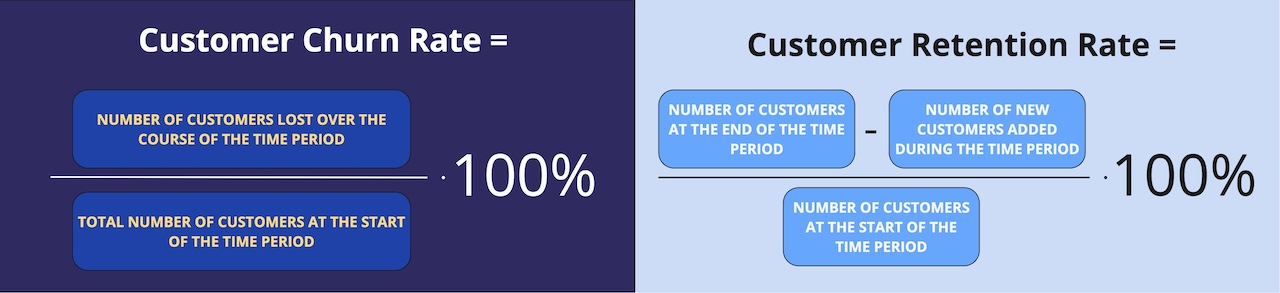
You may also be monitoring the customer churn rate, which is the opposite of the retention rate. No matter which metric you choose, it’s an effective way to assess the health of your customer base.
Similar to CLTV, there are many versions of retention and churn rate formulas. These are the most straightforward ones:
Idea 💡
How do you know whether the customer churn is caused by mismatched marketing messaging or poor customer service?
Quantitative data can only take you so far. Collect feedback from departing users to gain qualitative insights into why they’re leaving and stop guessing. You can implement feedback collection forms into your web app experience with Mouseflow.
10. Marketing Sourced Revenue (MSR) and Marketing Efficiency Ratio (MER)
How much money is your marketing team making for the company?
This is probably the toughest question of all. But you should be able to answer it to secure your budget for the next quarter or year.
The answer will come down to your attribution model. To measure marketing sourced revenue (MSR) following the first-touch attribution model, sum up the revenue generated from leads that originate specifically from marketing channels, such as content campaigns, digital advertising, etc.
Many SaaS teams take a step further and calculate the marketing efficiency ratio (MER) to evaluate the profitability of their campaigns:
This is the primary metric used to assess whether a specific market (or country) is profitable for us. We calculate it as the blended RoAS (return on ad spent) across all our marketing channels in this country, and this essentially tells us whether to scale the budget in the next month, lower it, or even exclude this country from our targeting in case of poor performance.
11. Monthly Recurring Revenue (MRR) and Annual Recurring Revenue (ARR)
There’s one thing all successful marketing leaders have in common: they track monthly recurring revenue (MRR) and annual recurring revenue (ARR) to gauge business growth.
As a health benefit provider to businesses, our pinnacle of growth is obviously MRR and ARR.

“At Artisan, ARR is the holy grail of metrics — it’s not enough for us to track just monthly revenue; ARR reflects the long-term trust and commitment our customers have in our product. It provides a clear indication that we’re successfully reaching and closing qualified leads who see lasting value in what Artisan offers. This metric is crucial in demonstrating our ability to retain customers and generate sustainable growth.”
To calculate MRR, you need to multiply the total number of paying users by the average revenue per user per month. ARR is MRR multiplied by 12.
There’s also a third metric — new MRR — which Usersnap’s Tomas Prochazka monitors closely:
We track new MRR over different time windows to measure growth trends.
New MRR includes revenue from customers who have subscribed to the service for the first time during that month.
Another way to look at your MRR trends is by analyzing the MRR churn rate, that is the percentage of revenue lost to cancellations and downgrades:

At Opinion Stage, we track numerous SaaS metrics, but Net MRR Churn Rate is our holy grail. Reducing this metric is crucial for a healthy SaaS business. A low Net MRR Churn Rate signifies that your higher-paying customers genuinely value your product and remain loyal, indicating a strong market fit.
Mind that none of the experts say they use the metrics as an ultimate measure of their teams’ performance. These are indicators of overall business health and growth trends, but to get a complete picture, they must be combined with the KPIs from the list above.
Which SaaS Marketing Metrics Should You Track?
Choosing the right metrics for your SaaS marketing team is no easier than tracking them.
First, you need to understand your business goals and how your marketing efforts align with them.
Start by identifying key financial metrics that indicate overall success, such as CAC, CLTV, and MRR. From there, drill down to top-level performance metrics like site traffic, conversion rates, lead quality, etc. — just make sure the KPIs are really connected to the financial outcomes you’ve defined earlier.