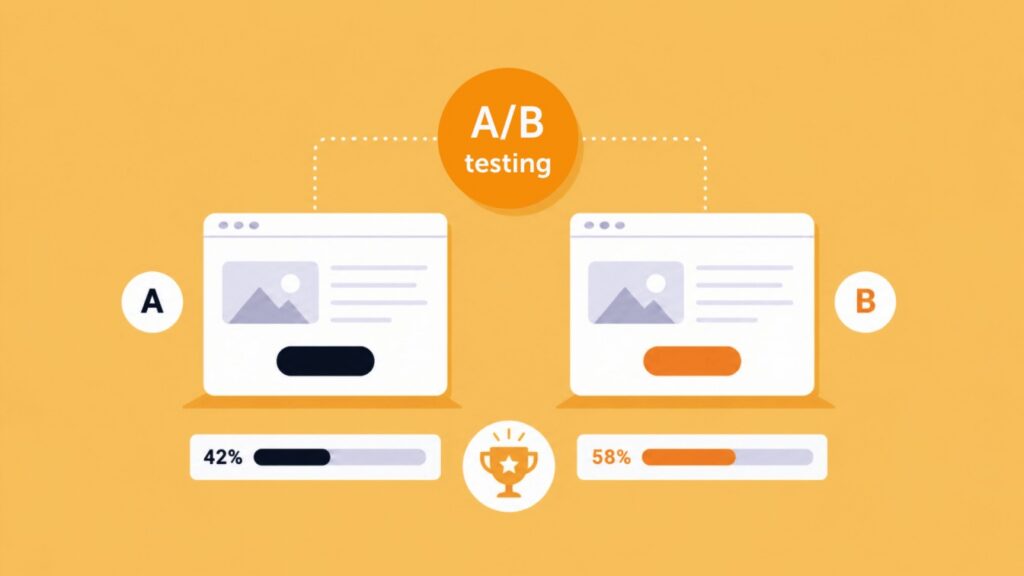
A/B testing is a method of comparing two versions of a webpage to see which one converts better. You show Version A to one group of visitors and Version B to another, track a specific goal, and let the data decide the winner. It removes opinion from optimization and replaces it with evidence.
Your website is never truly finished. User preferences shift, markets change, and the page that converted well last year might be quietly losing you customers today. The teams that keep their conversion rates climbing are not the ones with the best instincts. They are the ones who test.
In this blog, we’ll cover what A/B testing is and how it works, why it matters for CRO teams, what elements you should test, how to build a proper hypothesis and how to combine testing with behavior analytics.
What is A/B testing?
A/B testing (also called split testing) is a simple experiment: you take 2 versions of a page and show each one to a different group of visitors. Version A is your current page. Version B has one specific change, a new headline, a different button color, a shorter form.
You track a goal, such as the number of clicks, sign-ups or purchases, and whichever version hits it more often wins. Real users vote with their behavior, and the data tells you what to keep.
When you pair A/B testing with Mouseflow’s behavior analytics, you go one step further. You don’t just learn which version won, you see why. Heatmaps, session recordings, and funnel data show you exactly where users clicked, hesitated, or dropped off.
Why A/B testing is crucial for CRO teams
A/B testing matters for CRO teams because it replaces internal debate with real user data, reduces the risk of costly redesigns, and creates a compounding record of what actually works for your specific audience.
Testing mitigates risk. Instead of launching a massive, untested redesign that tanks your revenue, you make incremental, data-backed tweaks. Each test is a small, controlled bet with a clear outcome.
It also settles internal debates. When the design team wants a brand new layout and the sales team wants a prominent banner, you don’t need a long meeting. You run a test. The data decides the winner, and everyone moves on faster.
Over time, a consistent testing culture compounds. Small wins stack up. A 5% improvement here and a 7% improvement there adds up to a meaningfully different business by the end of the year.
A/B testing is just one piece of the broader conversion rate optimization puzzle. If you want a fuller picture of how CRO fits into your overall growth strategy, that guide is a good place to start.
What elements should you A/B test?
The best elements to A/B test are the ones that directly influence whether a visitor takes action: headlines, CTA buttons, forms, images, and social proof. Start with high-traffic pages and the elements users interact with most.
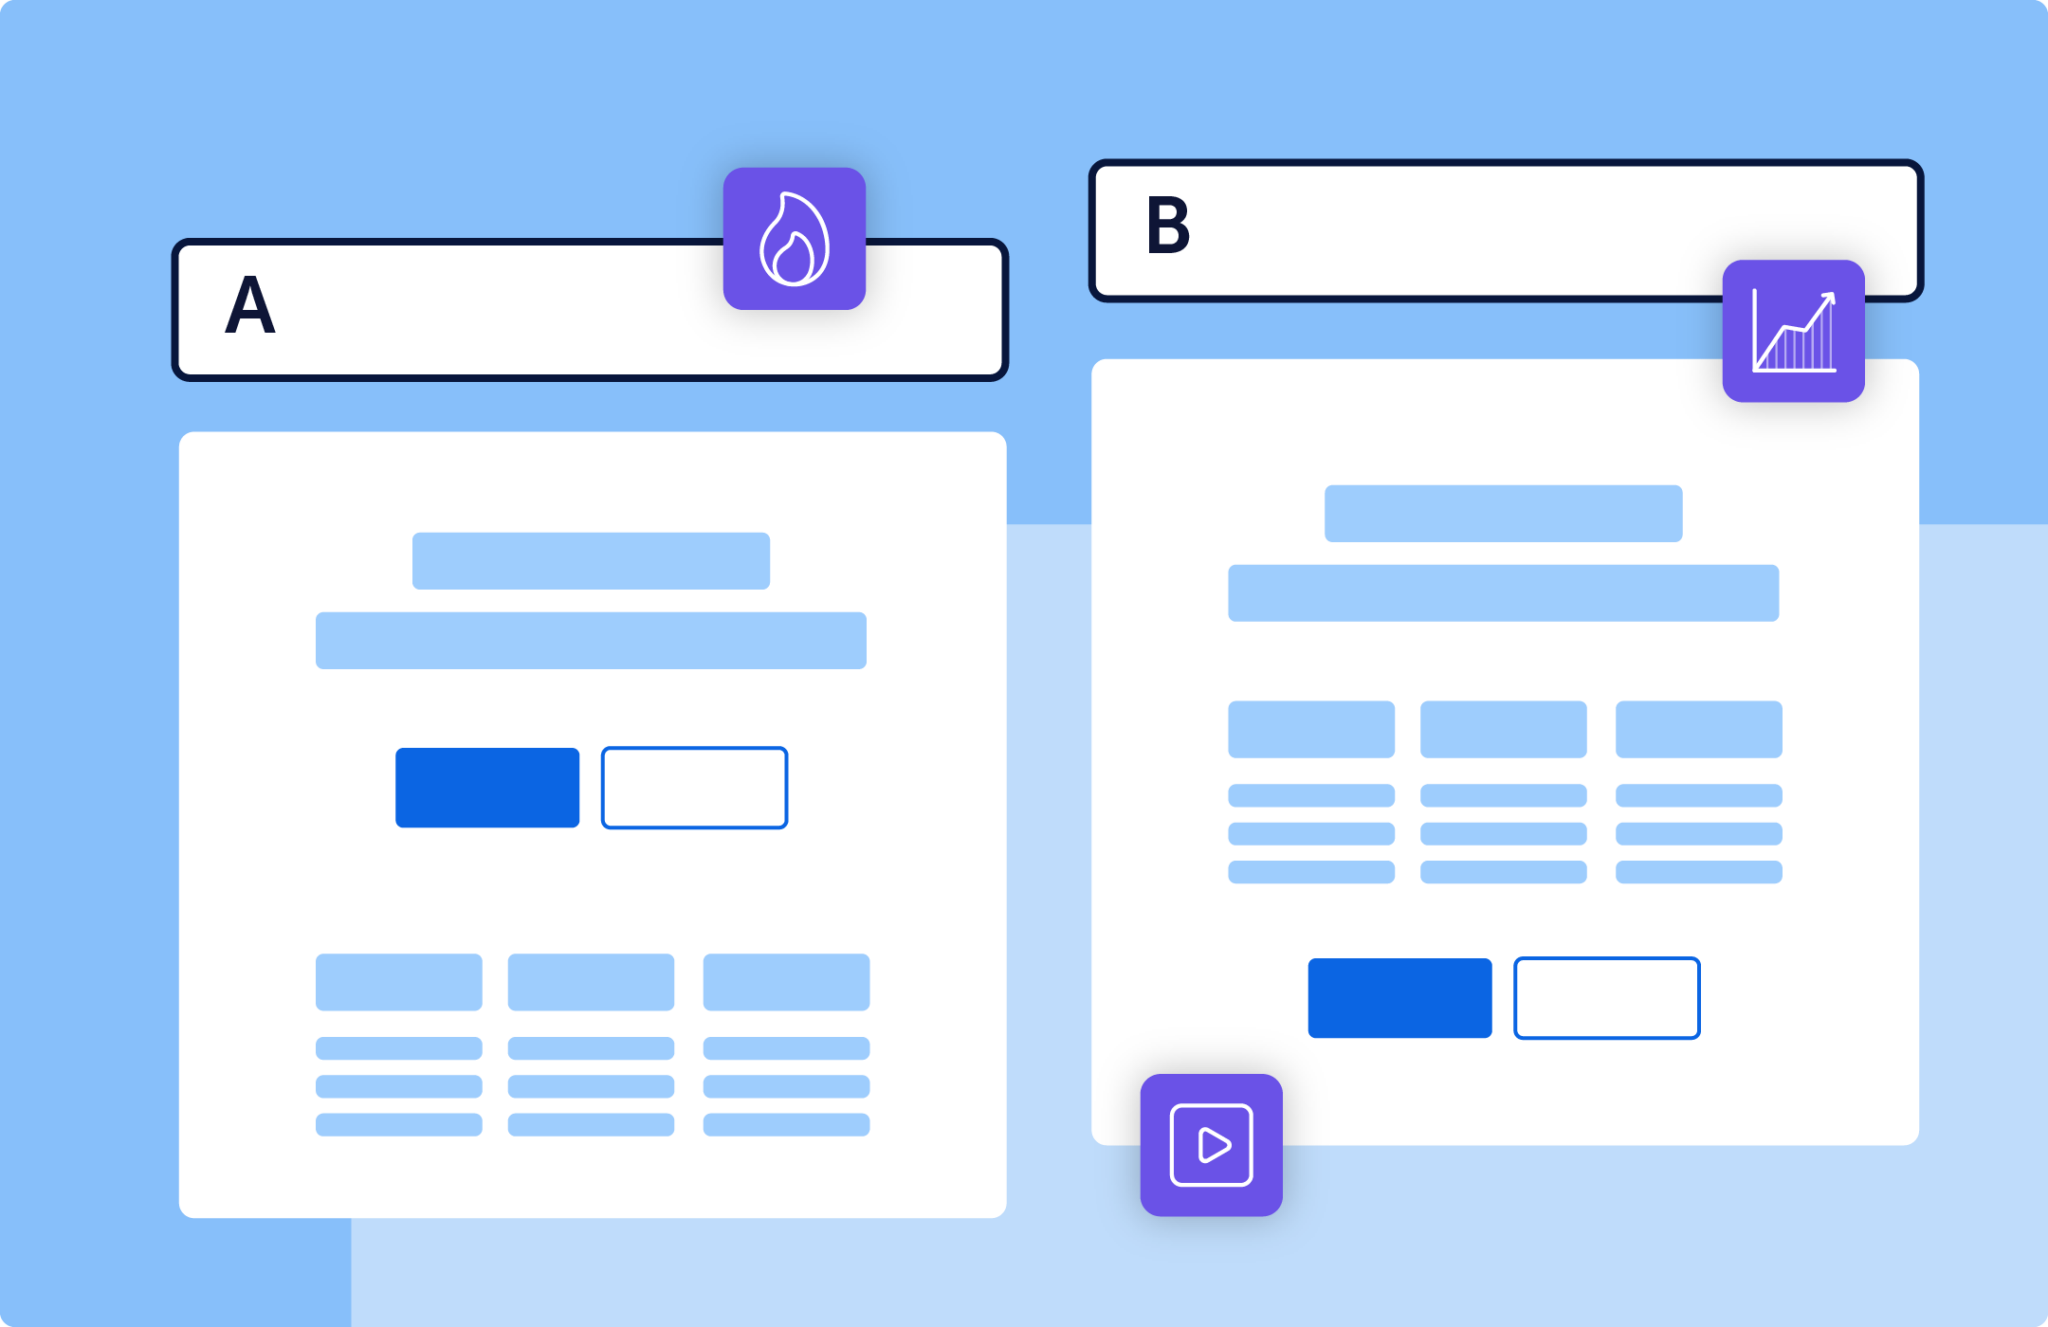
A/B testing in action: comparing two CTA variations to see which one drives more clicks and conversions.
- Headlines and copy. Does a direct headline outperform a clever one? The words at the top of your page set expectations. Test them early and often.
- Call-to-action buttons. Test the color, placement, and exact phrasing. “Start for free” and “Get started” can produce very different results even though they mean roughly the same thing.
- Forms. Compare a multi-step form against a single-page layout. Longer forms often feel like less work when they are broken into steps.
Images and video. See if a product video drives more add-to-carts than a static image gallery. Visual context can do a lot of the selling for you. - Social proof. Testimonials, review counts, and trust logos can significantly influence whether a visitor converts or bounces. If you want to go deeper on this, read our article on using social proof for conversion rate optimization, which walks through real experiments and examples of what actually moves the needle.
Always test one major element at a time so you know exactly what caused the shift in behavior.
Combining A/B testing with behavior analytics
Combining A/B testing with behavior analytics lets you go beyond knowing which version won and understand exactly why it won. That distinction is what turns a one-off result into a repeatable optimization system.
Traditional A/B testing tools tell you what happened. Variant B got a 15% lift in conversions. But they leave you completely in the dark about why.
That is where behavior analytics come in. To analyze user behavior effectively, you need two types of data working together: quantitative data that shows where users drop off, and behavioral data that shows why. Our blog on how to analyze user behavior on your website breaks down exactly how to combine these two data sources into a repeatable optimization framework.
By integrating your testing platform with Mouseflow, you can filter your session recordings and heatmaps by specific A/B test variants.
Did Variant A lose because the new copy was confusing? Watch the session replay. Did Variant B win because the CTA was finally visible above the fold? Verify it with a scroll heatmap.

“Instead of debating, we were watching real sessions together. It helped everyone understand what was working and what needed fixing.”
A good example of this in practice is Mos Mosh, the Danish fashion brand. Working with their Shopify agency Grafikr, the team used Mouseflow to move beyond gut feelings and into real behavior data. They discovered that content spots, full outfit displays spanning the width of the screen, generated significantly more clicks, particularly on mobile where they took up more space and naturally drew the eye. They also found that women shoppers responded more to styling cues, which led to layout adjustments showing products with both front and back imagery so shoppers could evaluate details without clicking through.
What made the difference wasn’t just the data. It was how the team used it together. As Erik Holflod Jeppesen, Founder and Partner at Grafikr, put it: “We weren’t looking to collect more data. We needed clarity. Mouseflow helped us identify exactly where decisions needed to be made.”
Understanding the why turns a single winning test into a repeatable framework for future optimization. That is the difference between a team that runs tests and a team that actually learns from them.
Mouseflow enrich your data with multiple A/B testing platforms:
Read more about our A/B testing integrations.
FAQs
A/B testing compares two full page versions against each other, while multivariate testing (MVT) tests multiple smaller variables simultaneously to see how they interact. Use A/B testing for big structural changes and MVT for fine-tuning once you have a solid baseline.
Run your test for at least one to two full business cycles (14 to 28 days) to account for weekday and weekend traffic variations, and only call a winner once you reach statistical significance. Stopping early is one of the most common ways teams walk away with a false result.
Start with high-impact elements on high-traffic pages. Headlines, call-to-action buttons, and form placements are proven starting points for quick wins. Use your heatmap and session data to identify where users are dropping off or getting confused, and let that guide your first test.
No, A/B testing does not hurt your SEO if done correctly. Google encourages it. Just make sure you use temporary redirects (302) instead of permanent ones (301) if you are testing entirely different URLs, and avoid running tests longer than necessary.
A test result is reliable when it reaches statistical significance, typically 95% confidence or above, with a large enough sample size. A test run on 200 visitors is unlikely to tell you anything meaningful. Most A/B testing tools calculate this for you automatically.