
Most companies want to improve customer satisfaction. Fewer companies are willing to do what it takes to make it happen, a.k.a. conduct proper data analysis to uncover key customer insights.
Yes, we know, for most people data analysis doesn’t sound like the sexiest topic in the world, but it’s essential. Once you learn to analyze customer data, your company’s entire trajectory will change.
In this article, we’ll cover how to use data analytics to improve customer experience. That way, you can connect with your target audience on a deeper level to meet customer expectations, reduce customer churn rate, and boost revenue.

What Is Customer Experience Analytics?
Customer experience analytics (also known CX analytics) is a process of collecting and analyzing customer data to learn about their wants and needs. This information often leads to higher customer satisfaction.
You might be wondering, “How do companies collect this kind of data?” It’s simple: they use customer analytics tools to get feedback and analyze behaviors. These tools have advanced features that gather customer details and turn them into valuable insights.
Why does this matter? Because you can use data analytics to improve the customer experience for your company. Once you do, your brand will enjoy a myriad of benefits …
Benefits of Customer Experience Analytics
Data analytics allows users to understand customer needs, map customer journeys, identify patterns and trends, and otherwise offer an exceptional customer experience.
Let’s talk about each of these benefits in greater detail:
Understanding Your Customers’ Needs
What do your customers want from your company?
Answer that question – and your customer loyalty metrics will explode. Fortunately, there are a couple of ways to learn the answer.
- You can ask your customers what they want.
You’ll get a lot of valuable insights this way. But it’s quite common that customers don’t actually know what it is exactly that they want. “Something great, please! Just show some magic!” So asking them won’t always uncover the information you need.
- Use data analytics. Studying customer behavior patterns will often tell you a great deal about your audience. Even the things they aren’t able to articulate themselves.
For example, with web analytics or behavior analytics you might find that your customers have trouble navigating your website. Or dislike using a specific product feature. Or want to receive more personalized attention. You can find these things out by watching them interact with your company’s website.
These pain points harm customer experience. Fixing them will increase customer satisfaction.
Map the Customer Journey
How do customers discover your brand? And which customer interactions lead to sales?
Once again, data analytics can help you answer these questions. Map the customer journey to pinpoint the channels your audience prefers, friction points they experience, the landing pages that convert best, etc. Then study customer behavior at each crucial junction.
For example, you can start by filling out a table like this:
| – | Awareness | Consideration | Decision | Use | Loyalty and Advocacy |
| Channels | – | – | – | – | – |
| – | – | – | – | – | |
| – | – | – | – | – | |
| – | – | – | – | – | |
| Behavior patterns | – | – | – | – | – |
| – | – | – | – | – | |
| – | – | – | – | – | |
| – | – | – | – | – | |
| Friction points | – | – | – | – | – |
| – | – | – | – | – | |
| – | – | – | – | – | |
| – | – | – | – | – |
Imagine how much more effective your company’s marketing campaigns, sales strategies, and customer support interactions will be when employees have access to these customer data points.
Identifying Patterns and Trends
Once you commit to customer data analytics, you’ll see patterns in customer behavior. Just as important, you can use predictive analytics to forecast future trends.
It makes sense. By tracking all customer interactions on your website, inside your app, on social media, etc., you can determine what your audience responds to. You can then do more of these things while eliminating strategies that don’t convert.
The result? A better customer experience for all who engage with your brand.
Getting Data to Convince Stakeholders
When you map the customer journey, you can identify patterns and trends, as we discussed.
This will give you the customer data you need for improving customer experience. But only if you get approval from key stakeholders first. This is another area that data analytics can help.
You won’t have to approach stakeholders with gut feelings. You can simply show them the cold, hard data you’ve collected and explain why your plan to improve customer interactions will work. This will ensure your plans get green-lit, while moving your company closer to its goals.
What Data Can You Use for Customer Experience Analytics?
Customer data comes in all shapes and sizes. To make things easier, we’ve separated the most important types into three categories: direct feedback, indirect feedback, and product metrics.
Each will help you improve the customer experience. Let’s take a look:
Direct Customer Feedback
This kind of feedback is solicited from customers.
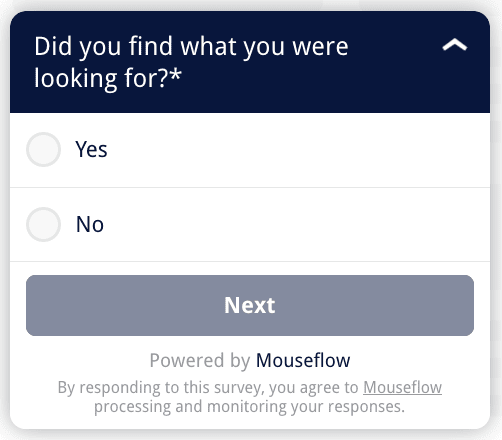
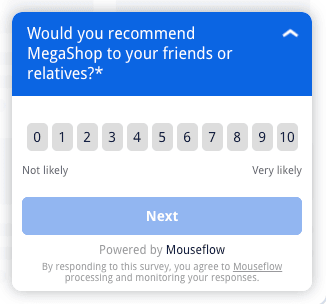
Companies often get it through NPS, CSAT, and CES surveys. But they can also study social media interactions to collect data and gauge customer experience.
Direct customer feedback is valuable because it offers a holistic view of the customer, including their preferences and pain points. As such, it’s an important element of data analysis.
Indirect and Inferred Feedback
This kind of feedback is not solicited from customers, and sometimes doesn’t even look like feedback.
Companies can capture inferred feedback using session replay tools and heatmap tools like Mouseflow. They install the app, then study customer behavior as the customers surf their sites. Social listening tools like Mention (which we use ourselves) can help collect customer data on social networks, too — and that’s an example of indirect customer feedback.
Indirect customer feedback is valuable because it helps organizations understand how customers interact with their assets, evaluate customer experience, and predict future trends.
📖Read more about types of user feedback.
Product Metrics
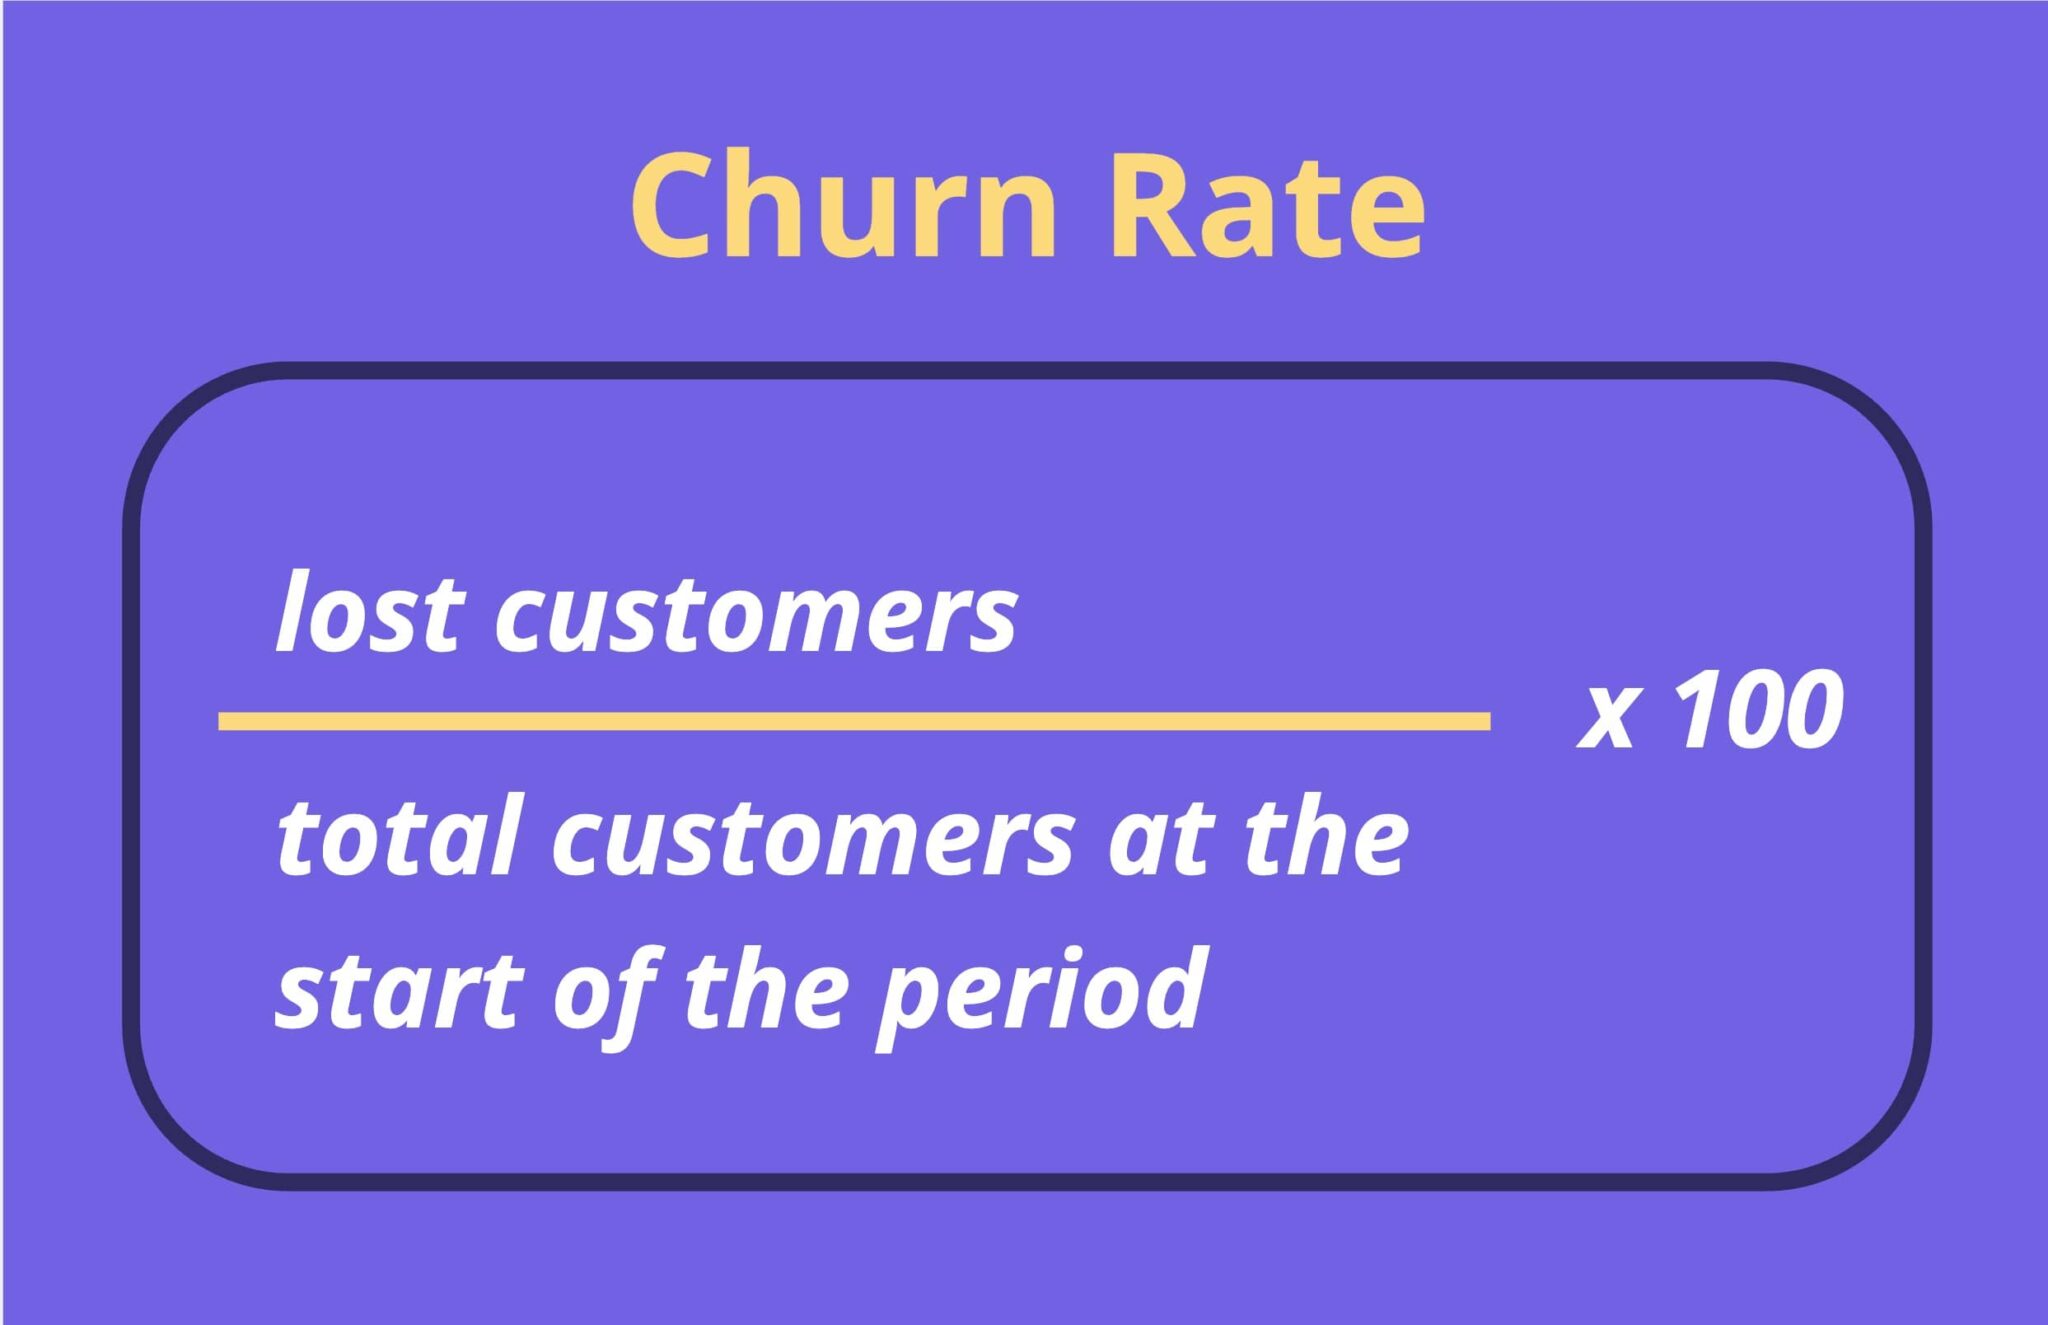
Certain product metrics can also reveal customer experience data. KPIs like churn rate, renewal rate, and customer lifetime value (CLTV) can tell you a lot about your customers.
- Churn Rate: The percentage of customers who stop subscribing to a service. High churn rates are usually caused by poor customer satisfaction. To reduce churn, improve the customer experience you provide to your target audience.
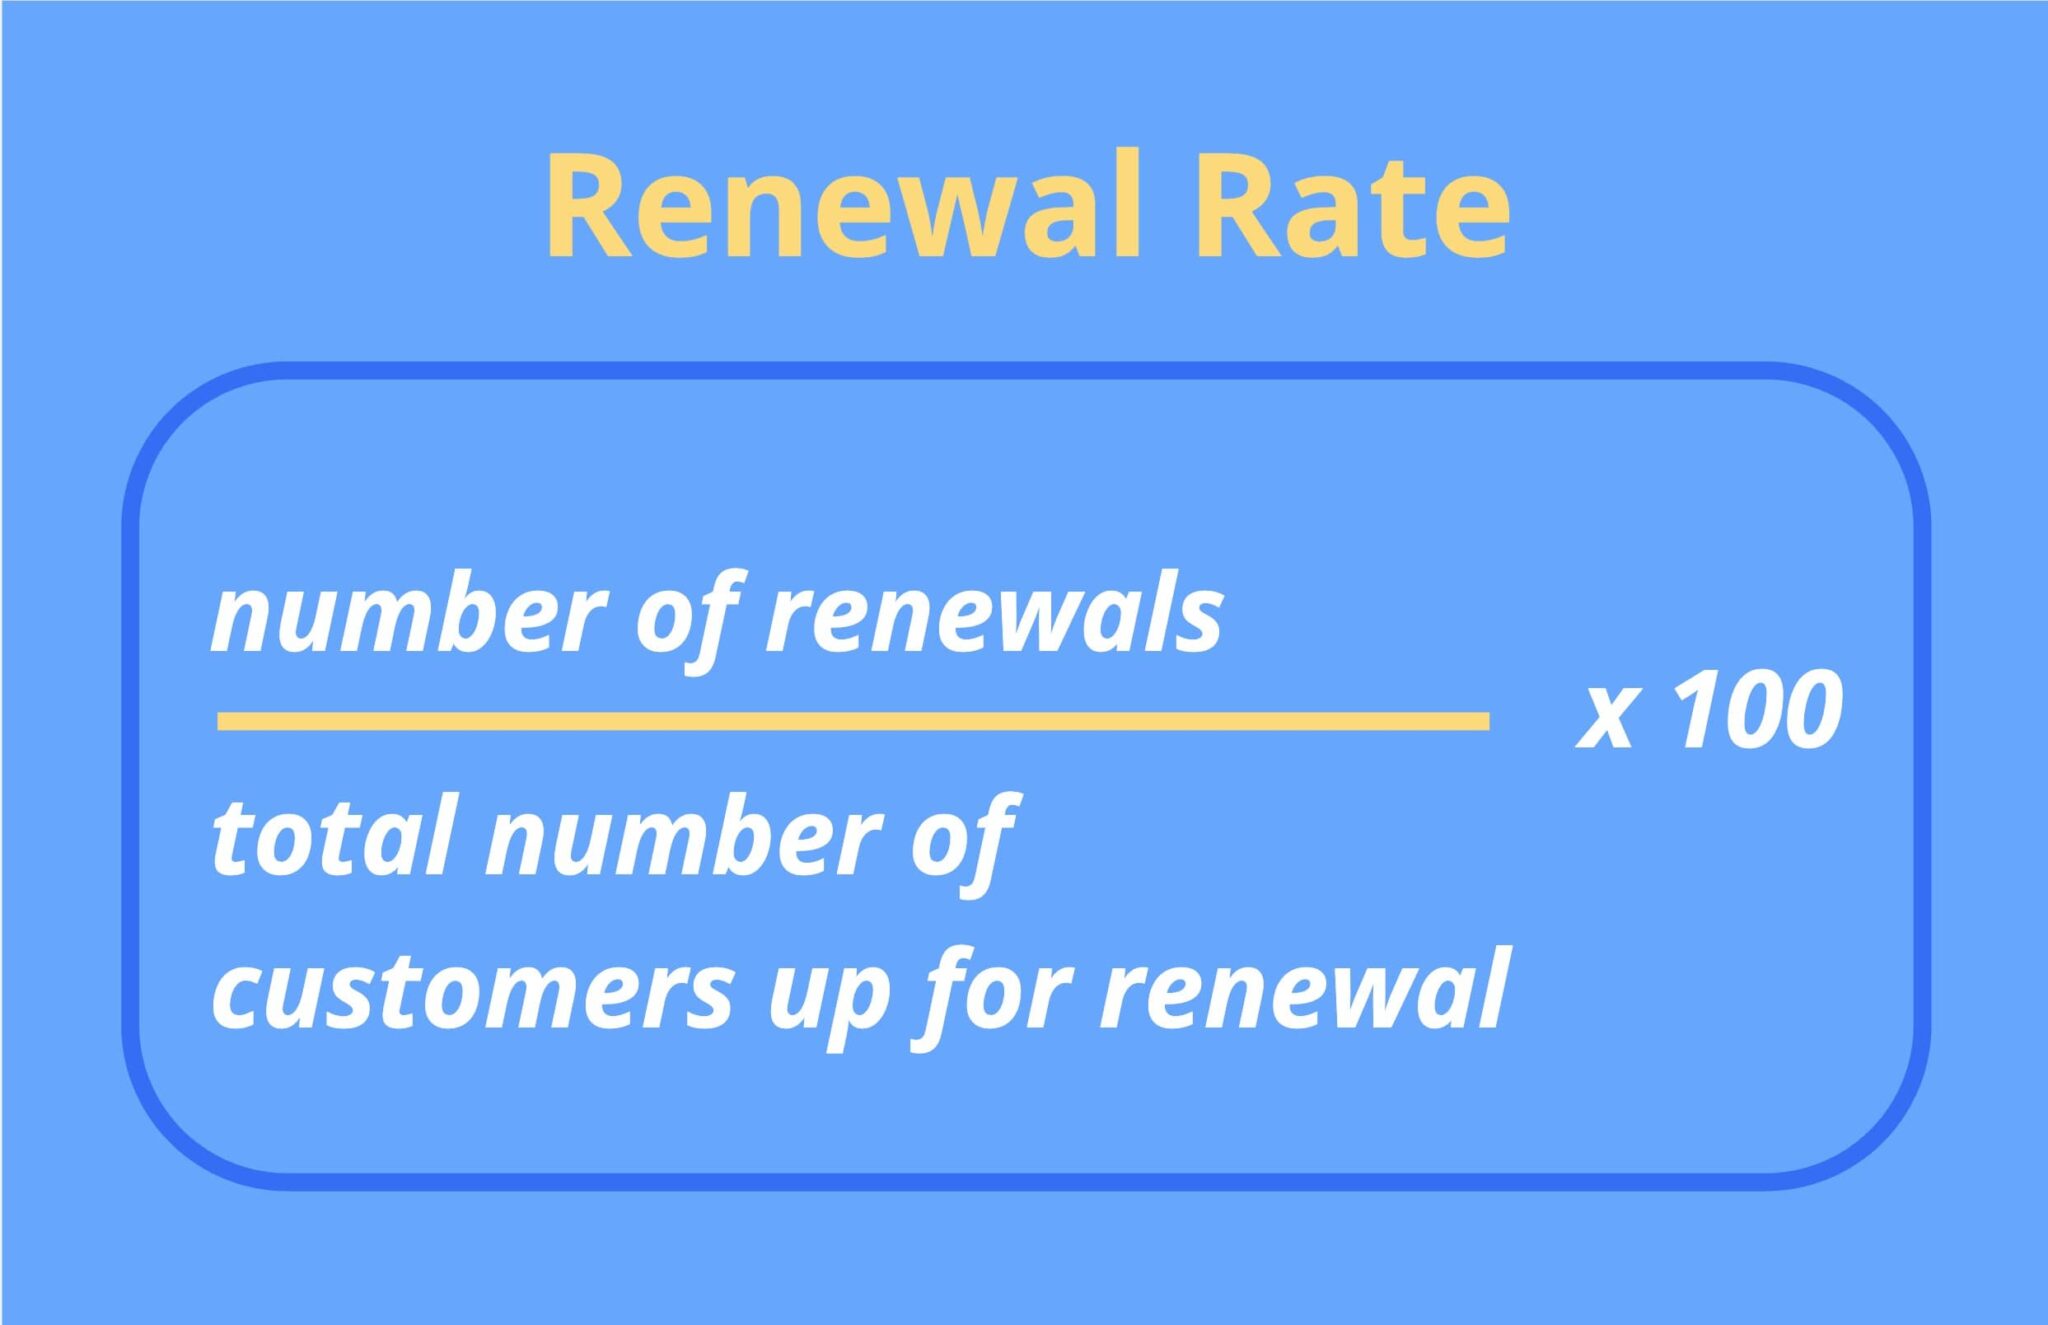
- Renewal Rate: The percentage of customers who renew their contract at the end of their subscription period. High renewal rates suggest strong customer loyalty.
- CLTV: The revenue a company generates from a customer over the life of their account. An effective customer journey can lead to impressive CLTV numbers. After all, most customers who enjoy buying from a company will continue to do so.
Customer analytics tools can help you track the metrics above. Doing so will help you evaluate your company’s relationship with existing customers and develop strategies to improve it.
Customer Experience Analytics Use Cases
You might be thinking, “This all sounds great. But what can I actually do with customer experience analytics?”
It’s a great question. Here are six specific use cases:
1. Track Customer Behavior
Data analytics will help you track customer behavior.
Which pages on your website receive the most traffic? Which product features are most popular? The answers to these questions will help you determine what customers respond to.
You can then use this information to improve failing web pages and product features. This can lead to greater customer satisfaction and higher revenue. Case in point: a SuperOffice study found 86% of buyers will pay more for a great customer experience.
Mouseflow, a customer experience analytics tool, makes it easy to track customer behavior on your website.
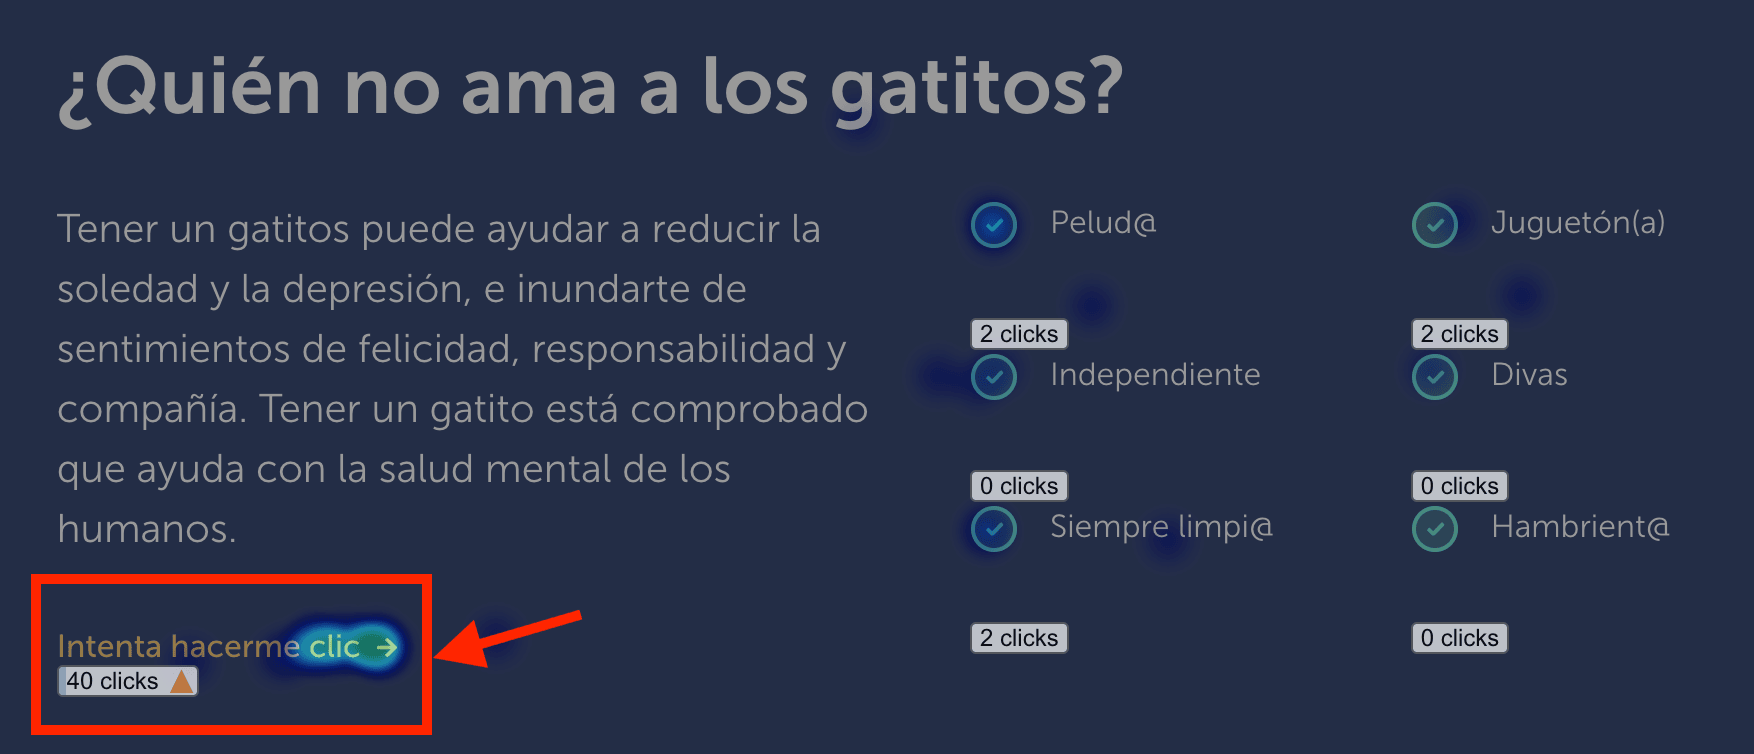
The heatmap tool, for example, will tell you how far visitors scroll, which buttons they click, how long they stay on each webpage, and even what captures their attention. These valuable insights will help you turn your website into a revenue-generating machine.
2. Identify Friction Points
Does your website and/or product frustrate your customers? If it does, you won’t be able to provide a stellar customer experience to your target audience.
Thankfully, data analytics can help you identify friction in the customer journey and remove those pain points. This will increase satisfaction when customers interact with your brand.
Once again, Mouseflow can help you collect customer insights to excel in this area.
Take Mouseflow’s Friction Score feature, for example. With it, you can pinpoint frustrated users through session replay and heatmap data.
In the “Heatmaps” section, Mouseflow allows you to sort your website pages by Friction Score, so that you can start looking at pages where users struggle the most.
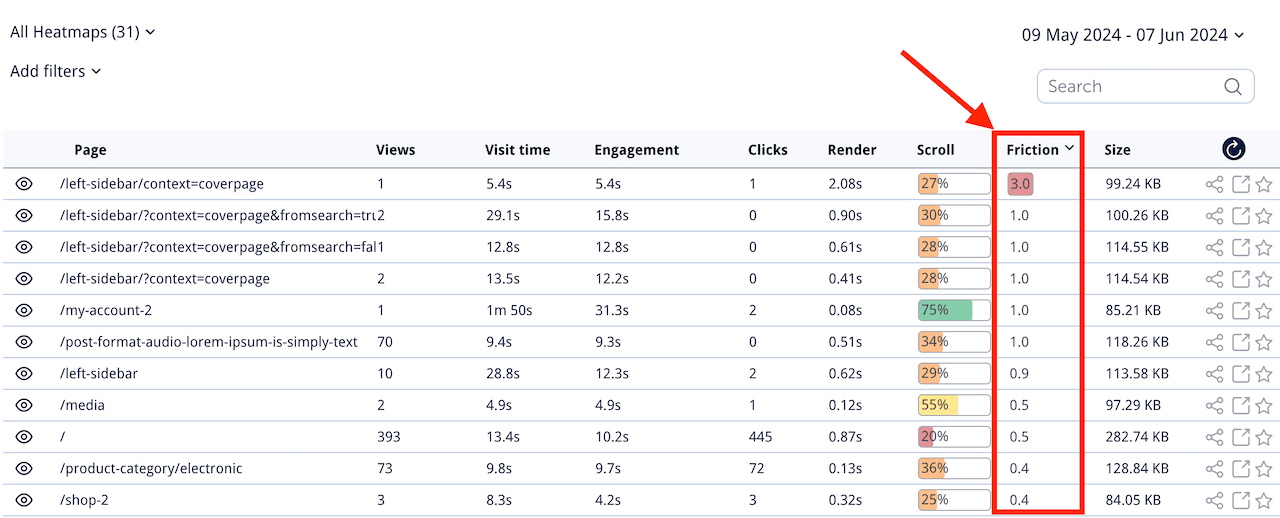
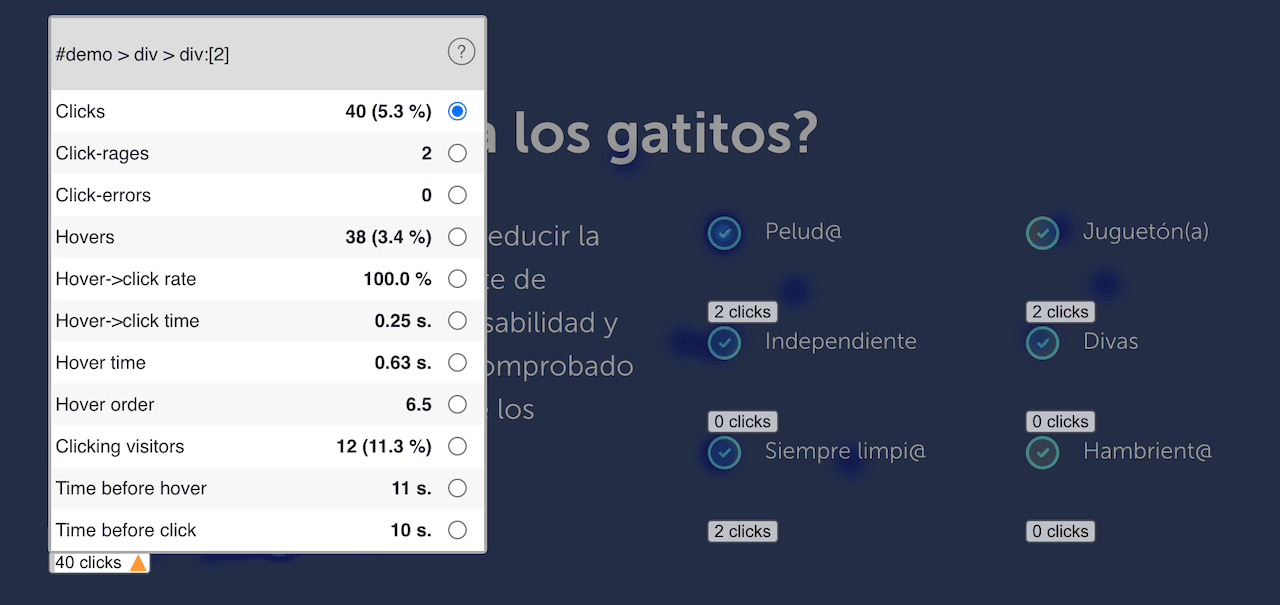
On the click heatmap, you’ll see an exclamation mark next to elements where friction events happened.
Hover your cursor over it, and you’ll see a lot of additional information that’ll help you understand what’s happening.
3. Personalize Customer Interactions
Customer experience analytics will help you personalize the customer journey, too.
This typically happens via segmentation. By separating customers into groups based on shared characteristics, you can offer more customized experiences.
For example, you can study the way customers interact with your SaaS platform. Armed with this knowledge, you can highlight specific features based on behavior.
(Note: Mouseflow and other session replay tools allow users to filter recordings to discover trends. This kind of data makes it easy to segment customers.)
Looking for another way to segment customers? Use customer feedback. For instance, customers that qualify as “promoters” after taking an NPS survey can receive different post-survey messages than those that qualify as “detractors”. This simple tactic will help you learn about your target audience, increase customer satisfaction, and boost customer loyalty.
Companies that excel at personalization generate 40% more revenue than other brands. So, this strategy can impact your company’s bottom line in a significant way.
4. Reduce Customer Churn and Drop-Offs
Do you work for a subscription-based business? Then you know that minimizing customer churn is paramount to success. If you can’t keep subscribers, your company won’t grow.
Of course, not every business uses subscriptions. Companies that deploy transactional models might not need to worry about churn. But they definitely need to pay attention to drop off rate, i.e. the percentage of customers who abandon a process before completing it.
Customers who type their name and email into a sign-up form on your website, but don’t click the “subscribe” button drop off. The same is true for customers who peruse your online store, add items to their cart, but navigate to another website before buying.
Customer churn and drop-offs can happen for a variety of reasons. But more often than not, they’re caused by frustration. Your customers want to sign up to your email list and buy your products, but something prevents them. If you figure out what that something is, you can fix it.
Data analytics tools like Mouseflow help users identify website-based frustration. Our platform will give you access to session replays, heatmaps, and user surveys. Each will help you learn what makes customers angry. You can then remove these things and boost customer retention.
5. Increase Customer Engagement
Speaking of customer retention …
According to Deloitte, customers who have positive experiences are likely to remain customers for five years longer than customers who have negative experiences.
One of the best ways to give customers positive experiences is to engage them. This can happen in a variety of ways. For example, you can communicate your company’s values on your blog. Or interact with customers on social media. Or send personalized email campaigns.
You can also optimize your website to increase customer engagement. Tools like Mouseflow will help you conduct deep data analysis. Use our platform to learn how far website visitors scroll, what they click on, and what captures their attention. Then adjust your web pages accordingly.
Mouseflow will also help you collect customer feedback via NPS, CES, and other surveys. The information you glean will tell you what customers like and dislike about your brand.
6. Analyze Your Competitors
Last but not least, study the competition.
How do similar brands connect with their target audience? What do they do to improve the customer experience? And critically, do these things work as intended?
While data analytics tools are often used to parse one’s own customer data, they can also help you learn from your competitors. Of course, you don’t need fancy software to complete this task.
You can read reviews on sites like Google, G2, and TripAdvisor. (Or whichever sites pertain to your industry.) You can also read comments on social media.
Competitive intelligence will help support your customer experience analytics strategy. Don’t miss this opportunity. Analyze your competitors for deeper insights.
📖Read more about competitor analysis
Win With Customer Experience Analytics
After reading this article, you know how to use data analytics to improve customer experience.
Once you implement the tips above, your brand will connect with its target audience on a deeper level. Doing so will almost certainly lead to greater revenue and success. Win!
So, what are you waiting for? Start collecting and analyzing customer data today. The time and effort it takes will be more than worth it — we promise.