
On average, customers stay with a B2B SaaS product for around 24 months, and then they leave.
But churn isn’t inevitable. In many cases, it’s the result of friction, confusion, or unmet expectations throughout the user experience.
That’s why reducing churn isn’t just about customer success – it’s about improving how users experience your product from the very beginning. UX plays a critical role in helping users find value faster, stay engaged, and continue using your product over time.
In fact, churn reduction is a key part of a broader SaaS marketing strategy, where acquisition, conversion, and retention all work together to drive sustainable growth.
In this post, we’ll look at a practical anti-churn toolkit and how UX improvements can help you reduce churn before it even begins.
What Is Churn?
Churn is the rate at which a business loses customers. A high churn rate means that many people who used to be customers are no longer purchasing products and services.
Too many businesses focus all their attention on acquiring new customers and neglect existing customer relationships, seriously impacting revenue and profit margin. There’s a famous example of Salesforce, which in 2005 had a monthly churn rate of about 8%. Basically, every customer was leaving in less than a year. If it weren’t for a man named David Dempsey, who warned Marc Benioff about the problem, Salesforce could have sunk by now.
Depending on the industry, retaining existing customers is from 5 to 25 times cheaper than finding new ones. (Source: Harvard Business Review)
Customers churn for many reasons, but churn can be broadly split into two types:
- Voluntary churn
-
- is when customers actively choose to stop using your products and services, often due to a poor user experience, or finding a better alternative. Improving UX and checking in with customers to learn what they think about your product or service can help reduce voluntary churn.
- Involuntary churn is when customers stop using your products and services without a conscious decision. This can often be attributed to technical reasons and is easier to fight than voluntary churn.
Measuring Churn
You can track and measure churn over a given period with this formula: (Lost customers ÷ total customers at the start of period) x 100%
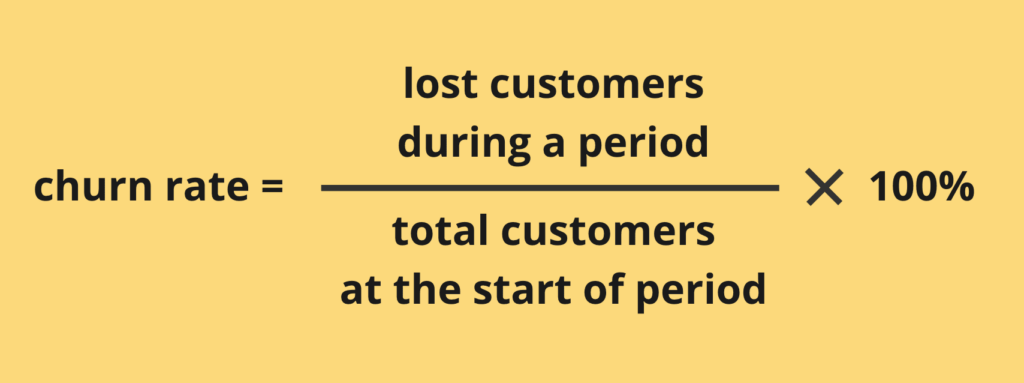
For example, if your business had 150 existing customers on September 1st, but lost 13 by September 30th, you divide 13 by 150, and multiply by 100.
In this scenario, your monthly churn rate for September was 8.67%. That’s a lot, by the way.
The Impact of Churn
Churn rates vary according to sector, but Recurly Research cites a benchmark churn rate of 4.91% for B2B companies and 6.77% for B2C companies.
A manageable churn rate depends on many factors, including the products and services you offer, and the size and maturity of your business. However, it always helps to consider churn in terms of revenue.
An average monthly churn of 8% means a monthly revenue loss of 8%, which when compounded over time, has a huge impact on annual revenue. For example, if your average monthly revenue in 2022 was €200,000, and your average monthly churn during the same period was 8%, your total revenue loss for 2022 due to churn was €192,000.
Theoretically, you can forecast churn based on data. But once you try churn forecasting, you quickly end up drowning in data science, customer health metrics, machine learning, and a lot of math, so that’s a little bit out of our scope. But if you want to dig into that (or have a spare data scientist to dedicate to this task), there’s a book called Fighting Churn With Data dedicated exactly to this topic.
Unfortunately, churn can’t be reduced to zero. Even with your best efforts, some customers would still choose to leave. But you can try to minimize it. The best bet is to fight churn before it happens, by leveraging web analytics tools to diagnose UX issues and address them quickly and precisely.
Let’s take a look at how one can prevent or reduce churn using the example of Supacart. Supacart is an eCommerce store. It’s a real store, but in reality it’s named differently – we’re calling it SupaCart here for privacy purposes.
Identifying Causes of Churn: Supacart Case Study
Supacart had a big problem. After one year in business, their average monthly churn rate was 8.2%, way above the average 6.77% that Securely Research states for B2C companies. But why? The prices were very competitive, the customer reviews were great, and so were influencer endorsements. But the customers kept leaving.
Supacart did what many businesses do. They panicked, and rolled out “quick fix” solutions, driven by assumptions, not data:
- Discounts: Thinking pricing might be an issue, Supacart started offering 5% and 10% discounts on their best selling products. This resulted in a temporary spike in sales, but their churn rate still hovered around 8%.
- Rewards program: Supacart introduced a loyalty scheme, awarding points to returning customers for each purchase. Despite having hundreds of sign-ups, the program failed to reduce churn rate significantly.
- Improved customer support: Supacart hired three additional customer support staff, providing 24/7 assistance to their customers. This move was slow and expensive and resulted in reducing churn by only 0.4% after two months.
Diagnosing the problem
Supacart finally tried Mouseflow’s Friction Score and User Feedback tools. The feedback was illuminating. Embedding user feedback surveys at key touchpoints revealed that customers were overwhelmed by the number of steps and questions in the checkout process, despite liking the products on offer.
High friction scores also revealed an increased occurrence of mouse-out during the checkout process, where customers were overwhelmed by too many upselling pop-ups. Customers were also frequently rage-clicking on UI elements resembling buttons that were in fact not clickable. Many customers simply abandoned their carts halfway through the process, frustrated and unmotivated.
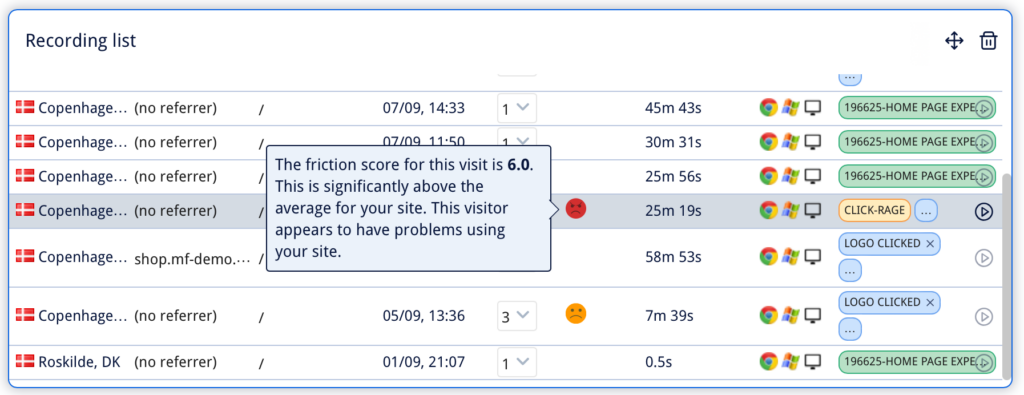
Session recordings and friction scores reveal how users face problems during their experience on your website. You can filter recordings to deep dive into problematic sessions with high friction scores.
The solution: churn reduction tactics
This time, Supacart had real data about the reasons behind churn on their hands. So, they did what their users wanted:
- simplified the checkout flow, cutting the number of steps from 8 to 2,
- swapped out upselling pop-ups for ads lower in the content hierarchy,
- ensured that there was no ambiguity in UI elements,
- repositioned primary call-to-actions using Mouseflow’s Website Heatmaps as a guide.
These changes took only two days to implement, but to Supacart’s delight, they resulted in a 6% lower churn rate in the three months following implementation.
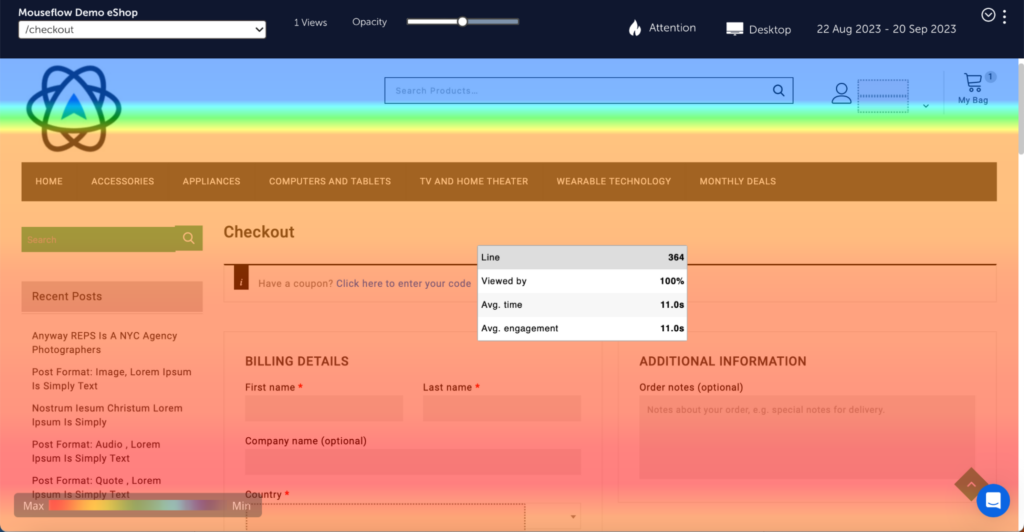
Attention Heatmapsshow where customers are most and least engaged when navigating your website, so you can strategically position primary call-to-actions to increase conversion and reduce churn.
6 Ways To Fight Churn With UX
If Supacart could do it, you can do it too. Here are the six ways you can reduce churn:
- Gather user feedback: Churn is often a symptom of misunderstood or unknown UX issues. Actual user feedback, collected at the right moments, is one of the most effective ways to uncover these issues, whether it’s poor onboarding, confusing navigation, or overcomplicated checkouts.By implementing targeted surveys at key points in the user journey, you can gain valuable insights into what frustrates users, what prevents them from achieving their goals, and what ultimately drives them to leave. For a deeper understanding of how to structure this process, see our guide to user feedback.Is gathering user feedback expensive? No.
Will you need to hire a UX researcher or designer? Not necessarily.With the right setup, feedback collection can be automated and integrated directly into your product or website experience, helping you continuously identify and resolve issues before they lead to churn. - Measure, measure, measure: UX metrics that can warn you about potential churnSo you’ve already got a simple formula to measure customer churn rate in your business: (Lost customers ÷ total customers at the start of period) x 100.Once you know what your churn rate is, you can start diagnosing the UX issues that cause it with these handy metrics:
- Customer satisfaction score (CSAT): Surveys and feedback forms can ask customers how satisfied they are on a scale of 1-10. A decreasing satisfaction score often signals churn issues. Just like with friction score, it makes sense to pay special attention to cases where previously satisfied customers became less happy all of a sudden.
- Net promoter score (NPS): This UX metric gauges how likely customers are to recommend you to others. A low NPS also points to dissatisfied customers, meaning you need to dig deeper to discover causes.
- Task success rate: This measures how often customers complete specific tasks on your website without errors, for example logging in, or searching for a specific item. If customers are struggling to complete tasks that help them achieve their goals, they may leave to find a more user-friendly alternative.
- Time on task: Customers are in a hurry, and measuring how long they take to complete critical tasks helps identify ways to optimize their experience and reduce frustration. For example by cutting the number of steps in critical user flows, like Supacart did.
- Error rate: This helps monitor the number of errors customers encounter when navigating areas of your website. Nothing drives customers away more than unnecessary friction caused by errors due to poor UX.
- Do A/B testingA/B testing compares two versions of a page to identify which performs better. Usually these versions have either one major difference in the overall experience, or even a small individual UI element change, like altering a call-to-action button. By changing properties like colors, copy, or placement of elements, you can track which version is more effective in retaining customers.For example, Supacart A/B tested two screens using Mouseflow and Optimizely for the final step of their checkout process, to find out which resulted in the lowest number of abandoned carts. By making changes based on data-driven insights, instead of assumptions, you can save time and resources, create a better customer experience, drive revenue, and lower churn rate.
- Automate By reducing repetitive tasks and automating processes, you can help customers achieve their goals when using your products and services with minimal effort. But first, you must understand customer behaviors. Automated personalization and one-click processes are two examples of automation that help retain customers.
- Automated personalization means tailoring experiences based on customer preferences, to reduce friction and increase satisfaction. For example, Supacart gathered data on customers’ past purchases, and recommended similar or supplementary products for returning customers each time they visited.
- One-click processes reduce customer flows to a single click. “One-click buy” buttons are a highly effective example, reducing cart abandonment rates, and preventing churn.
- Improve onboarding There’s an old saying “you never get a second chance to make a first impression”. This applies to customer experiences too. Simple, intuitive onboarding creates loyal customers, whereas complicated onboarding with no clear path drives customers away before they’ve converted. By guiding customers through your products and services highlighting benefits and features, you help them make the most out of you offering – and increase the chance of them sticking. Once again, effective onboarding experiences rely on understanding customer needs and behaviors, uncovered using web analytics.
- Simplify, alwaysAt the heart of every great customer experience is simplicity. The less cognitive load customers have to face to achieve their goals, the more satisfied they’ll be.Unfortunately, overly complex and busy website experiences are common, confusing customers, and contributing to high voluntary churn rates. By prioritizing features customers genuinely need like Supacart did, you can eliminate unnecessary complexity, creating elegant, seamless experiences that retain customers, and keep your churn rate low.
Your Anti-Churn Toolkit
Mouseflow offers a bunch of tools that help you identify why customers leave your website, protecting your business’ revenue and preventing churn, before it happens.
- Mouseflow’s Friction Score quantifies customers’ level of frustration when using your website, identifying specifically where they’re struggling and the severity of their frustration at that moment in their journey. This enables you to precisely convert customer frustration into revenue-driving opportunities, fighting churn head-on.
- Mouseflow’s Conversion Funnel Optimization Tool helps identify where customers tend to drop off in the onboarding process, allowing for refinements in those specific areas.
- Mouseflow’s User Feedback Tool helps capture customer feedback at the right moment in their experience. Wondering why customers are not converting at a critical touchpoint? Trigger an on-page feedback survey after 10 seconds, and get immediate insights to help you increase conversion.
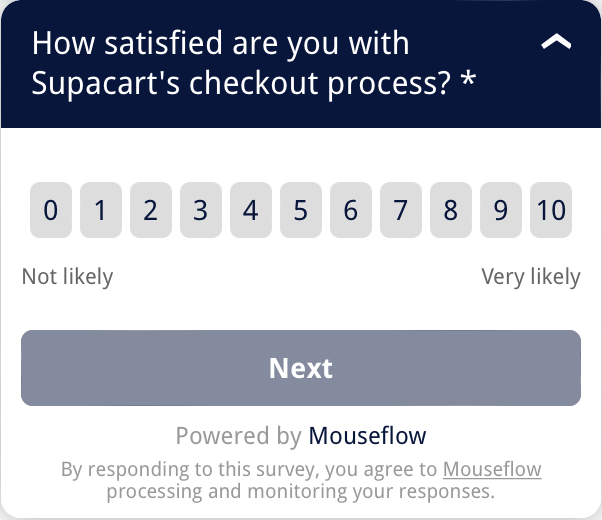
Deploy user feedback surveys at critical touchpoints. Want to dig deeper? Customize your survey’s logic according to customer responses to discover why certain customers are unsatisfied.
- Mouseflow’s Session Recording Tool helps step into the customers’ shoes and uncover problems in their experience that are hard to find otherwise.
Conclusion
Customer churn is the rate at which businesses lose customers, and can significantly impact profitability. While many businesses emphasize the importance of customer acquisition, it’s also important to invest in customer retention.
Churn can occur for a number of reasons. Customers can leave voluntarily because of poor UX (user experience), or involuntarily due to technical issues. You can address both. It requires a proactive approach, with a focus on improving customer experiences through data-driven decisions.
But first, you need systems to gather this data in place. Behavior analytics tools like user feedback prompts and heatmaps or session recordings help businesses pinpoint and rectify UX issues causing churn, just like Supacart did in the case we described in the beginning of this post.