
Running an ecommerce business means constantly deciding what to improve next: product pages, checkout, customer service, fulfillment, inventory, or the overall website experience.
The problem is that not every improvement has the same impact.
Ecommerce KPIs help you understand where performance is strong, where growth is slowing down, and where your time and resources are most likely to make a difference. They turn vague goals like “increase sales” or “improve the customer experience” into measurable signals you can actually act on.
In this article, we’ll focus on 11 foundational ecommerce KPIs across website UX, customer service, and fulfillment. Together, they give you a practical starting point for measuring performance, prioritizing improvements, and building a stronger foundation for ecommerce website optimization.
User experience KPIs for ecommerce websites
Learning how your visitors experience your site and where they are experiencing friction is the first step to smoothing out the process. But how can you know what they’re experiencing?

Through a combination of a heatmaps and live recordings of their sessions, you can see any elements they’re trying to interact with, what they’re trying to do, what they’re not accessing, and where exactly they leave – and through that activity, you can see which KPI(s) are being affected. Here are some important user experience ecommerce KPIs you’ll want to measure with ecommerce website behavior analytics
1. Cart abandonment rate
Actual data on cart abandonment tends to fluctuate, but the Baymard Institute gives us an average rate collected from 44 different studies: 69.8%. There are, of course, a myriad of reasons why a shopper might abandon their cart. You’ll never get that percentage as low as you want it (0%, of course), but there are absolutely ways you can improve the user experience that will improve your cart abandonment rate.
Some of the top reasons for cart abandonment are:
- Unexpected costs or fees. This can be anything from an unexpected shipping charge to a coupon code that doesn’t work.
- Required account. If you don’t allow guest checkout, you may be losing a lot of customers at this step.
- Long checkout process. Are your customers leaving after the second page? Third page? A better question: why does your checkout process have so many pages?
2. Engagement rate
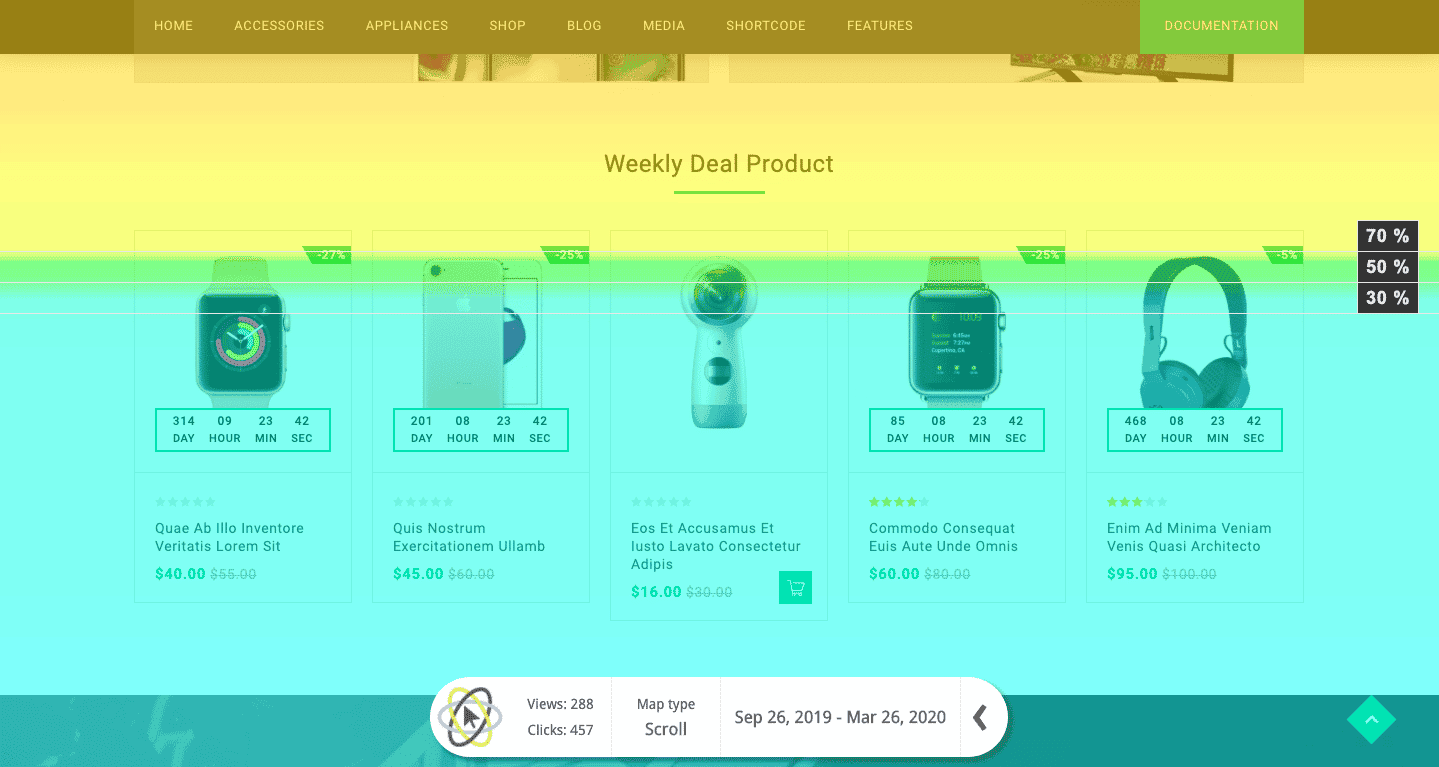
Knowing how and how much your visitors are engaging with your site is crucial to understanding which elements are working, and which ones aren’t. Engagement includes activity, clicks, movement, scrolling, and typing, and heatmaps are a great way to see just what your visitors are engaging with.
If you have a call to action button that you really want them to click on, for example, but your engagement rate is lower than you’d like, you can look at the heat map for that page. If the button is halfway down the page and forces the customer to scroll far past the fold, you can move the button to improve your engagement.
Engagement rate can actually be broken down even further into more granular measurements:
3. Scroll depth
Scroll depth, in essence, is how far down the page your users are scrolling down.
It can help you determine where the average fold line is, so you can determine the best placement for your most important content: calls to action, important information, etc. This is most useful when you’re trying to improve conversions on that specific content, because you can figure out where to put it and just how many of your visitors are even seeing it.
4. Visit time
It’s pretty self-explanatory, but visit time will tell you how long a visitor spent on your page. What isn’t self-explanatory is what that means for you.
Knowing how much time someone spent doesn’t matter if you don’t have a specific goal to connect it to. For example, you may want them to spend a longer amount of time on an in-depth blog post, and a shorter amount of time on your landing page (assuming that they move forward to another part of your site).
If customers aren’t behaving the way you wanted them to, a live recording of their visit can help you uncover what they were experiencing, and guide you towards what you need to fix.
Reviewing heatmaps and session recordings can tell you even more about what, specifically, users found valuable and what they passed right over.
Read more about content engagement, other metrics to track it and best practices to increase it.
Customer service KPIs for ecommerce websites
Happy customers are not only repeat customers, they’re your best marketing tool. So this is our ultimate recommendation for a customer service KPI:
5. NPS (Net Promoter Score)
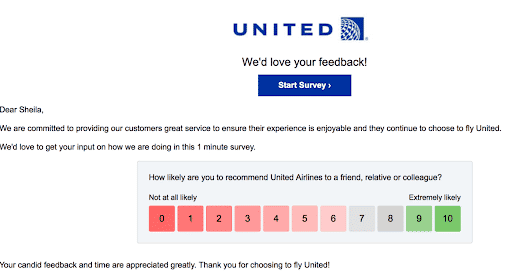
A net promoter score is a great litmus test for how happy your customers are. To calculate it, you need to ask customers how likely they are to recommend your business to family and friends – anyone who answers between 1-6 is a detractor, 7-8 is passive, and 9-10 are the promoters. Then you subtract the percentage of responders that are detractors from the percentage that are promoters, and you have your score, which will land between -100 and 100.
While of course a high score is always good, you’ll need some context to properly evaluate yours. A score of 0 might seem awful (and it is), but it’s the average for the Internet and TV service provider industry. Ouch. So once you have your score, do some research on your industry to see where you land and if you need to pull out some strategies to improve it.
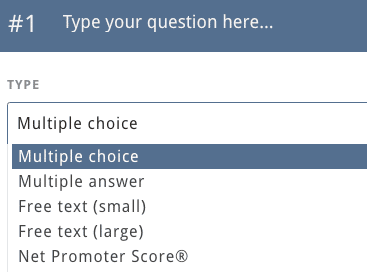
A great net promoter score can be a valuable indicator of customer loyalty and satisfaction, as happy customers will return time and time again. Recommendations that come from friends and family are the gold standard – according to Nielsen, 92% of people trust recommendations from friends and family over any other type of advertising. Mouseflow’s user feedback tool (pictured) includes NPS rating among numerous survey question options.
6. New support requests
While NPS data can take a little while to start gathering, there are some other ecommerce KPIs you can begin tracking immediately. One of the best is the number of new support requests or tickets your customer service team gets. This KPI measures how much help people need from you at different points in their relationship.
Start tracking the number of requests, emails, or chats you get before someone makes a purchase from you. Then, look for the number of tickets that occur between purchase and receipt of an order. This could include people asking for tracking details, emailing when a product is late, or questions about what they were charged. Finally, track requests after orders arrive to determine if you’re sending people the right products, if goods are being damaged in transit, or if you’re facing a lot of returns.
Each area can tell you a lot about what is or isn’t working for your current operations. You begin the ecommerce KPI journey here with tracking. Use insights to help you proactively address concerns, whether that’s expanding your FAQ or automatically sending someone their tracking details.
After you’re tracking new requests, you can slowly add KPIs for how many tickets you resolve the first time and how fast it takes to resolve the average concern. Improvements in support ticket management also can lead to reduced customer churn rates, a KPI worth tracking when you’ve got a solid foundation of data on your service efforts.
Growth KPIs for ecommerce
There are lots of ways you can try to measure growth online. Let’s look at two of the most valuable: customer lifetime value (CLV) and conversion rate per channel.
7. Customer lifetime value (CLV)
Your most valuable customer is your customer that returns time and time again – acquiring a new lead can cost up to five times as much as retaining an existing one. Understanding customer lifetime value is simple, but calculating it is usually a little more complicated.
Customer Lifetime Value (CLV) is simply the total amount a customer has spent at your business over their lifetime. If you only sell on one platform and you can easily track your customers, or all of your data is integrated, it might not be too difficult to measure. However, for many businesses it can be tricky because of the tracking involved. Making it easy to create an account with you, and giving someone benefits for doing so, helps ensure people sign in to that account for a purchase and allow you to track how much they buy from you over the years.
A great way to not only improve customer lifetime value, but also calculate it better, is to set up a loyalty program. You can simultaneously reward loyal customers and also keep better track of how much they spend over time.
8. Conversion rate per channel
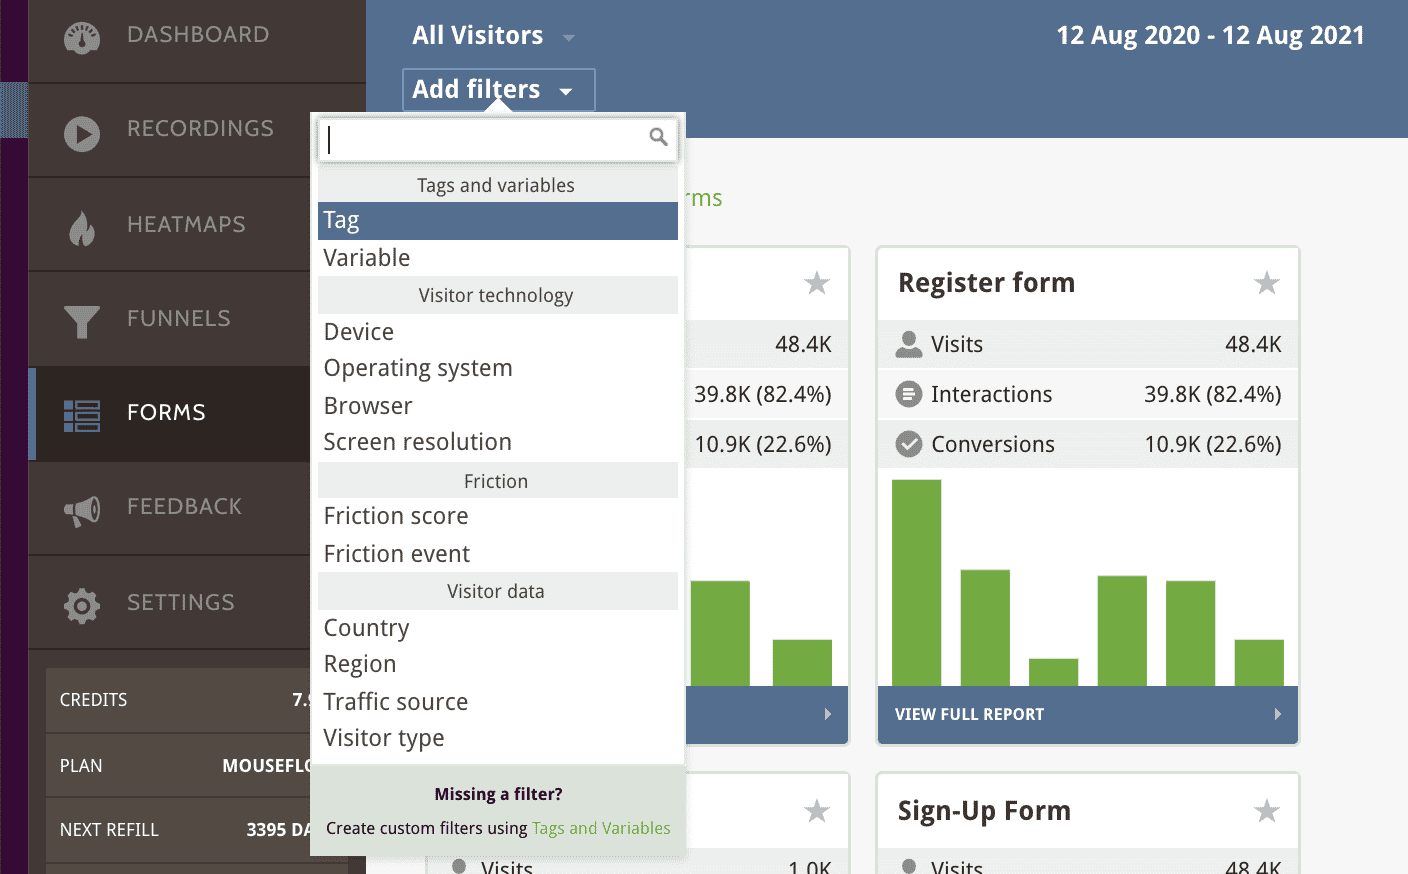
Most businesses track their conversion rates to understand how appealing their message, marketing, and sales pitch are for the overall audience. The important ecommerce KPI version is to track your conversions based on each channel or source of traffic. Using filters, tags, and segmentation within analytics can help you best understand this metric.
You can sell via your website, on Amazon, eBay, and even directly on social platforms. At the same time, you’re likely running ads on search and social, or even paying to get products promoted in marketplace listings. That’s a lot of options, and it can be hard to understand where to allocate your budget.
Tracking conversion based on channel will show you what’s working best for your business today. This way, you can spend more on the options that generate sales. You might transition away from Instagram ads but increase Facebook and search campaigns. Or, Amazon may generate more sales for you than eBay, so when people click on your next ad you decide to send them to the Amazon page every time.
Investing your money wisely can help drive significant growth. It also points out the best channels to share a deal or try something new.
Fulfillment-focused ecommerce KPIs
Getting the order to the customer is the most obvious face of the business, but there is a crucial ecommerce KPI you should be tracking to determine how well you’re performing in this penultimate step:
9. Order accuracy rate
These days, a lot of fulfillment is about speed. Same day processing, 2-day shipping, etc. However, the unspoken rule is that the customer wants exactly what they ordered, and unfortunately, sometimes speed can come at the cost of accuracy.
When you measure your order accuracy rate, whether you’re doing your own fulfillment or outsourcing to a third party logistics company (3PL), you start to get a feel for how often you’re delivering on what was asked of you. The higher your accuracy rate, the better your ability to serve customers. This improves their satisfaction and can up CLVs over time. When orders go out the door accurately the first time, you’re helping the rest of your business improve its relevant ecommerce KPIs.
Reverse logistics is extremely costly, and even when you repair the mistake, the customer is likely still not satisfied, so prioritizing accuracy (or working with a fulfillment center that does) is the first step to preventing those unhappy customers and lost money fixing the error.
10. Order processing speed
Once you’ve got order accuracy down, you can start targeting fulfillment speed. Begin with the element that you or your 3PL can have the most direct impact on: order processing speeds.
Order processing covers the steps your business takes after someone buys from you. This includes verifying payment and sending the order to your warehouse or fulfillment partner. It also covers preparing an order, so picking items off shelves, packing them in a box, and selecting a shipping service from a carrier. The carrier may then come to your location to pick up orders, or you may need to drive it to their location to drop off the day’s packages.
Order processing speed tracks how long it takes you to complete all those steps.You want to continually get faster while maintaining high levels of order accuracy. That’s key because you only get credit for the speed if the customer keeps the products that arrive.
We recommend you start here because it impacts the quality of your overall service. Promising two-day shipping to a customer can come off as annoying if it takes you a week to process the order. They’re waiting nine to ten days instead of two to three. Many of your shoppers won’t understand the difference and can start complaining when they think you’ve taken too long. Shortening order processing keeps your warehouse moving while also protecting those customer relationships.
11. Fulfillment expenses and margins
The cost of fulfillment is a useful ecommerce KPI to track. However, this is largely unique to your business. Fulfillment costs change based on the size and weight of your products, where your fulfillment locations are, where your customers are, and how far the goods travel at your chosen carrier speeds.
It’s a lot of data to track, but can be worthwhile. Learning about your customer locations, for example, may help you find a new warehouse or fulfillment partner closer to those major markets. This would reduce the number of shipping zones your average order travels, cutting delivery costs.
Learning the size and weight of your products can help you determine if you should ship them together or separately, even if a single customer orders multiple items. Sometimes, using a box large enough to accommodate multiple products pushes it to higher cost tiers that carriers set, incurring additional fees. Using a dimensional weight calculator can help you track some of this and may indicate when to split an order across multiple boxes, or when to choose a different carrier for a certain order.
Track as many expenses here as you can. Use that to look at how much fulfillment might eat into margins for individual products as well as your company at large. That understanding can help you look for areas to control or adjust costs in your operations. Or, if one expense is especially high, you can use that as your main ecommerce KPI to evaluate potential 3PL partners. Find who knows that expense well and has a plan to help you reduce it.
Conclusion
Setting good ecommerce KPIs to focus on is crucial to determining what your goals and strategies are, and evaluating how well you’re executing those goals and strategies. Knowing you want to grow your company is not just obvious, it’s kind of useless without attaching it to metrics that are meaningful and can help you measure your growth over time.
Once the right KPIs are in place, you can proceed with the process of eCommerce website optimization with a goal-oriented approach and drive more value out of your eCommerce store.