
Ever felt overwhelmed by landing page reports packed with too many metrics? You’re not alone.
Many marketers and conversion rate optimization (CRO) beginners often get distracted by the sheer number of landing page metrics available. So, they unintentionally prioritize vanity metrics and data points that look good on paper but offer little actionable guidance. As a result, they optimize for the wrong things and miss out on opportunities.
This post is all about ditching the fluff and focusing on the metrics that will give you valuable insights. I’ll show you 8 essential landing page performance metrics and how to track them. And we’ll also discuss some popular ones that are vanity metrics – and can be safely ignored.
Landing Page Metrics to Track
Here’s the list of important landing page metrics that you need to track:
- Landing page views
- Sessions by source or UTM
- Scroll depth
- Conversion rate
- Average render time
- Friction score
- Cost per conversion
- Engagement time
1. Landing Page Views
Let’s start with a primary metric – landing page views. That’s the number of times website visitors viewed the landing page.
You might be tempted to think that it’s a vanity metric. After all, it doesn’t directly measure landing page conversions, just page visits. However, it’s still important to track either page views or sessions because it helps you gauge the level of interest in your page.
What Do Landing Page Views Mean
A low number means you may need to adjust your digital marketing strategy to drive more traffic – if it’s an important landing page. On the other hand, a high number could mean you’re successful in attracting visitors.
If you have multiple landing pages (like SaaS companies usually do), this metric will show you the most popular and least popular pages. That way, you can analyze the pages with high view count and try to replicate their success for the ones with lower views.
Views and Sessions Are Different
Even though page views and sessions both reflect page visits, there’s a difference between them.
In Google Analytics 4 (GA4), pageviews reflect the total number of times a user loads your landing page, regardless of whether it’s by a new visitor or a returning one. A session in GA4 represents a user’s interaction with your website within a specified timeframe (30 minutes by default).
Hence, a single session can include multiple page views and interactions within a visit to the website. For instance, if a user visits your landing page, clicks through to a product page, and returns to the landing page later in the session, GA4 counts that as two views but only one session.
How to Track Landing Page Views
You can track the number of views using pretty much any website analytics system. Here’s how to do it with Mouseflow.
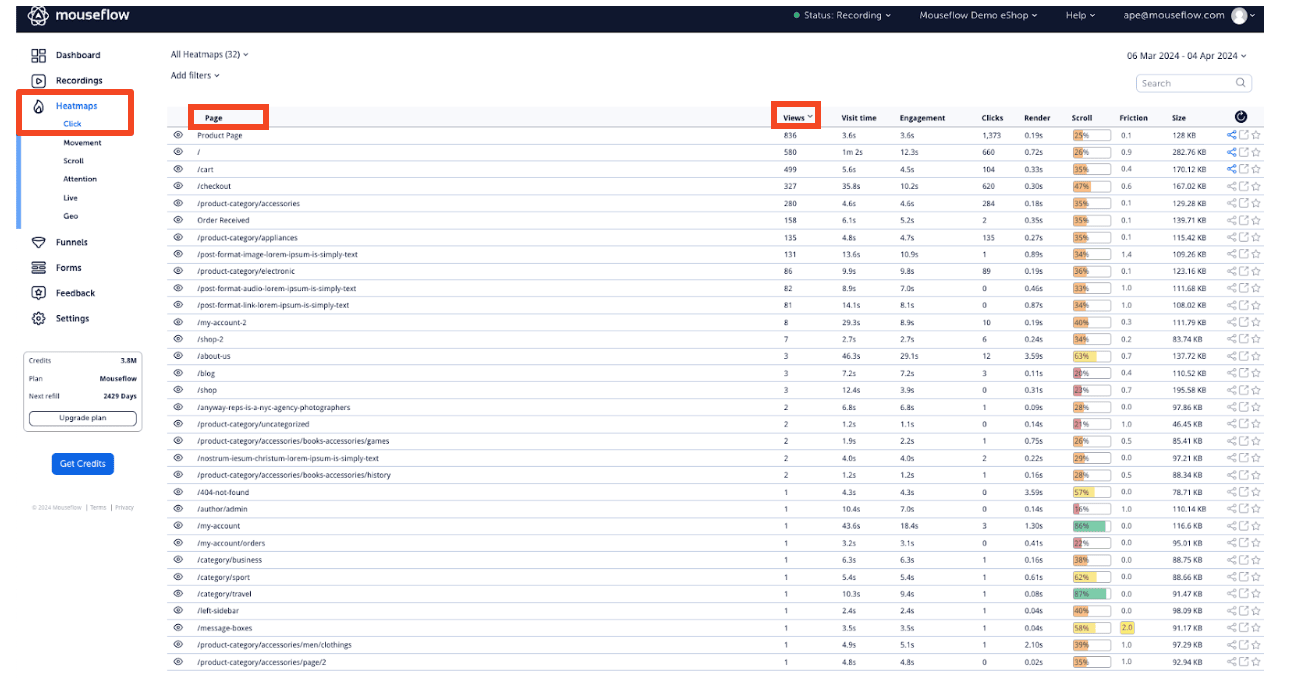
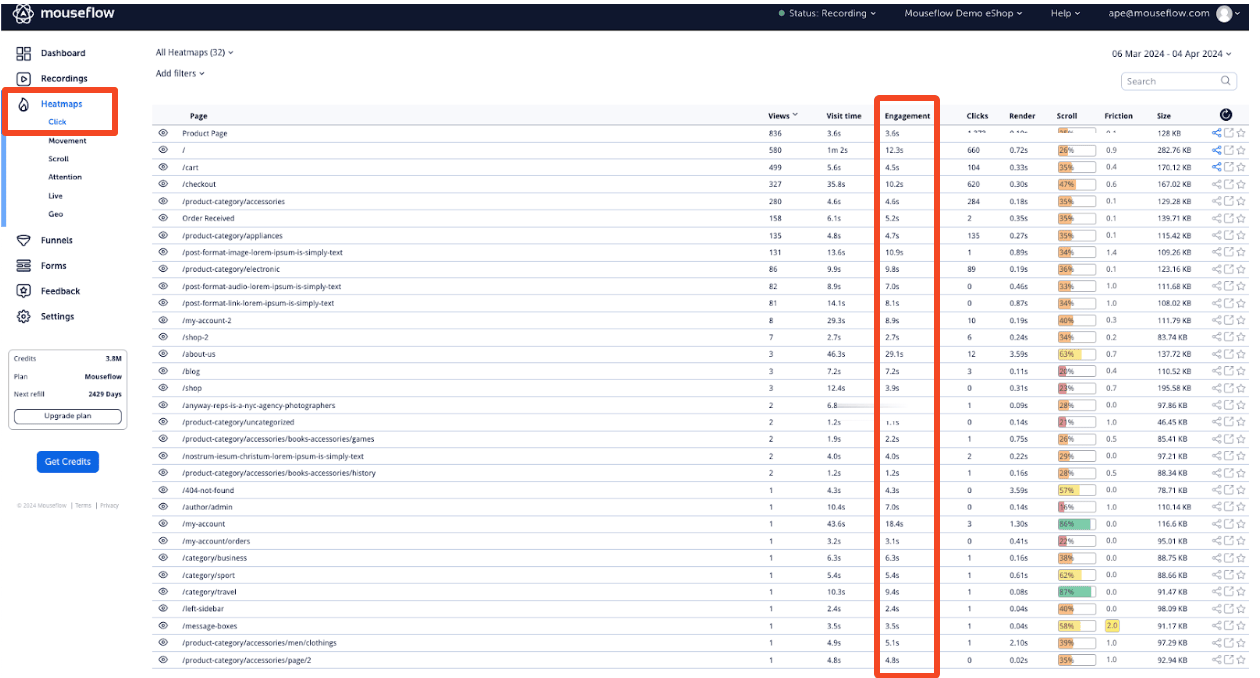
Click “heatmaps” in the sidebar of your Mouseflow dashboard, and you’ll see a list containing the data for different pages within your website. The metrics and corresponding figures Mouseflow displays here are “views”, “visit time”, “engagement”, “clicks”, “render”, “scroll”, “friction” and “size”. “Views” is what we’re looking for in this case.
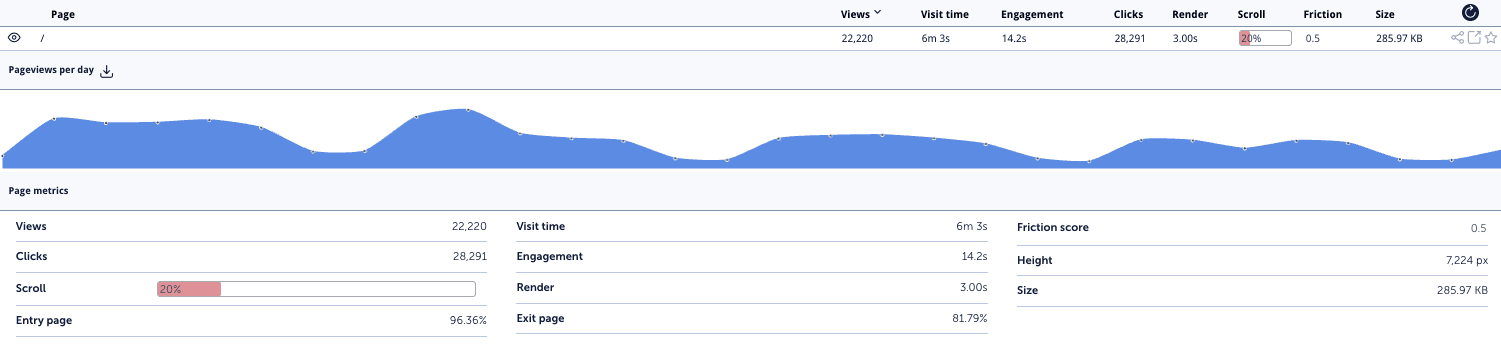
Dive into each page to see more details, such as a graph of your page view over time, page views per day, etc.
2. Sessions by Source or UTM
Not all channels work equally well. Which ones are better? Tracking sessions by source or UTM helps answer that question.
Why Is Tracking Sessions by Source or UTM Important
By tracking sessions by source or using other UTM parameters such as utm_campaign or utm_medium, you can pinpoint which channel (organic search, social media, email marketing, etc.) or which campaign drives the most traffic and engaged visitors to your landing page.
This information lets you adjust your marketing strategy and resources to focus on high-performing sources. You can also use it to improve the campaigns that aren’t delivering desired results.
For instance, if your Instagram ads generate significant traffic, you might want to increase your ad spend for Instagram for even more results. The idea is to get the most qualified traffic for the least amount of money.
Of course, traffic quantity isn’t everything and high numbers can be misleading. The next metric goes beyond raw numbers to measure true traffic quality and optimize your campaigns for conversions.
How to Track Sessions by Source or UTM
You can get the information about your sessions’ source from Mouseflow: go to “heatmaps”, choose “add filters”, and then filter by traffic source or variable. In the list of variables, you’ll have all UTM parameters so you can filter by them.
3. Scroll Depth
We’ve explored metrics focused on views and clicks, but what about user engagement with your landing page content? That’s where scroll depth, a metric measuring how far down a user scrolls on your page, comes in.
Why Is Tracking Scroll Depth Important
Scroll depth helps you understand user behavior and how they consume the content on your landing page. The insights from its analysis help you make your content more effective at increasing engagement.
How to Track Scroll Depth
If you’re using Mouseflow, you can either get a bird’s eye overview of scroll depth for different pages, or dive into more details for a particular page.
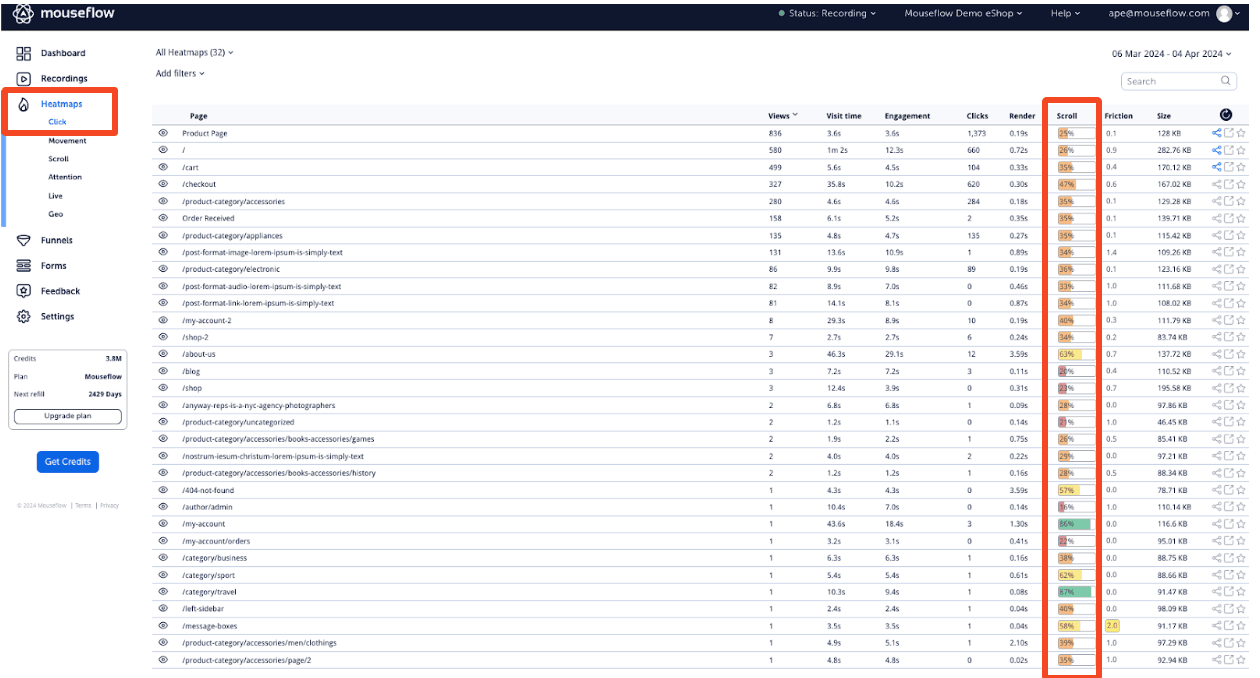
- Average scroll depth for a page in heatmap list: You can see the average scroll depth beside other metrics on the heatmap list like this:
- Scroll heatmaps for individual pages: For a deeper understanding of individual pages, use scroll heatmaps. Click on “scroll” in the heatmap section, and you’ll see a visual representation of your user’s scrolling behavior. See an example of Mouseflow’s sign-in page:
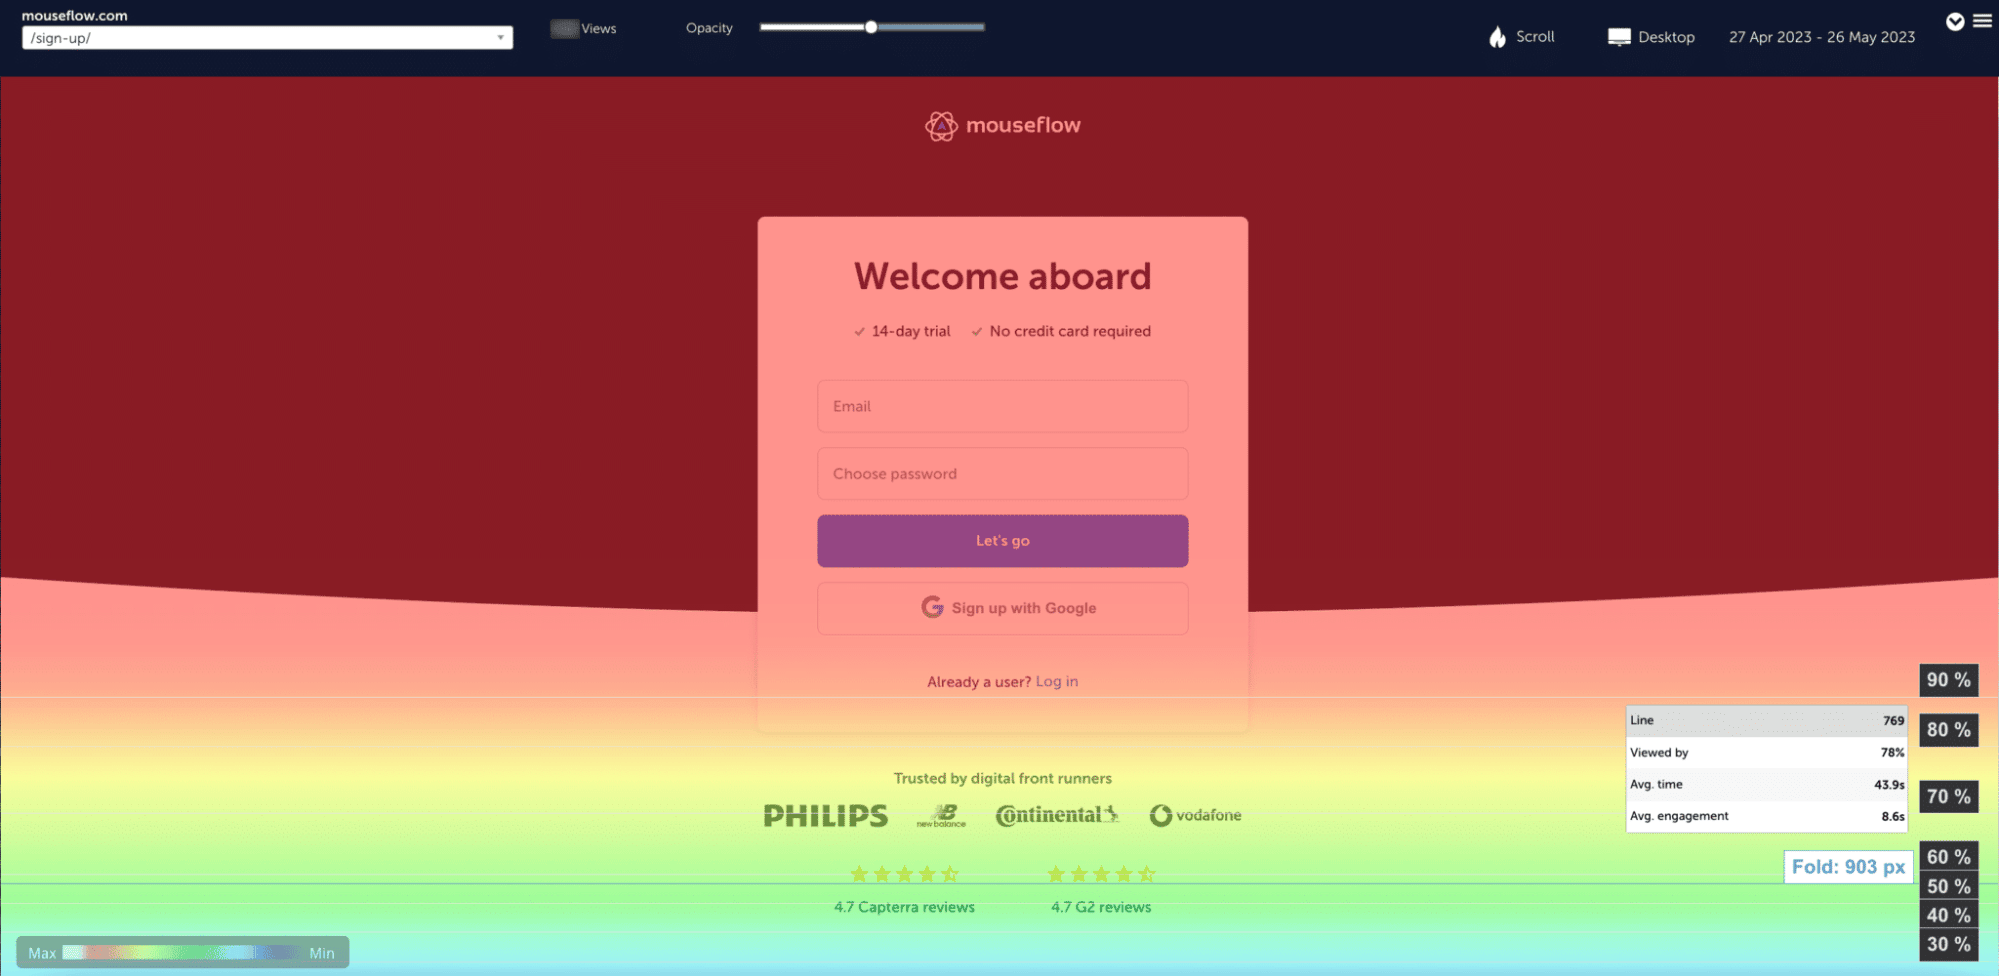
The hotter areas (with bright colors) indicate zones where users scroll more frequently, while cooler areas (with cool colors) represent sections they view less.
When one of Mouseflow’s customers, Sensorem, wanted to assess the quality of their campaign traffic, scroll depth was one of the metrics they used. From there, they discovered visitors from cheaper cost-per-click campaigns rarely scrolled through the landing page. So, they decided to focus on the more expensive campaigns driving higher quality traffic. The results? A 2x conversion rate improvement in 6 months.
4. Conversion Rate (CR)
CR is often regarded as the most important landing page performance metric. It’s one metric every marketer interested in achieving peak website performance should track.
By definition, conversion rate measures the percentage of visitors who complete your desired action on the landing page. The desired action could be anything – signing up for a newsletter, downloading an ebook, or making a purchase.
Why Tracking Conversion Rate Is Important
Conversion rate provides the clearest picture of your landing page’s effectiveness in achieving its core objective, which is why you must track it.
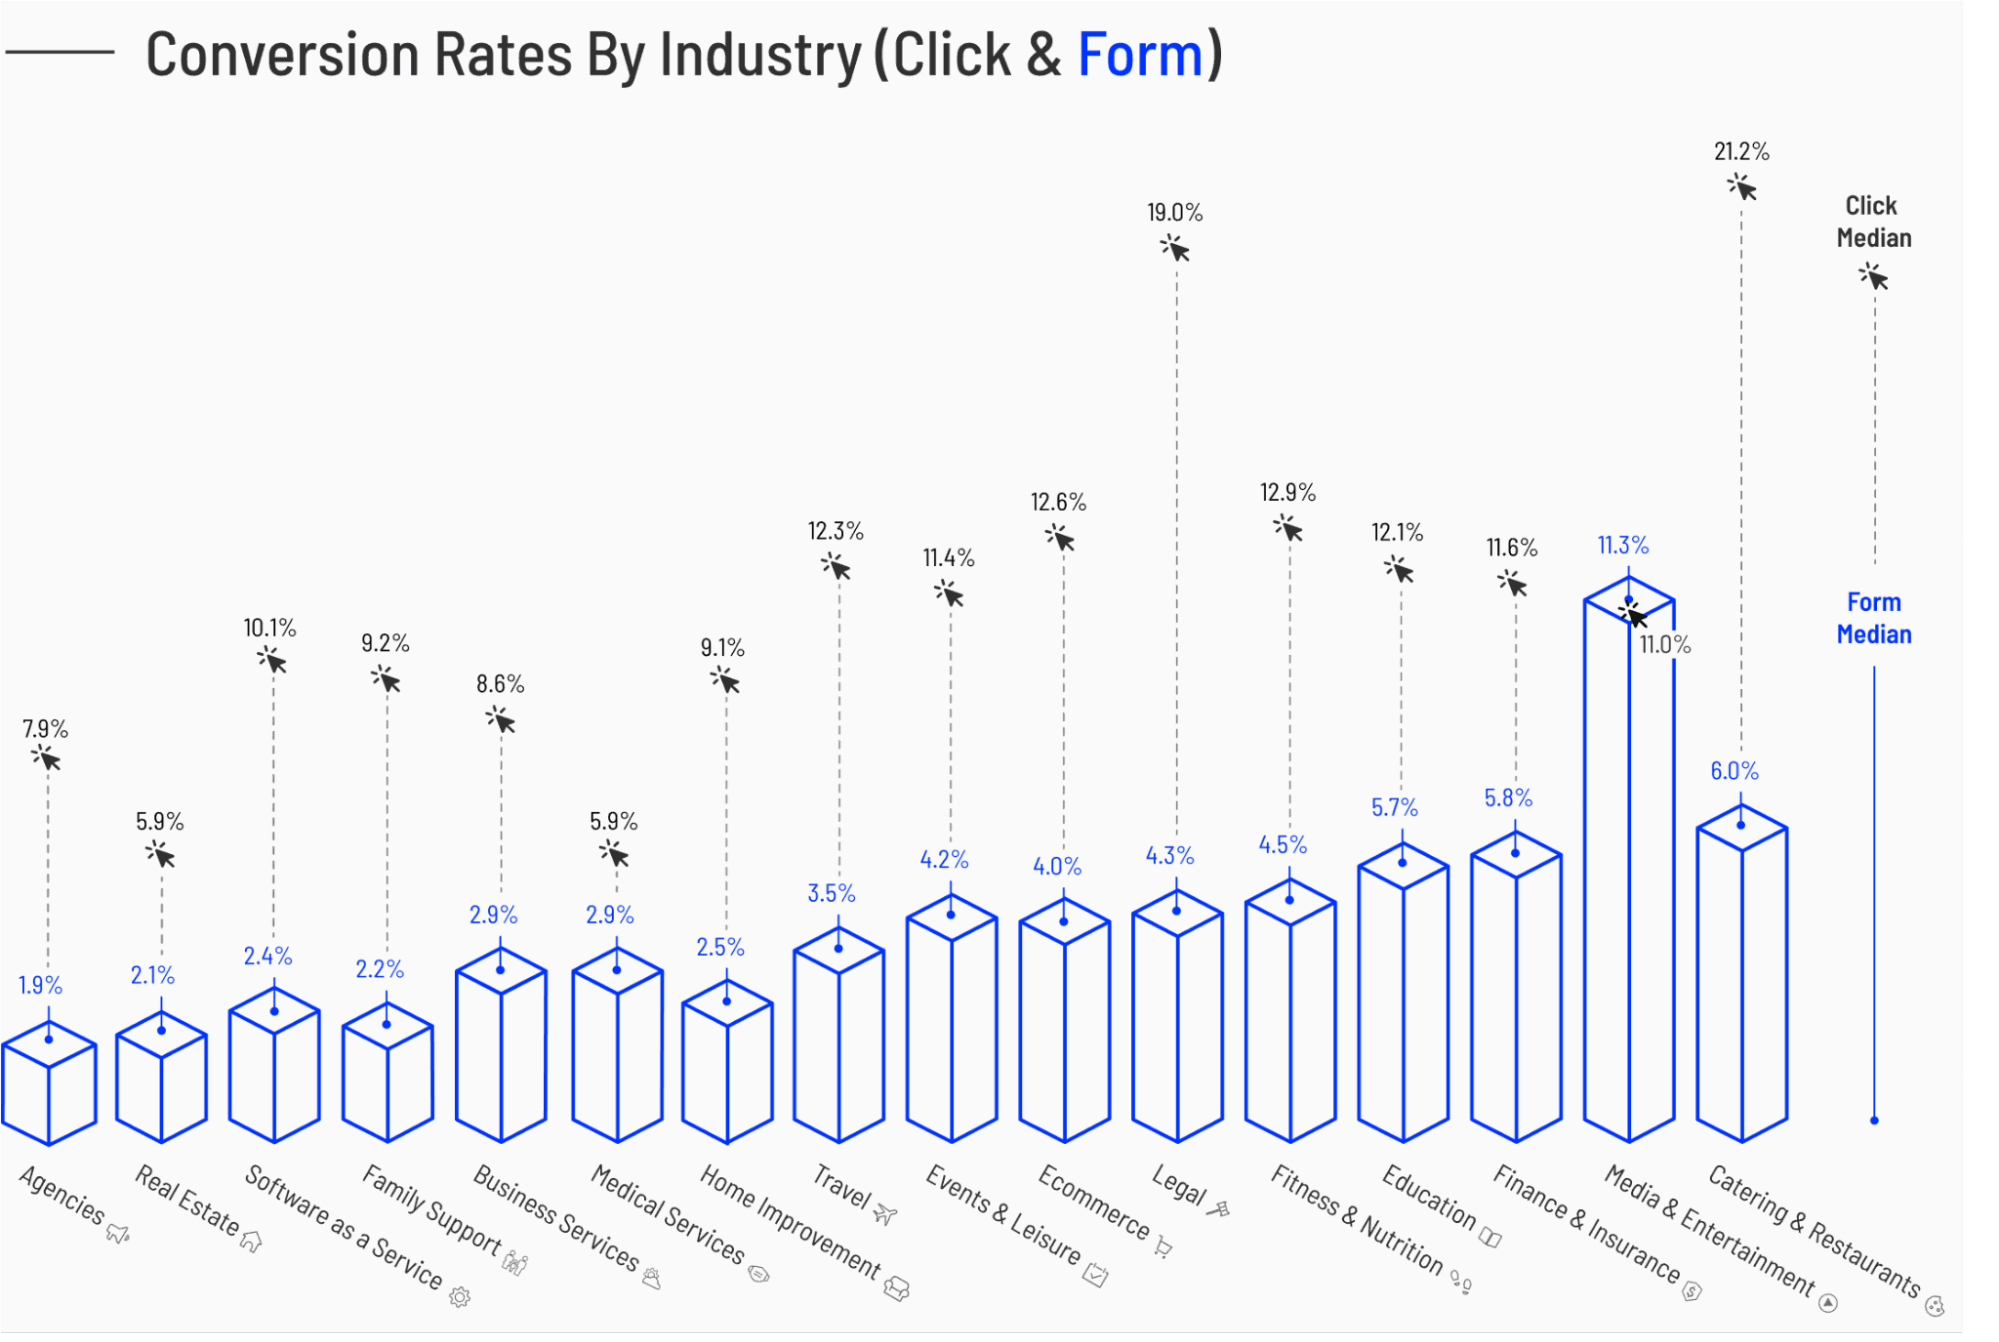
The average CR varies across industries (and desired actions), so compare your results with your industry’s benchmark to know how you’re doing. Here’s data from Unbounce on the average CR rates across different industries:
How to Track Landing Page Conversion Rates
You can use Mouseflow conversion funnels to track CR.
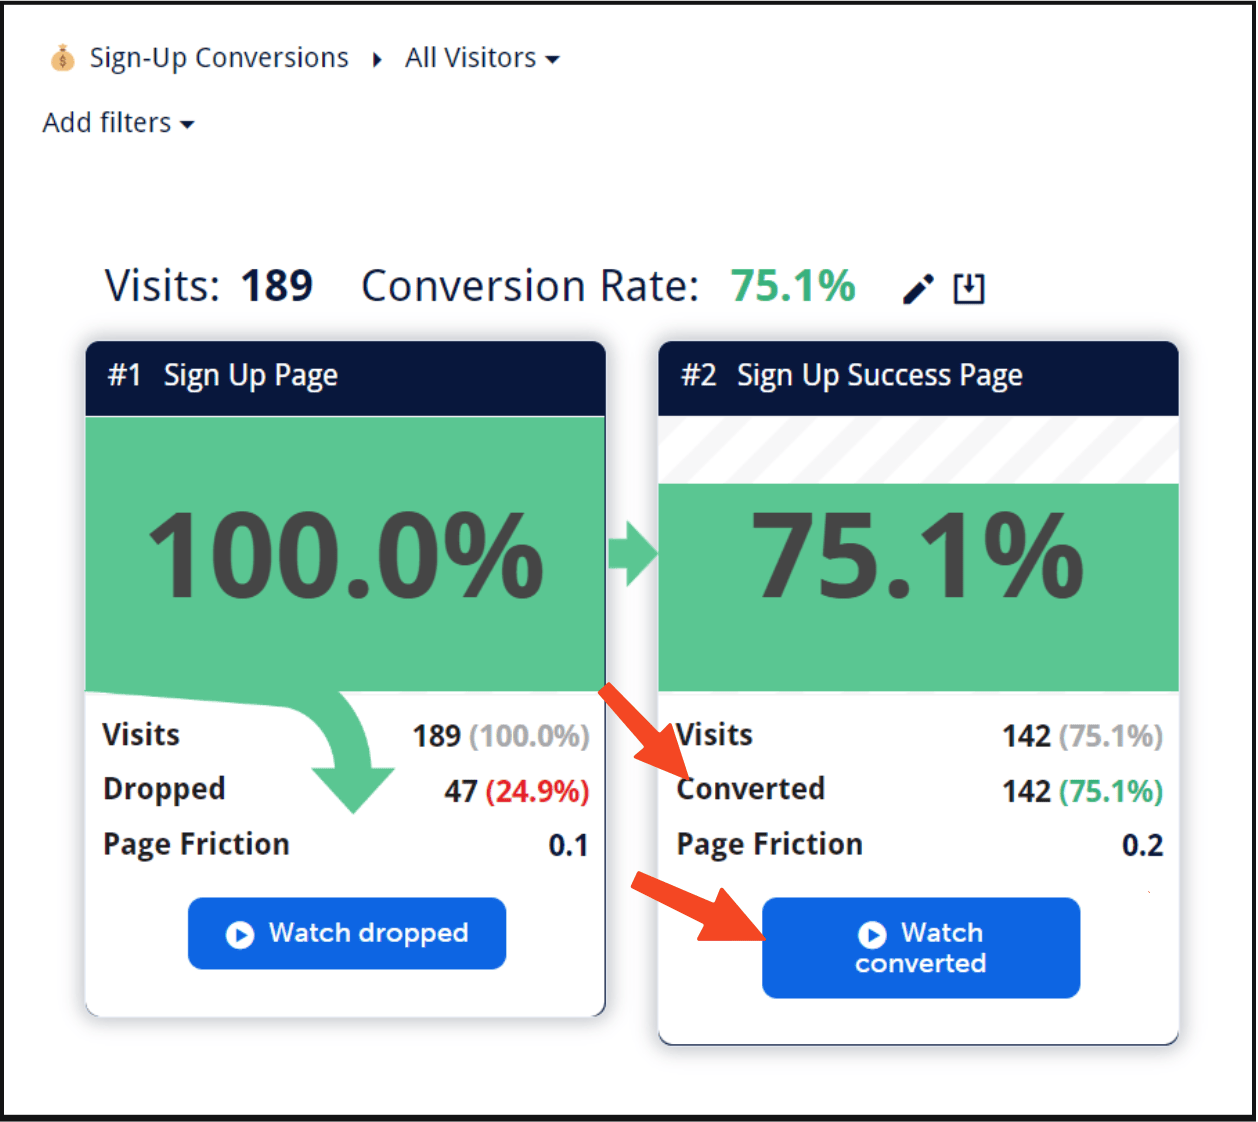
Set the first step to be your landing page and the second/last step as the “conversion successful” page, be it “sign-up completed” or “thanks for the purchase.” Once it’s set up, you can see the conversion rate and even watch their session recordings to see why users converted – or didn’t convert.
5. Average Render Time (AKA Page Load Time)
People are impatient. There’s a million and one things they can be doing at every moment (even if it’s just mindless scrolling online). If your landing page is slow to load, visitors’ patience exhausts quickly and many of them just leave.
That’s why monitoring your page’s average render (or page load) time is necessary. According to Google, a good page load time is under three seconds.
Why Else Tracking Average Render Time is Important
Aside from affecting user experience (UX) negatively, a slow-loading page can hurt your SEO ranking because search engines prioritize fast-loading websites. This makes it harder for potential customers to find you organically.
How to track Average Render Time
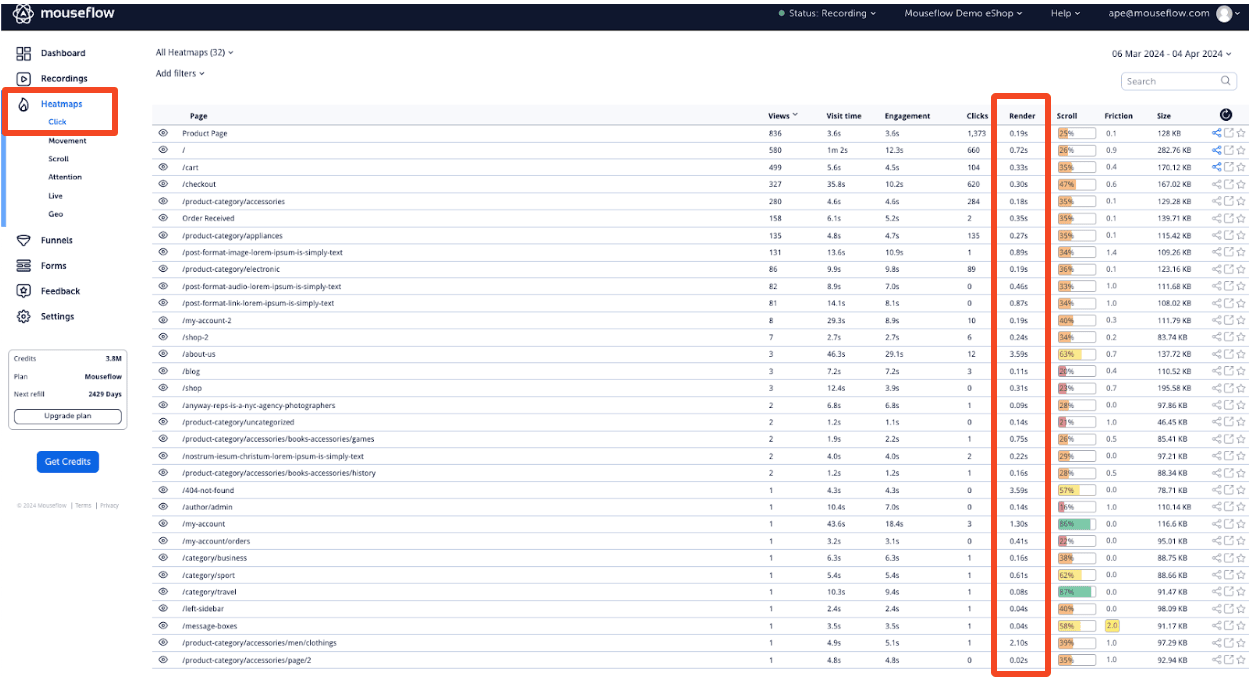
In Mouseflow, it’s pretty straightforward. The average render time of your pages is visible in the list of heatmaps, right in the middle of “clicks” and “scroll” metrics:
Bonus tip: Sort all your pages by average render time and see if any important pages are among the slowest. If they are, optimize them to improve your website’s conversion rates. If you want to know the specific factors causing the slow loading speed, use Pagevitals.
6. Friction Score
Friction score, a metric unique to Mouseflow, highlights the potential obstacles or difficulties users may face when interacting with your landing page. It analyzes user behavior and assigns a score based on the level of difficulty visitors encounter while navigating your page.
Mouseflow calculates this score based on seven friction events: Click-errors, click-rage, bounce, mouse-out (when the cursor leaves the tab), speed-browsing, and custom friction.
Why Tracking Friction Score is Important
A lower friction score means a smoother user journey. So, if your landing page has a high friction score, you’d better take a look and resolve the problems that the users face to increase engagement and conversion rate.
How to Track Friction Score
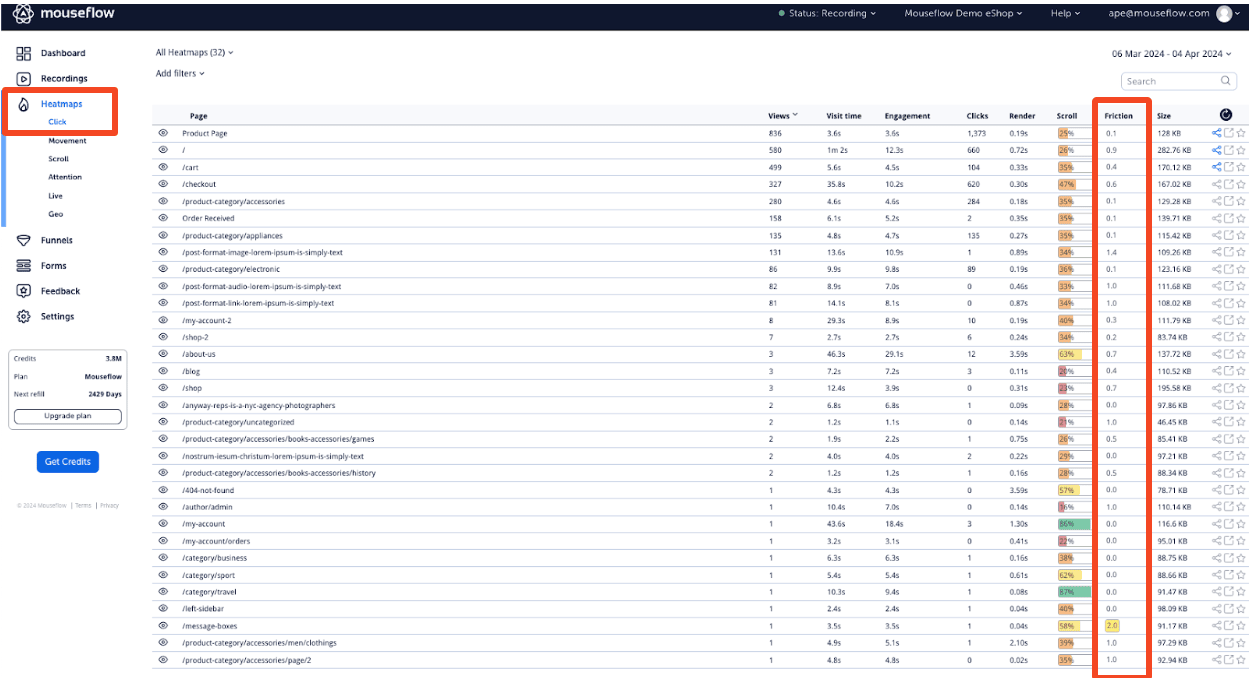
Find the friction score in the heatmap list with other metrics:
Bonus tip: If you don’t know where to start with a CRO audit of your website, go to recordings and filter them by friction score. Focus on those ones with “unhappy” or “very unhappy” scores. And if you know which page you want to optimize, just filter by entry page as well to narrow down the list of recordings.
Watch these recordings to gain a firsthand perspective of the problems your most frustrated website visitors face. This targeted approach will help you resolve the specific usability issues with your landing page.
7. Cost per Conversion (CPC)
Cost per conversion (not to be mistaken with another CPC – cost per click) is a fundamental metric for understanding your campaign’s return on investment (ROI). It measures the average cost of generating one conversion on your landing page.
Why Tracking Cost per Conversion is Important
This metric is essential for knowing your unit economics — are you spending more to acquire a customer than they’re worth? After all, the aim is to maximize your budget to achieve the highest ROI.
How to Calculate Cost per Conversion
In the past, calculating CPC was a chore. It required exporting data from various platforms to get your total ad spend per campaign, leading to the landing page and the number of conversions each campaign generates. Then, you would have to divide your total ad spend per campaign by the number of conversions from the campaign to get your CPC.
However, GA4 has built-in functionalities to automatically calculate CPC, easing the process. This provides valuable insight into the cost-effectiveness of various traffic sources driving conversions.
CPC vs CPA vs CAC
There are two more very similar metrics: cost per acquisition (CPA) and customer acquisition cost (CAC). The difference between CPC, CPA, and CAC is in the action taken.
In CPC, a conversion could be anything – subscribing to a newsletter, submitting a form, etc. In CPA, acquisition means acquiring a user. In CAC, it’s not just a user but a paying customer. If a service doesn’t have a free tier or a free plan, CPA and CAC are the same thing.
8. Engagement Time
Engagement time is the amount of time the users spend actively interacting with a page – scrolling, moving their mouse, clicking, etc.
A user can open a page and then close it immediately. In this case, their engagement time is very close to zero. Also, they can open a page, scroll it for 2 seconds and then forget it for another 30 minutes. If that’s the case, their time on page would be pretty long, but their engagement time would be only 2 seconds.
Why Tracking Engagement Time is Important
A high engagement time suggests visitors find your site content interesting and valuable. They really consume it, interact with it, and that increases the likelihood of conversion. The opposite is the case for a low engagement time. It means the content wasn’t a good fit for them or at least didn’t manage to keep their attention for long.
How to Track Engagement Time
You can check your page’s engagement time at the top of the heatmap list in Mouseflow:
Bonus Track: Form Metrics
Even though it’s not on the list, tracking your forms is important. The forms on your landing page help you capture lead information and drive sales. Checkout is also a form. To increase the number of people who submit their details, you can monitor and try to improve some form metrics.
Use Mouseflow’s Form Analysis Optimization Tool for in-depth insights on your forms. It’ll inform you how many people visited the page with the form, interacted with it, and converted. It’ll also show you the time they’ve spent on each field and where they dropped off. The cherry on top – Mouseflow’s form analytics tool allows you to watch recordings of those who dropped off so that you can see why it happened.
Further reading: How to get started with form analytics
Landing Page Metrics You Don’t Need to Track
You’ve seen the nine (plus one bonus) metrics for landing page success. However, some other metrics are rather well known, but we suggest that you shouldn’t waste your time on tracking them Let’s look at some of them.
Average Time on Page
At first glance, average time on page might seem like a key metric. However, you should approach it with caution because it can be misleading.
A low average time on page seems concerning as it suggests visitors are bouncing fast. But if the conversion rate for the landing page is high, it just means that it converts people very fast. Which is great, right?
On the other hand, a high value could also be bad because it can mean visitors are struggling to find what they want, so they are spending longer trying to navigate your page.
Also, this metric (along with average session duration) doesn’t tell you what’s happening on the page. It could be that a visitor with a high time on page or average session duration finds your content engrossing. Or that they are lost and scrolling in confusion.
To understand what time on page means in each particular case, you’ll need to use a session replay tool to watch recordings with high or low time on page.
Let us give you an example from our own marketing practice, where time on page could’ve fooled us. We were running a LinkedIn campaign, driving visits to the Mouseflow website, when we noticed the average time on page was low.
At first, we thought that, perhaps, it was because our content was poor and didn’t match the ad copy. But then we looked at recordings and realized many of them were exactly 10 seconds long. Also, some had a viewport size of about a quarter of an average phone screen.
Those were not people, they were bots. As a result, we just stopped this campaign and saved money. If we had only looked at the average time on page and used that metric to make decisions, we would’ve updated the page copy, continuing to waste money on campaigns that mostly brought non-human traffic. The copy wasn’t the problem. The bots were.
Pages per Session
The second metric you don’t need to track is pages per session. Why? Like the average time on page, more doesn’t always mean better. People might visit more pages because they are lost or can’t find what they need, not because you’ve caught their interest.
For instance, search engine spiders and other crawlers often have a lot of pages per session. Does this make them a good audience? Certainly not.
Another example to prove our point. One of Mouseflow’s customers (case study hopefully coming soon, stay tuned) had a lot of pages per session. Upon further investigation, they discovered it was because of a logic loop in the subscription flow that made customers return to the same page after selecting the product options they wanted. It wasn’t because they were visiting multiple pages on their own accord.
So, watch the related recordings on Mouseflow to learn the cause of your high number of pages per session (if you have any). And, perhaps, don’t rely on the pages per session metric too much.
Bounce Rate
This metric is on almost every “landing page metric to track” list, yet it is not as important as many experts make it out to be. Or rather, they don’t usually account for the context. You see, all things being equal, a high bounce rate means something is wrong. But what exactly? Is the page bad? Are you bringing the wrong audience?
People bounce for different reasons, but the bounce rate only gives limited context. It doesn’t reveal the root cause.
It’s not a totally useless metric, but it leaves too many open questions. And sometimes, in trying to reduce your bounce rate, you can negatively impact other, more important metrics.
Mouseflow’s session replays are a good way to get more context on your bounce rate. You’ll see whether the cause of the bounce is because they found what they need fast, they are the wrong fit, or they don’t like your messaging.
Never Analyze Metrics Independently
All the metrics on your page are interconnected, meaning what affects one affects the others. They are not isolated.
This means when you analyze and optimize them, do it in conjunction, not independently. Improvement in one metric can result in a decrease in other metrics, and it’s no good for business if, say, your scroll depth improved but conversion decreased.
On the other hand, don’t try to track all metrics. You’ll find it overwhelming in no time. Instead, select the ones relevant to your case (like some discussed in this article) and work on them.
Landing page optimization is a continuous process. By analyzing metrics holistically and prioritizing the right ones, you can create high-performing landing pages for your business.
If you want to improve your content engagement, here’s an article showing you the top ten content engagement metrics to track.