- The difference between watching and analyzing
- Step 1: Start with a question, not a recording
- Step 2: Filter for signal, not volume
- Step 3: What to look for while watching
- Step 4: From observation to hypothesis
- Step 5: Pair Session Replay with other data
- The methodology in practice: Scotts Miracle-Gro
- Putting it all together
- The methodology in brief
The most effective way to analyze Session Replays is to start with a specific question, filter your recordings to the sessions most likely to answer it, look for repeating patterns rather than individual incidents, and turn what you observe into a testable hypothesis. That is the methodology this article covers.
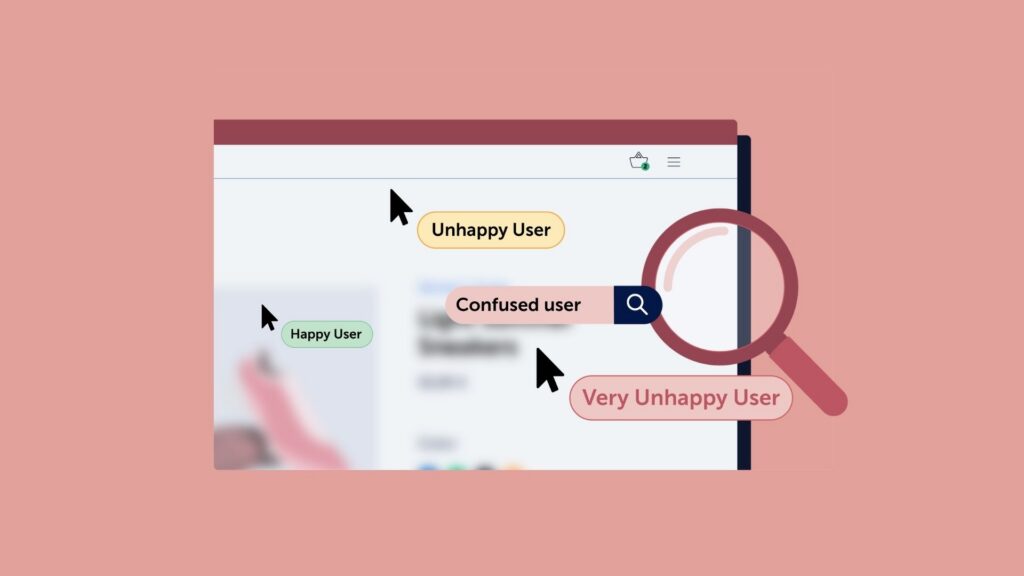
Most teams, though, approach it differently. They open the recordings list, watch a few sessions, note down what looks interesting, and move on. The process feels productive but tends to produce a list of disconnected observations rather than anything actionable. The issue is not the tool, it is the lack of intention behind how it is used. Watching recordings without a clear question is a form of confirmation bias: you notice what already fits your mental model and miss the patterns that do not.
Session replay is evidence, not insight. The insight comes from knowing what you are looking for before you start watching. If you are new to the tool and want to understand how it works under the hood, this article on how session replays work is a good starting point.
You can also visit our Session Replay topic page.
💡Session replay is evidence, not insight. The insight comes from asking the right question first, then using recordings to find the answer.
The difference between watching and analyzing
Here is a concrete example of what separates a random session review from a systematic analysis.
There are two ways to use session replay. You can watch, or you can analyze. Watching means opening recordings and noting what stands out. Analyzing means starting with a specific question and using recordings to answer it. The first produces observations. The second produces hypotheses you can act on.
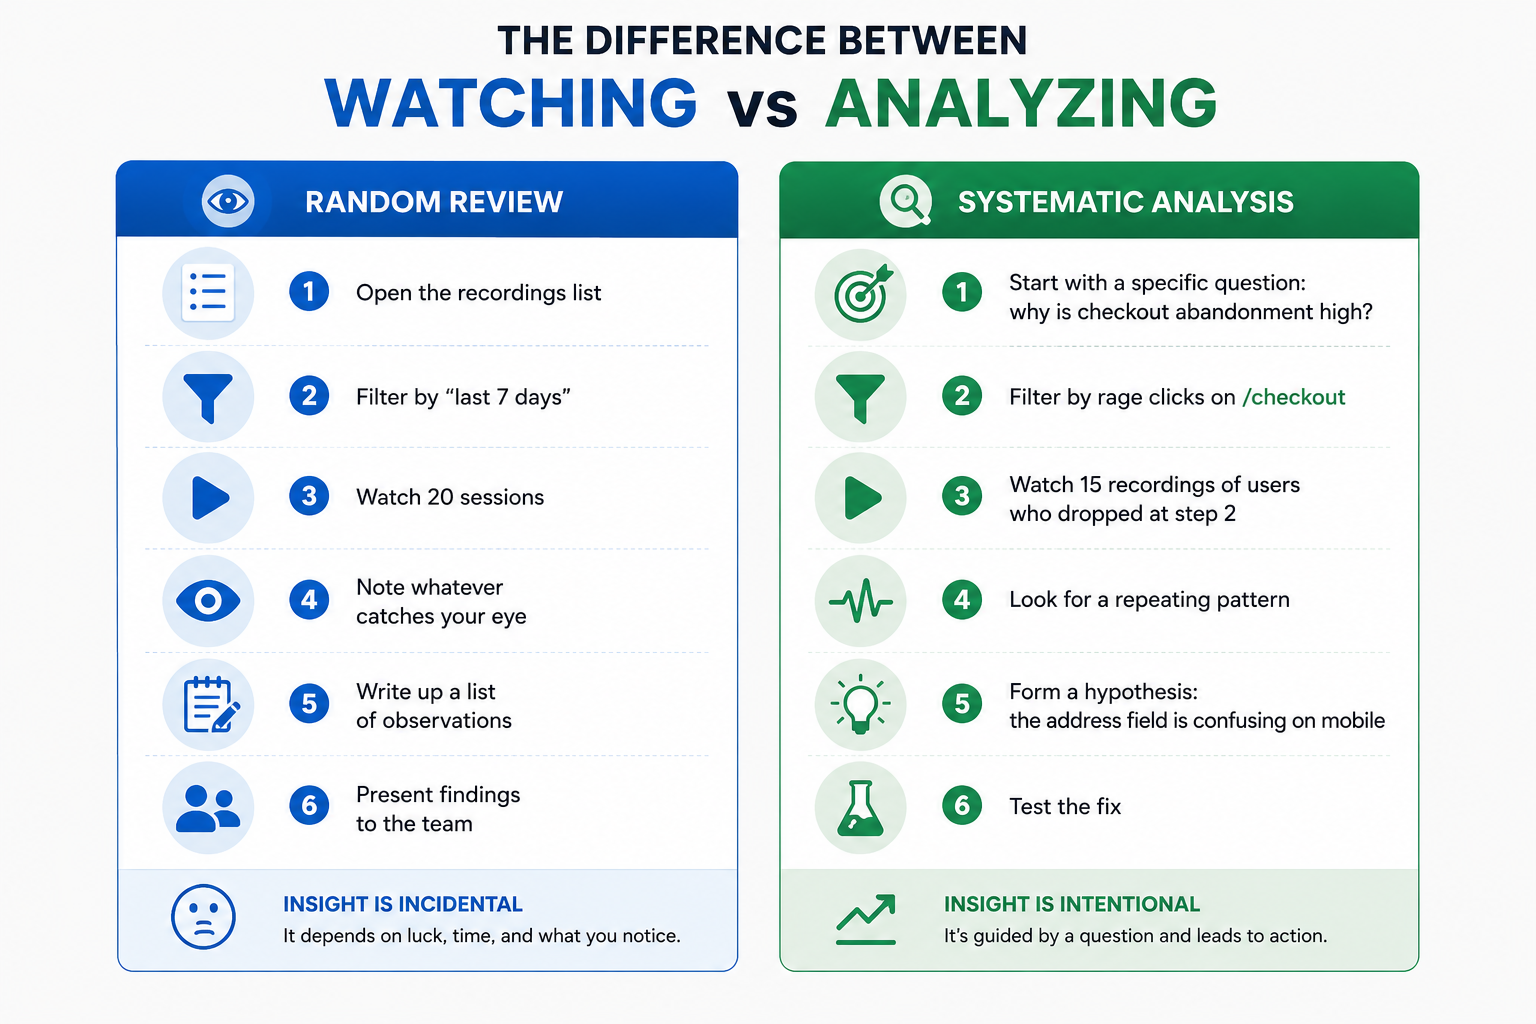
Both approaches involve watching recordings, but only one of them is intentional. The difference is not volume or time spent, it is whether the analysis starts with a clear objective. When you know what you are looking for, the recordings become evidence. When you do not, they become assumptions.
Step 1: Start with a question, not a recording
Before opening a single recording, you need to know what you are investigating. The question defines everything: which filters to apply, which pages to focus on, and what to look for while watching.
Good questions for Session Replay analysis come from existing data. Something in your analytics is already telling you there is a problem. Session Replay is how you find out why.
Common starting points:
![]() A funnel step with high drop-off: Your funnel data shows 60% of users leaving at step 3. Session Replay tells you what they were doing immediately before they left.
A funnel step with high drop-off: Your funnel data shows 60% of users leaving at step 3. Session Replay tells you what they were doing immediately before they left.
![]() A page with a high friction score: A high friction score signals that users are encountering frustration on a page, based on rage clicks, dead clicks, and error clicks.
A page with a high friction score: A high friction score signals that users are encountering frustration on a page, based on rage clicks, dead clicks, and error clicks.
![]() A form with low completion rate: Form analytics show which field users are abandoning on. Session Replay shows what they were doing before they gave up, whether they hesitated, refilled a field, or hit an error.
A form with low completion rate: Form analytics show which field users are abandoning on. Session Replay shows what they were doing before they gave up, whether they hesitated, refilled a field, or hit an error.
![]() A recurring complaint in feedback: If users are mentioning the same issue in feedback surveys, Session Replay helps you see the moment it happens, not just that it happened.
A recurring complaint in feedback: If users are mentioning the same issue in feedback surveys, Session Replay helps you see the moment it happens, not just that it happened.
![]() A page with unusually high exit rate: Users are leaving a page you expected them to continue from. Session Replay reveals whether they are confused, not finding what they need, or hitting a dead end.
A page with unusually high exit rate: Users are leaving a page you expected them to continue from. Session Replay reveals whether they are confused, not finding what they need, or hitting a dead end.
Once you have identified the problem, start forming early hypotheses about what might be causing it. If checkout abandonment is high, your hypothesis might be that the payment form is confusing on mobile, or that a required field is triggering an unclear error. You do not need to validate these yet. The recordings will do that. But having them in mind sharpens what you pay attention to while you watch.
Step 2: Filter for signal, not volume
The goal is not to watch as many recordings as possible. It is to watch the recordings most likely to contain the answer to your question. Good filtering is what makes that possible.
Filter by page
Start with the specific page where the problem is happening. If your question is about checkout abandonment, you only need recordings of sessions that visited the checkout page, not your entire session database.
Filter by friction tag
Mouseflow automatically tags sessions that contain rage clicks, dead clicks, click errors, and 404 events. If your question is about user frustration on a specific page, filter by rage click or friction tag to surface the most relevant sessions immediately.
Filter by funnel step
If you are investigating a funnel drop-off, filter by sessions that reached a specific step but did not complete the next one. These are the exact users whose behavior you want to understand.
Filter by segment
Device type, traffic source, and user segment all produce different behavior patterns. If your question is about mobile users specifically, filter to mobile sessions before you start watching. Mixing device types makes patterns harder to see.
🎯A good filter reduces your relevant session pool to somewhere between 10 and 50 recordings. If you have thousands of sessions matching your filter, narrow it further. If you have fewer than 10, broaden it slightly or accept a smaller sample.
Step 3: What to look for while watching
When you start watching, resist the urge to note everything that looks unusual. You are looking for patterns, not individual incidents. A single user doing something odd is noise. Five users doing the same thing is a signal.
Here are the behavioral signals worth tracking:
Rage clicks
Repeated rapid clicks on the same element. Usually indicates a broken link, an element that looks interactive but is not, or a button that is not responding as expected.
Dead clicks
Clicks on non-interactive elements. Users are expecting something to happen that does not. This often reveals missing affordances or confusing visual design.
Hesitation before key actions
A user pauses for several seconds before clicking a CTA or filling a form field. Hesitation often signals uncertainty, unclear copy, or a trust barrier.
Unexpected navigation
Users going back to a previous page, reloading, or navigating away mid-task. These are signs that something in the flow is not meeting their expectations.
Form field refills
A user fills a field, clears it, and fills it again. This suggests the field label or format is unclear, or a validation error is not explaining what went wrong.
Abandonment at a specific moment
The session ends abruptly at the same point across multiple recordings. This is one of the clearest signals that something specific is blocking users from continuing.
💡Keep a simple tally as you watch. When the same behavior appears in more than a third of your filtered recordings, you have found a pattern worth investigating further. For a broader look at what session recordings can reveal across different contexts, 7 things you can learn by recording your website visitors covers a range of practical examples.
Step 4: From observation to hypothesis
By the time you reach this step, you likely already have a hypothesis in mind from step 1. The patterns you observed while watching may confirm it, refine it, or point you somewhere completely different. Both outcomes are useful.
If the patterns confirm your initial hypothesis, you now have behavioral evidence to support it. If they point somewhere else: users are not struggling with the form field you expected but are abandoning after seeing the shipping cost. Update your hypothesis accordingly. Session replay often surfaces issues you did not anticipate, and those are frequently the most valuable findings.
A good hypothesis has three parts: the observation, the mechanism, and the expected outcome.
Example:
“Mobile users are rage clicking the quantity selector on the product page (observation), which suggests the tap target is too small for mobile screens (mechanism). If we increase the tap target size, rage clicks on that element should decrease and add-to-cart rate on mobile should improve (expected outcome).”
This structure forces you to be specific about what you think is causing the problem and what success looks like. Without it, you might fix the wrong thing, or fix the right thing but have no way to know if it worked.
One recording does not make a hypothesis. Five recordings showing the same pattern do. If you can only find one or two examples of a behavior, note it and move on. Come back when you have more evidence.
Step 5: Pair Session Replay with other data
Session replay shows you what individual users did. It does not tell you how widespread the problem is, or whether fixing it will move your key metrics. For that, you need to pair your findings with other data sources.
- Heatmaps: Session replay reveals behavior, heatmaps confirm its scale, and the Mouseflow MCP Server lets you analyze both with AI.
- Funnels: Session replay shows what users do, while funnel data shows how many users are affected by the same behavior.
- Feedback surveys: Feedback adds context to behavioral data. If users hesitate on a pricing page, survey responses can reveal whether confusion about plan tiers is causing the issue.
💡The rule of three: before acting on a hypothesis from Session Replay, try to confirm it with at least one other data source. Behavioral evidence plus quantitative data plus user feedback is a strong foundation for a change.
The methodology in practice: Scotts Miracle-Gro
Scotts Miracle-Gro, one of the most recognized names in lawn and garden, runs large-scale campaigns across multiple brand websites year-round. After a technology migration, their team noticed that checkout conversion rates had dropped. Hailey Schraer, Lead UX Researcher at Scotts Miracle-Gro, used Mouseflow to investigate.
The question
Why did conversion drop after the migration? The team had a clear starting point and used Mouseflow’s conversion funnels to establish a baseline and identify where users were abandoning the checkout flow.
The filter
Once the funnel data pointed to specific steps with high drop-off, the team filtered session recordings to those exact moments, focusing on the sign-in page and the checkout form.
The patterns
Two repeating behaviors emerged across recordings. On the sign-in page, users were abandoning the process because they believed they needed to create an account, even though a guest checkout option was available. On the checkout form, users were hesitating and dropping off at fields that added unnecessary friction. Both patterns were confirmed by Mouseflow’s form analytics, which showed exactly which fields were causing users to stop.
The hypothesis and the fix
The team hypothesized that simplifying the sign-in experience and reducing form complexity would remove the two main friction points. They redesigned the checkout flow, reduced the number of steps by roughly half, and adjusted the sign-in page to make the guest checkout option more prominent.
The case illustrates exactly how the methodology works when applied with intention: a clear question, targeted filtering, repeating patterns confirmed by a second data source, a specific hypothesis, and a measurable outcome.

Mouseflow helped us identify where customers were getting stuck in the checkout process. We made changes based on those insights and saw an immediate 5% lift in conversions.
Putting it all together
Here is what a complete session replay analysis looks like in practice, from start to finish.
1) Identify the question
Checkout conversion dropped 12% last month. The funnel shows the biggest drop at the payment step. The question: what is happening at the payment step that is causing users to leave?
2) Apply filters
Filter by sessions that reached the payment step but did not complete the purchase. Add a rage click tag filter to surface the most frustrated sessions first. Filter to mobile only, since the drop is larger on mobile.
3) Watch and tally
Watch 20 recordings. In 13 of them, users rage click the card number field after entering their details. In 9 of those, the session ends immediately after. Pattern identified.
4) Form the hypothesis
The card number field is not accepting input correctly on mobile, possibly due to a formatting issue with how card numbers are spaced. If we fix the input formatting, rage clicks on that field should drop and mobile purchase completion should improve.
5) Confirm with other data
Check the friction heatmap for the payment page on mobile. The card number field shows a high friction score concentrated on exactly that element. Check form analytics: the card number field has a 34% drop rate. Three data sources pointing at the same problem.
6) Fix, then compare
Ship the fix. Compare friction heatmaps and session recordings before and after. Monitor funnel conversion at the payment step. The hypothesis either holds or it does not. Either way, you have learned something specific.
The methodology in brief
- Start with a specific question from existing data, not by opening the recordings list
- Filter to the sessions most likely to contain the answer: by page, friction tag, funnel step, and segment
- Watch for repeating patterns, not individual incidents: rage clicks, dead clicks, hesitation, unexpected navigation, form refills, abandonment at a specific moment
- Turn patterns into hypotheses with three parts: observation, mechanism, expected outcome
- Confirm with at least one other data source before acting: Heatmaps, Funnels, or Feedback
- Ship the fix and compare before and after to close the loop