Most heatmap analysis happens in isolation. You open a heatmap, study it, close it, open another one, and try to hold both mental images in your head long enough to draw a conclusion. By the time you are comparing two time periods or two segments, you are relying on memory rather than data.
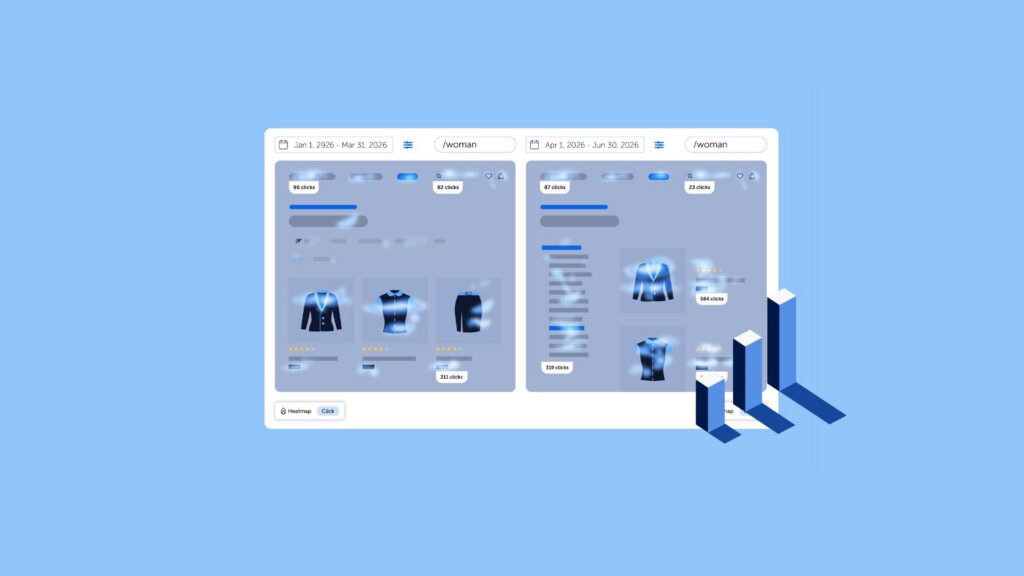
Comparing heatmaps side by side eliminates that problem. Instead of toggling between views, you see both at the same time, with independent controls on each side, so patterns that would otherwise require multiple sessions become visible immediately.
This blog post covers when and why to compare heatmaps, what you can compare in Mouseflow, and how to turn what you see into actionable CRO and UX decisions.
If you want to learn more about heatmaps in general: what they are, which types are available, and what metrics you can analyze with them, visit our heatmap topic page.
Why comparing heatmaps leads to better decisions
A single heatmap answers the question “what are users doing on this page?” Comparing two heatmaps answers a more useful question: “what changed, and for whom?”
Good hypotheses come from noticing contrasts. When you see two heatmaps next to each other, the differences are immediate and undeniable. You stop approximating and start observing. That shift matters in CRO because the quality of your experiments depends entirely on the quality of your hypotheses, and hypotheses grounded in observed behavioral contrast are far stronger than ones based on gut instinct or aggregated metrics alone.
When to use heatmap comparison
Heatmap comparison is useful any time you need to understand a contrast between periods, segments, devices, or pages.
Here are five common scenarios where it makes an immediate difference:
- Measuring the impact of a redesign or content change
Compare the same page before and after a change to see whether user behavior actually shifted in the direction you intended, not just whether your conversion metric moved.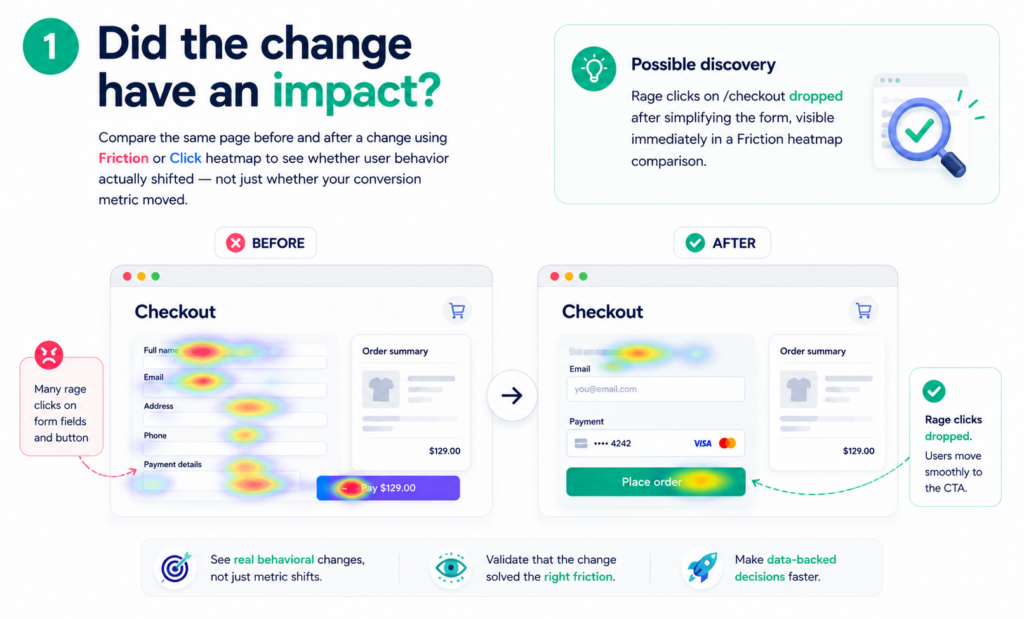
- Comparing how different audience segments behave
Load the same page for two different segments, new visitors vs returning customers, paid search vs organic traffic, or any other filter and see the behavioral gap directly.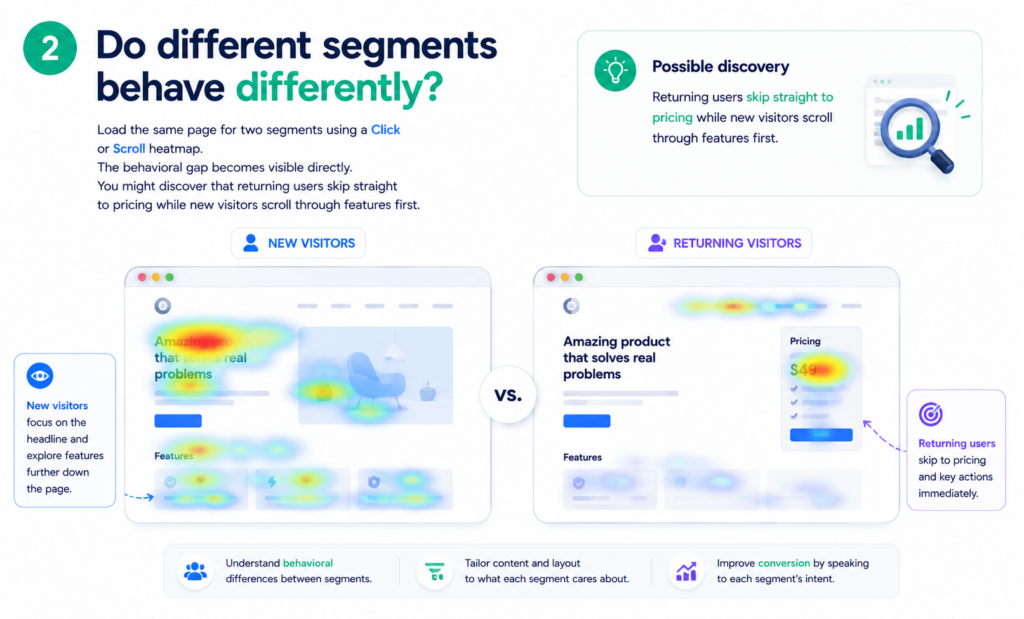
- Understanding mobile vs desktop behavior
Mobile and desktop users often interact with the same page in completely different ways. Side-by-side comparison makes those differences visible without switching between views.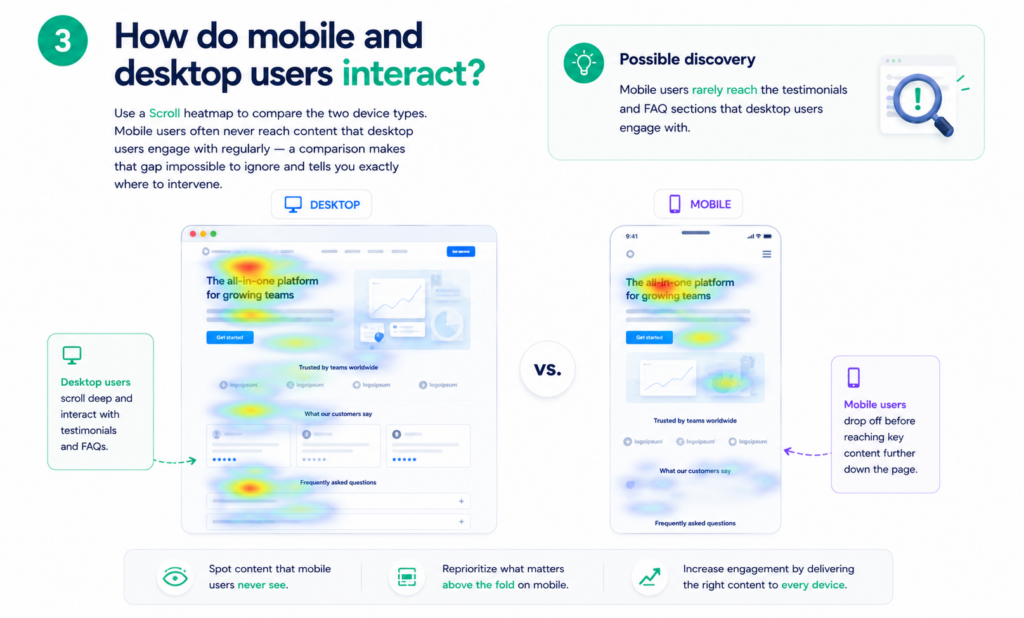
- Adding behavioral context to A/B test results
Your A/B test tells you which variant converted better. Comparing heatmaps for the two variants tells you why, and where the friction or engagement difference actually occurred.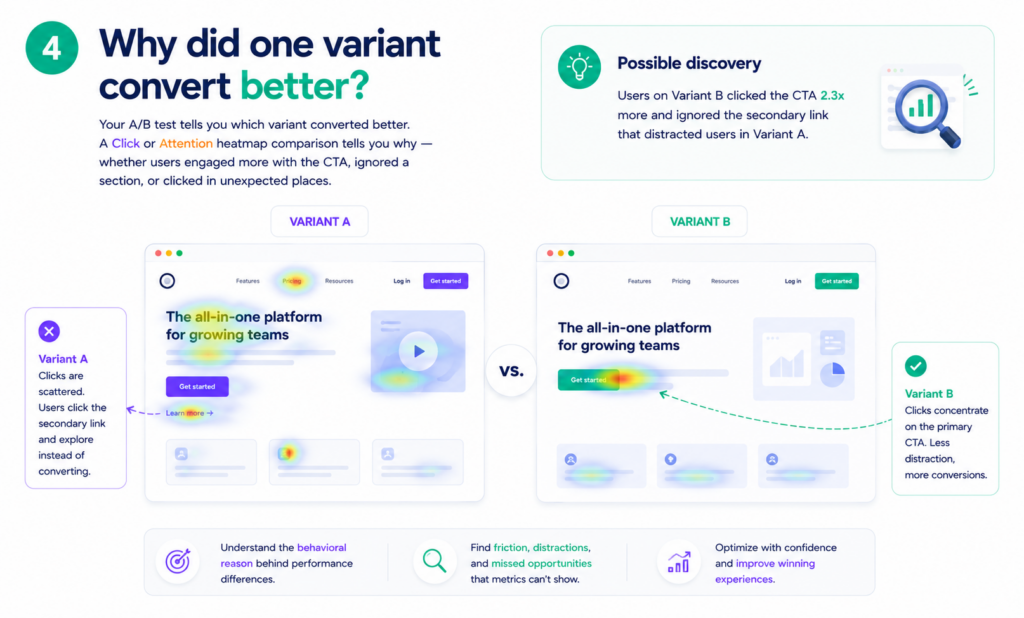
- Tracing behavior across two different pages
Compare how users behave on two pages in the same journey, a landing page and a product page, for example, to spot where engagement drops or attention shifts.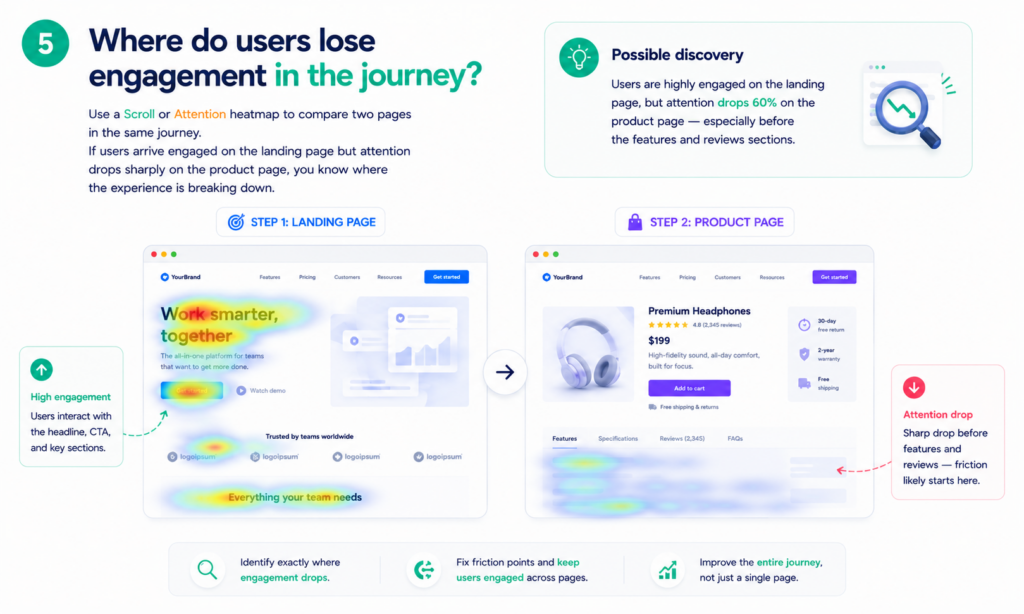
How to compare heatmaps in Mouseflow
Opening a comparison takes three steps:
1) Open any heatmap
Start from the Heatmap list and open the page you want to use as your baseline.
2) Click the Compare button
The Compare button is in the top bar of the heatmap viewer. Clicking it opens a second panel as a copy of the current heatmap.
3) Adjust each panel independently
Each side has its own controls. Set a different date range, apply different filters, switch device type, change the heatmap type, or load a different page on the second panel. The two views update independently so you can compare exactly what you need.
→ Sharing a comparison: your full comparison configuration, including pages, filters, and heatmap types, is encoded in the URL automatically.
Copy the URL from your browser to share the exact view with a teammate. Anyone with access to your Mouseflow account can open it directly.
What you can compare
Each panel in the comparison view has independent controls for five dimensions. You can mix and match them to build the exact comparison you need.
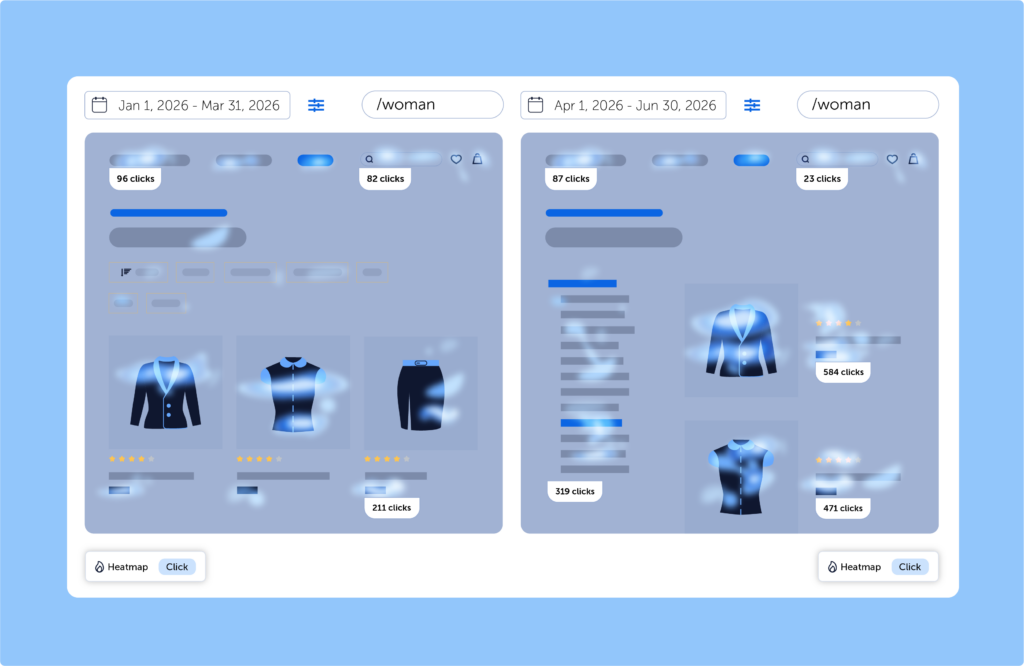
- Date range:
Set a different time period on each side to compare behavior before and after a change. This is the most direct way to measure whether a redesign, a copy update, or a UX fix actually shifted how users interact with a page. - Filters and segments:
Apply different audience filters independently on each panel. All filters available in the Heatmap list are supported, including traffic source, segment, and custom filters. This lets you compare how two different audience groups behave on the same page at the same time. - Device type:
Switch between desktop, mobile, and tablet on each panel using the device shortcut. Comparing mobile and desktop behavior on the same page often reveals significant differences in scroll depth, click patterns, and where users drop off. - Heatmap type:
Switch between Click, Scroll, Attention, Friction, and Movement heatmaps on either side using the type selector in the bottom bar. Placing a Click heatmap next to a Scroll heatmap for the same page, for example, can reveal whether users are scrolling past content without engaging with it. - Page:
Load a different page on the second panel to compare behavior across two pages in the same user journey. Useful for spotting where engagement drops between a landing page and a product page, or between two steps in a funnel.
→ Note: interactive heatmaps are not available in the comparison view. Hover over either panel’s view and click count to see page metrics, including views, clicks, and scroll depth, displayed alongside the heatmap.
How to act on what you see
Seeing a contrast between two heatmaps is the starting point, not the conclusion. The goal is to turn what you observe into a testable hypothesis and then a concrete action.
From comparison to hypothesis
A useful hypothesis names the contrast, explains the likely mechanism, and defines what you expect to happen if you address it. For example: mobile users are rage clicking the pricing section while desktop users are not, which suggests the layout or interactive elements are not rendering correctly on smaller screens. If we fix the mobile layout for that section, rage clicks should decrease and scroll depth past the pricing section should increase.
That kind of hypothesis comes directly from a side-by-side comparison. You could not have formed it from a single heatmap or a conversion metric alone.
Common patterns and what to do with them
Click heatmaps side by side reveal where attention is going and where it is not. If users on variant B are clicking a CTA that variant A users are ignoring, the placement or copy is doing more work than you thought. Test isolating that element.
Scroll heatmaps side by side reveal where users give up. If mobile users drop off at 40% while desktop users reach 80%, the problem is likely a specific element at that scroll depth, a large image, a slow-loading section, or a layout that breaks on smaller screens. Pair with a Friction heatmap on mobile to confirm.
Attention heatmaps side by side show what users actually read versus what they scroll past. A section with high scroll reach but low attention is visible but not engaging, the content or format needs rethinking, not the placement.
Friction heatmaps side by side are the fastest way to validate a fix. If rage clicks on a specific area dropped between periods, the change worked. If they moved to a different area, you solved one problem and created another.
→ One rule for all of them: Do not act on a single session or a single comparison. Use the comparison to form a hypothesis, then validate it, either by making the change and comparing again, or by running an A/B test with behavioral tracking on both variants.
Quick recap
- Comparing heatmaps side by side surfaces behavioral contrasts that a single heatmap cannot show
- Each panel has independent controls for date range, filters, device type, heatmap type, and page
- Open comparison mode from the top bar of any heatmap in Mouseflow
- Share a comparison by copying the URL, the full configuration is encoded automatically
- Use what you observe to form a specific, testable hypothesis before making changes
- Click and Scroll comparisons are available on all paid plans; Friction, Attention, and Movement comparisons require Advanced, Premium, or Enterprise