Heatmaps show you what is happening across all your users. Session Replay shows you why it is happening for specific ones. Use Heatmaps to identify patterns at scale, where users click, how far they scroll, where frustration concentrates. Use Session Replay to investigate the cause behind those patterns, watching what individual users actually did and experienced. The two tools are most powerful when used together, and this article explains how.
This article covers what each tool reveals, the seven types of Heatmaps and what each one is best for, when to reach for Session Replay instead, and how to combine both into a workflow that moves from pattern to hypothesis to action. It also covers Heatmap Comparison, a feature that lets you measure whether a change you made actually shifted user behavior.
If you want to go deeper on either tool before reading on, our topic pages cover Session Replay and website Heatmaps in full.
What each tool reveals
Before diving into specific use cases and workflows, it helps to understand the fundamental difference between the two tools. One works at the level of the individual user. The other works at the level of all users at once. That distinction shapes when each one is useful.
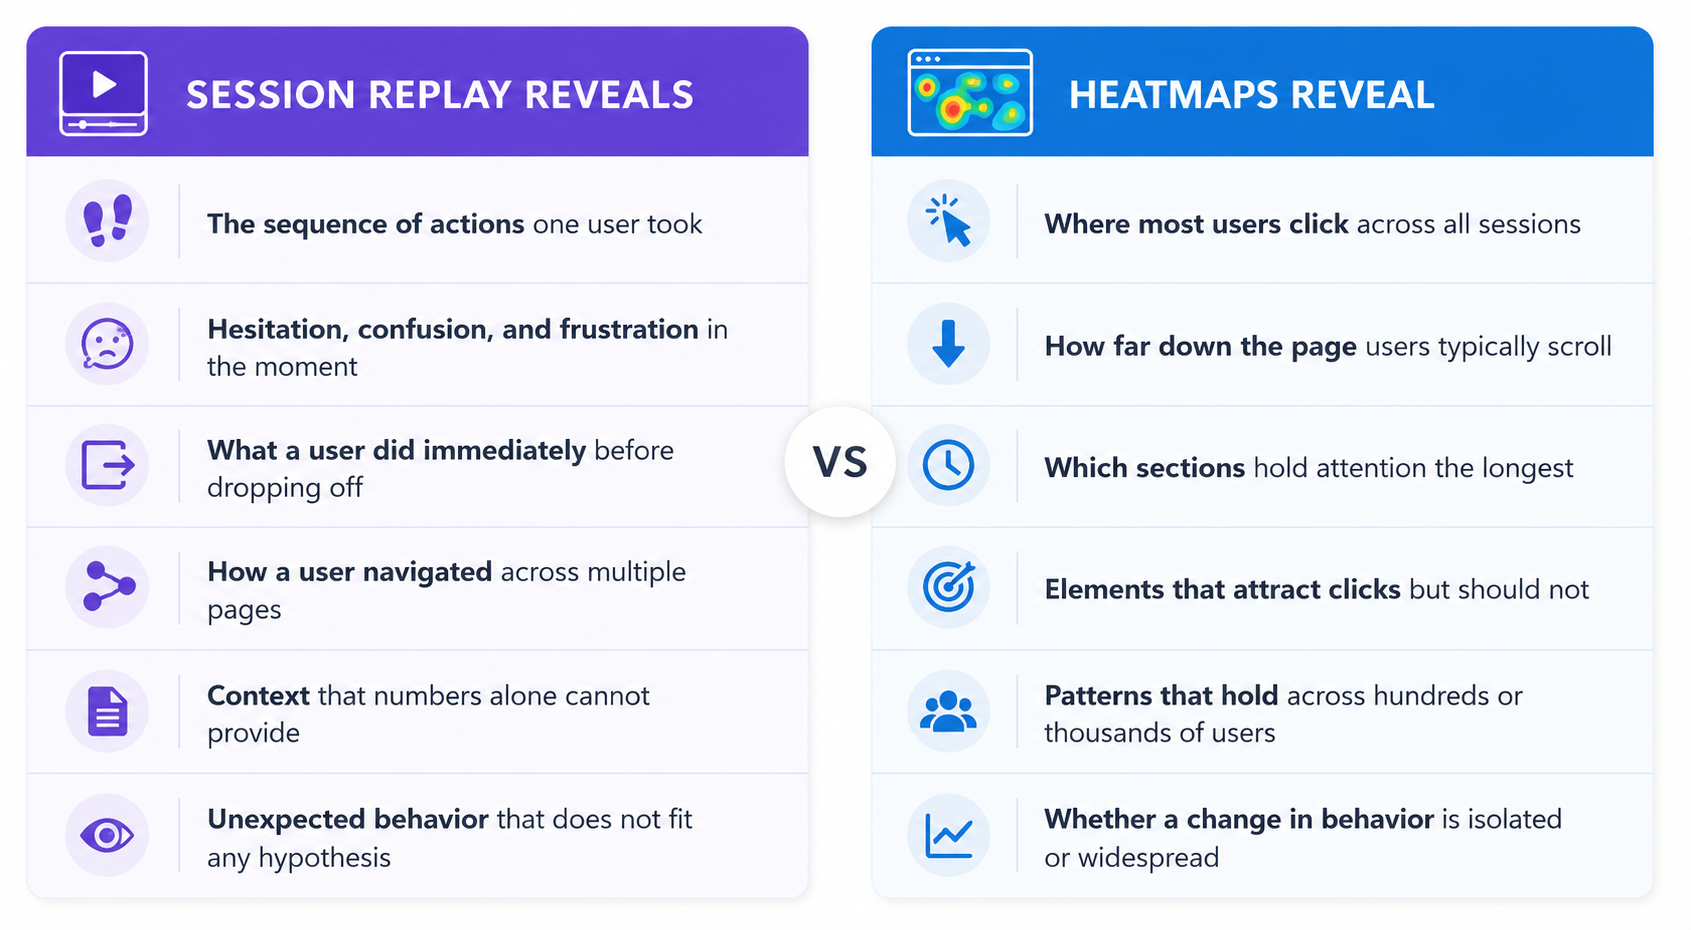
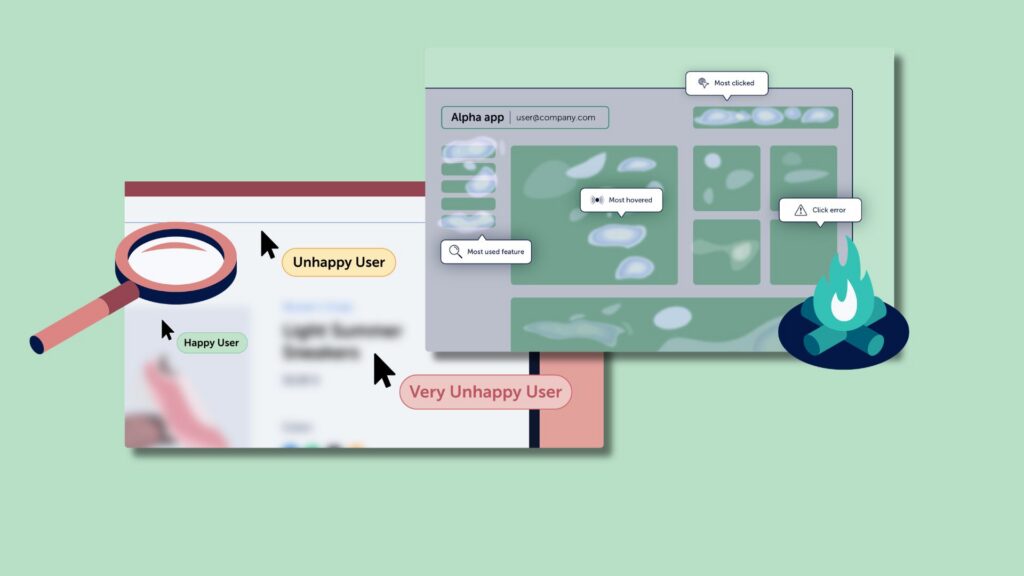
The practical difference is scale and context. A Heatmap shows you that 200 users clicked on a non-interactive image. A Session Replay shows you what happened next for one of those users: did they give up, try something else, or eventually find what they needed? Both pieces of information matter. Neither is sufficient on its own.
What Session Replay is best for
Session Replay is a recording of a real user’s browsing session, capturing mouse movements, clicks, scrolls, and page interactions. It is not a video recording of the user’s screen. It is a reconstruction of the page as the user experienced it. If you want to understand the mechanics of how Session Replay works, that article covers it in detail.
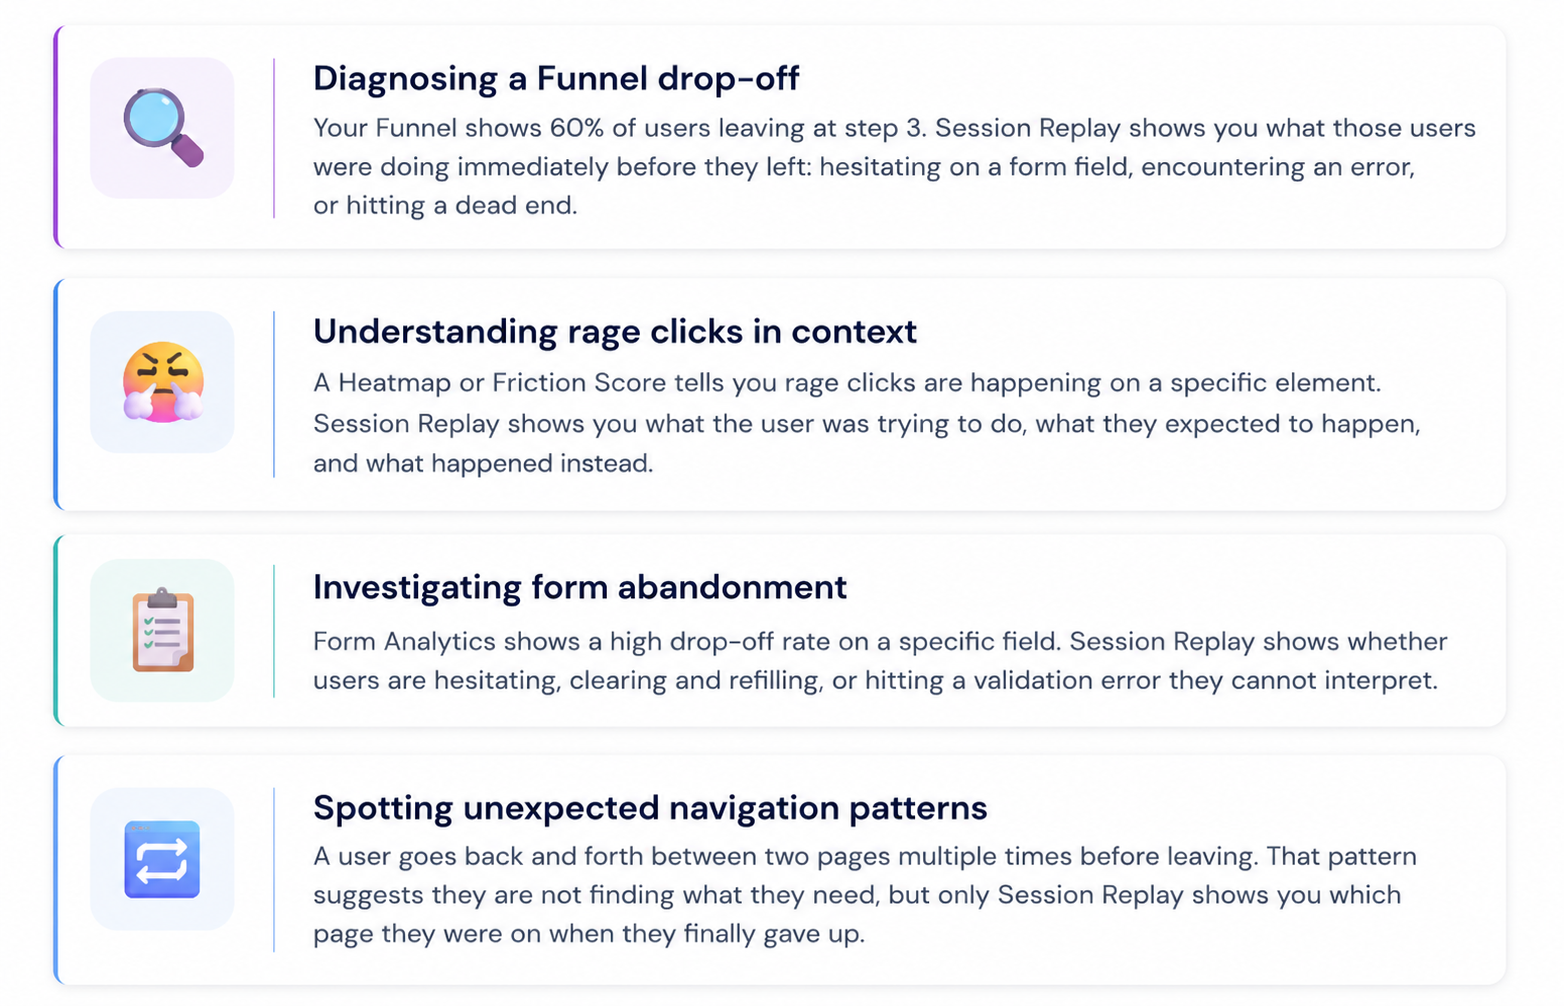
Session Replay is most valuable when you already know where a problem exists and you want to understand why. It is an investigative tool, not a monitoring tool. The key is to approach it with a specific question rather than watching recordings at random. For a full methodology on how to do this effectively, the article on how to analyze Session Replays covers the process step by step.
What Heatmaps are best for
Heatmaps aggregate behavioral data across all sessions and visualize it as a color overlay on the page. They are built for pattern recognition at scale. Where Session Replay gives you depth on one user, a Heatmap gives you breadth across all users.
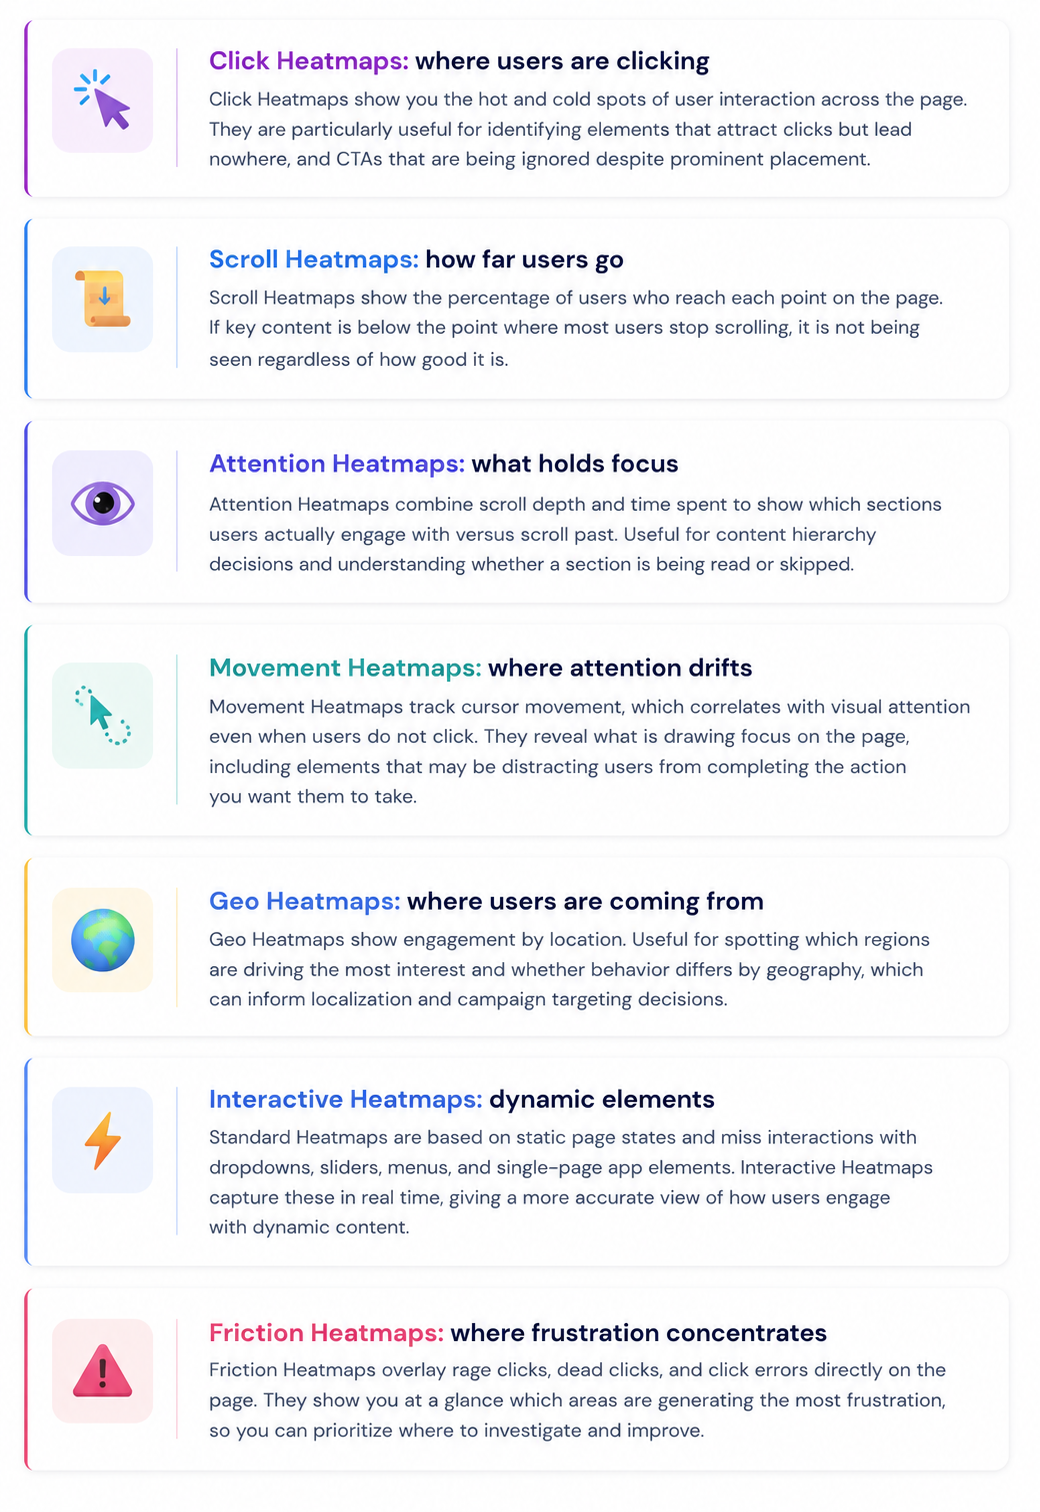
Mouseflow offers seven types of Heatmaps, each revealing a different dimension of user behavior. Understanding which type to use is as important as knowing when to use Heatmaps at all. For a full guide on reading and interpreting what you see, this article on how to interpret a Heatmap is a useful companion.
Comparing Heatmaps across time, segments, and devices
One of the most useful things you can do with Heatmaps is compare them. Mouseflow’s Heatmap Comparison mode lets you open two Heatmaps simultaneously with independent controls for date range, segment, device type, Heatmap type, and page. This makes it straightforward to measure whether a page change actually shifted user behavior, compare how mobile and desktop users interact differently, or add visual context to A/B test results without switching between tabs.
How they work together
The most effective behavioral analysis workflow uses both tools in sequence. Heatmaps identify the pattern. Session Replay explains it.
- Start with Heatmaps to find the anomaly
A Scroll Heatmap shows that 70% of users are not reaching your primary CTA. A Click Heatmap shows that users are clicking on a product image that is not interactive. A Friction Heatmap shows a cluster of rage clicks on a specific section of the checkout page. These are signals, not explanations. - Use the Heatmap to define your Session Replay filter
The Heatmap tells you which page and which behavior to investigate. Filter your session recordings to sessions that visited that page and included that friction event. Now you are not watching random recordings, you are watching the sessions most likely to show you what is happening. - Watch Session Replay to understand the why
Watch 10 to 20 filtered recordings and look for a repeating pattern. What were users trying to do? What stopped them? Did the behavior appear across different device types or traffic sources? You are looking for the mechanism behind the Heatmap signal. - Form a hypothesis and make the change
The combination of a Heatmap pattern and Session Replay evidence gives you a strong foundation for a hypothesis. Make the change, then use Heatmap Comparison to measure whether behavior actually shifted in the direction you intended.→ The rule of confirmation: if a Heatmap shows a problem and Session Replay confirms the same pattern in multiple recordings, you have enough evidence to act. If only one source is pointing at the problem, gather more data before making changes.
Three scenarios where both tools work together
The best way to understand how Session Replay and Heatmaps complement each other is through concrete situations. Each scenario below starts with a signal from a Heatmap and ends with Session Replay providing the explanation needed to act.
- Scenario 1: CTA that is not converting
A Click Heatmap shows near-zero activity on a CTA button despite prominent placement. A Scroll Heatmap confirms users are reaching that section of the page. Session Replay reveals that users are hovering near the button but not clicking, and that many sessions end shortly after.
The hypothesis: the CTA copy or context is not creating enough confidence to click. A change to the copy and surrounding content, validated by comparing Click Heatmaps before and after, confirms whether the fix worked.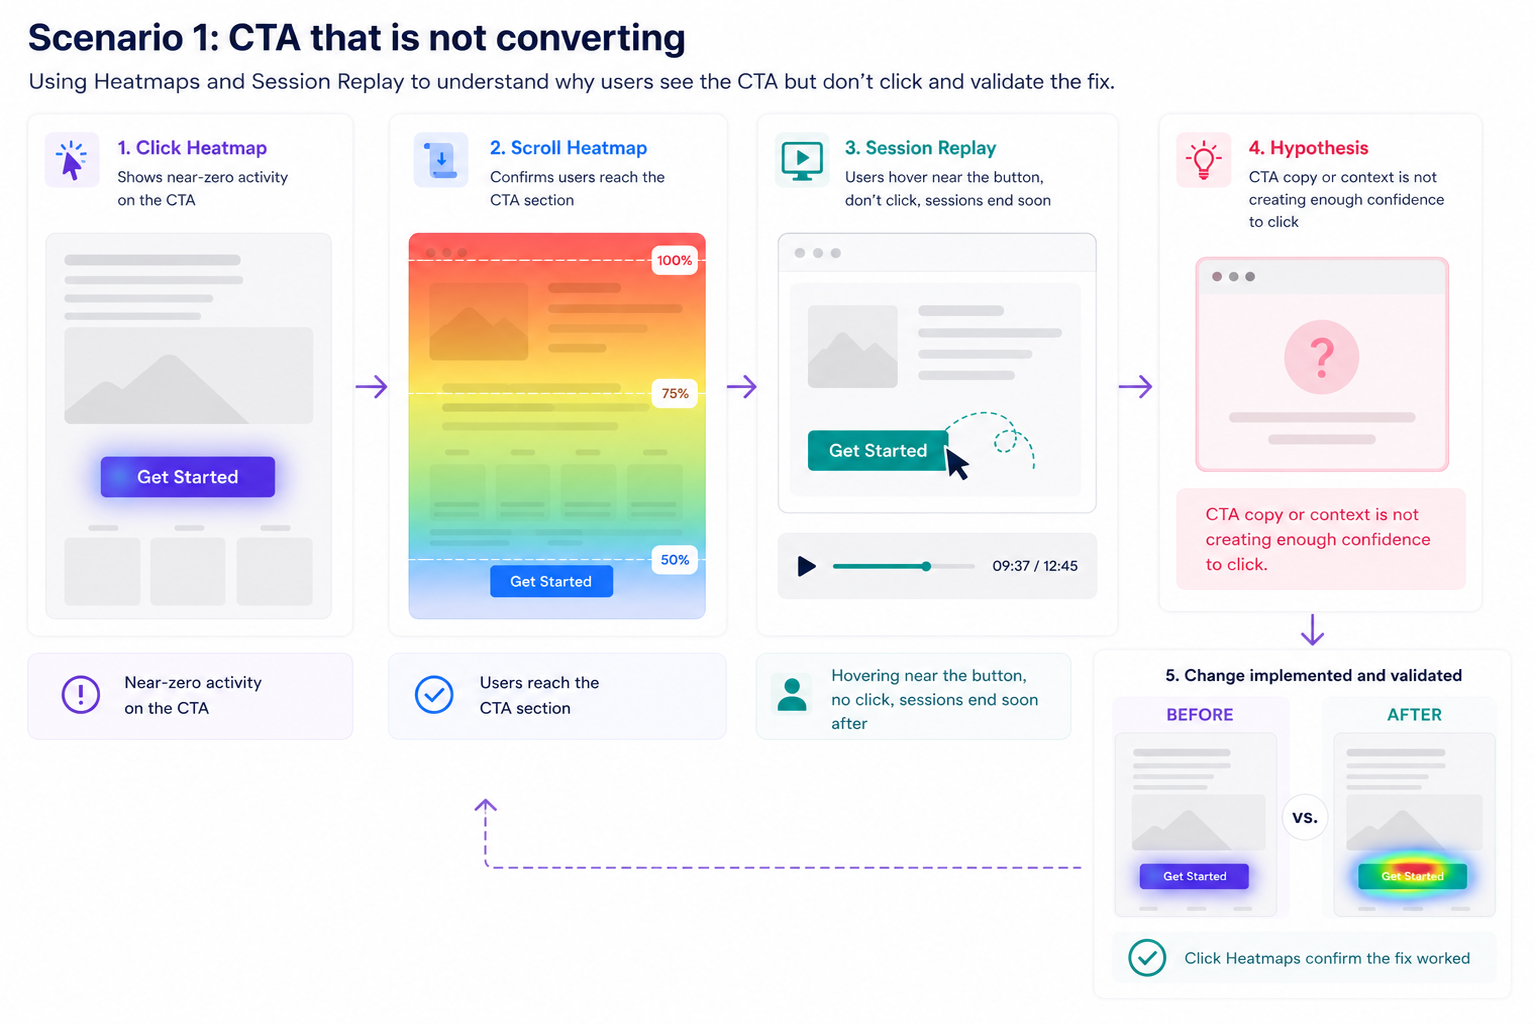
- Scenario 2: Mobile checkout drop-off
A Friction Heatmap on the checkout page shows a concentration of rage clicks on a specific form field, but only on mobile. Session Replay filtered to mobile sessions on that page shows users repeatedly tapping a field that is not responding correctly.
The hypothesis: the input field has a mobile rendering issue. The fix is targeted, the impact is measurable, and a follow-up Heatmap Comparison confirms the rage clicks dropped after the fix.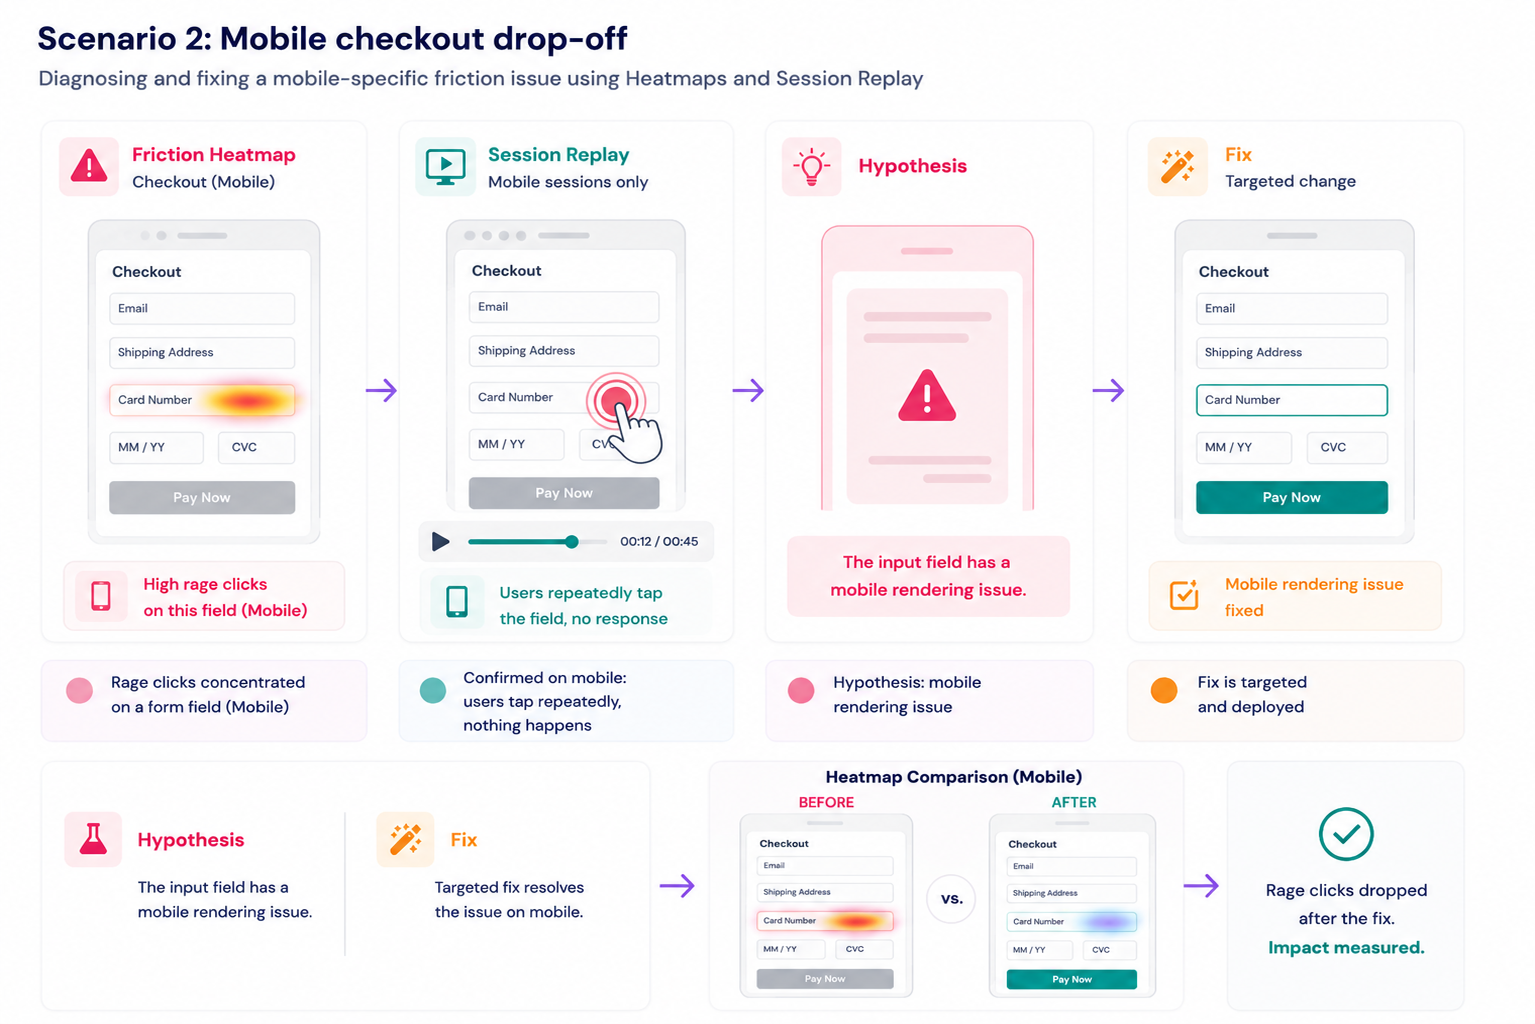
- Scenario 3: Content that is not being read
An Attention Heatmap shows that a key product feature section is receiving almost no engagement despite sitting above the fold. A Movement Heatmap reveals that cursor movement jumps over it entirely. Session Replay shows users scanning the hero section and jumping straight to pricing without engaging with the feature section at all.
The hypothesis: the content may be well written but the section is not formatted or positioned in a way that matches how users are actually reading the page. Restructuring the section, reducing its length, or moving key information higher may improve engagement. A Heatmap Comparison before and after the change will confirm whether attention shifted.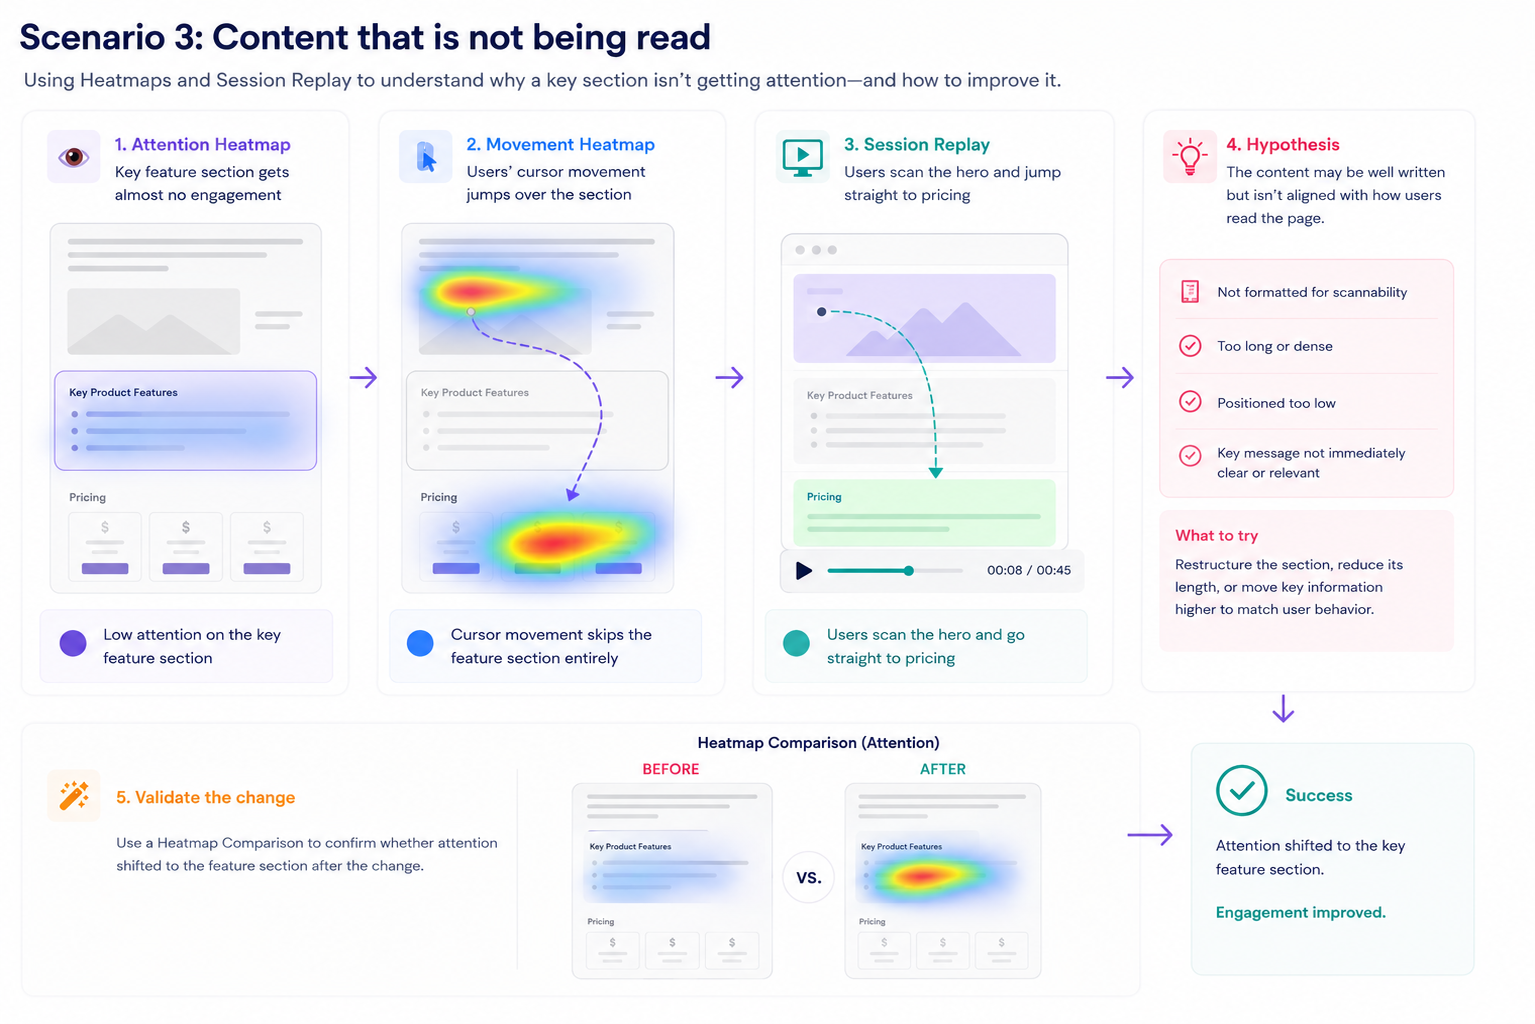
When to use each
- Use Heatmaps when you want to understand patterns across all users: where they click, how far they scroll, what holds their attention, and where frustration concentrates
- Use Session Replay when you want to understand why a specific pattern exists: what individual users were trying to do, what stopped them, and what happened in sequence
- Use both together when you want to move from observation to hypothesis: Heatmaps identify the signal, Session Replay explains it, and Heatmap Comparison confirms whether your fix worked
- For a deeper guide on using Session Replay systematically, see how to analyze Session Replays
- For a full overview of Heatmap types and how to read them, see the ultimate guide to Heatmaps
- To measure behavioral change across time periods or segments, use Heatmap Comparison mode