
The Website Analytics Dashboard is a pre-built Claude Project: a workspace where your setup, context, and Mouseflow connection are saved once and carry over to every future session. After connecting Claude to your Mouseflow account via the MCP connector, there’s nothing else to configure.
From then on, you can ask things like “Generate a Q2 report” or “Show me trends from the last 3 months” and Claude builds a complete interactive dashboard from your live data, with trend analysis, friction signals, funnel drop-offs, form conversions, and prioritized action items. It feels less like running a one-off AI prompt and more like having a dedicated analytics assistant continuously connected to your Mouseflow workspace.
What you get
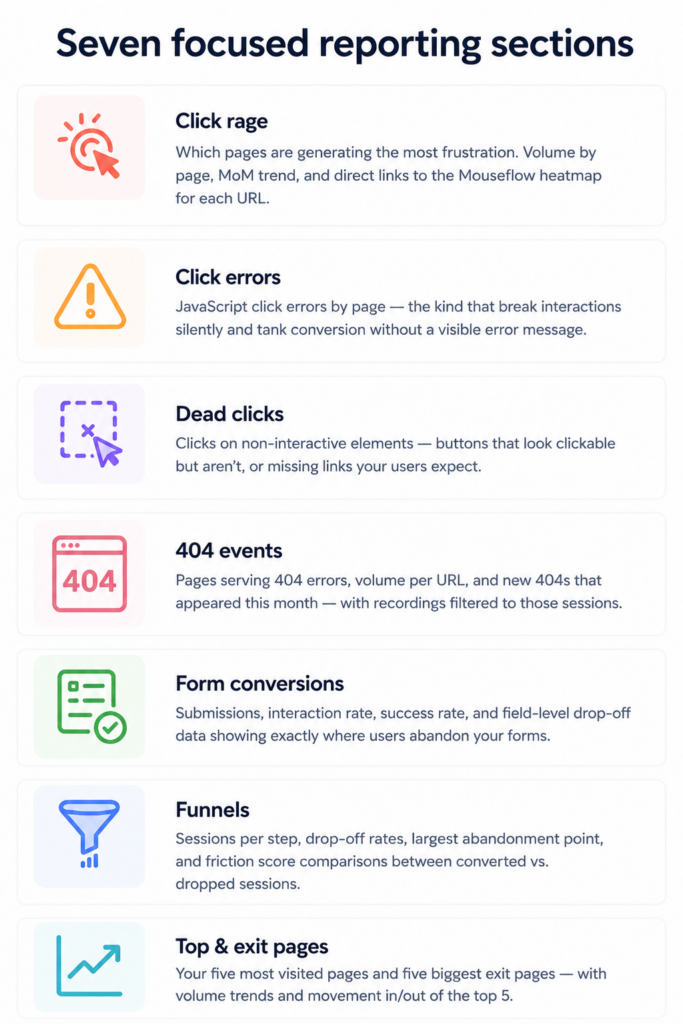
Once connected to your Mouseflow workspace, Claude automatically analyzes your behavioral data and organizes it into seven focused reporting sections, all consolidated into a single interactive dashboard generated on demand.
Just ask for a time period like “last month” or “Q2 performance” and Claude builds a complete overview with trends, friction signals, and direct investigation links.
Each section surfaces a different layer of user behavior and conversion friction
The Executive Summary drawer
This is where the dashboard earns its place in day-to-day CRO work. Every reporting section includes a collapsible drawer on the right side of the screen that turns raw metrics into a prioritized narrative automatically. Instead of manually interpreting charts and trends, you get a clear explanation of what changed, why it matters, and where to investigate next.
The drawer covers four areas for each section: key metrics with month-over-month deltas, a short narrative on what the data shows, flagged anomalies ranked by severity, and recommended actions with direct links into Mouseflow. All of it is pre-computed during data collection, not generated on the fly when you open the drawer, so the analysis is always grounded in the actual numbers from the period you requested.

The Executive Summary drawer open on the Click Rage tab – key metrics, narrative insights, flagged anomalies, and recommended actions, all pre-computed from your Mouseflow data.
Why this matters for CRO and marketing teams
For CRO and marketing teams, the dashboard removes the manual work between data and decision, no exports, no spreadsheets, no switching between tools.
 From hours to seconds: Multi-month analysis that used to require exports and spreadsheets now runs in a single conversation.

Always consistent: The same seven sections, same flags, same structure, every report. Easy to compare across periods.
 Clickable, not static: Every flagged page links directly to the relevant heatmap or filtered recording view in Mouseflow.
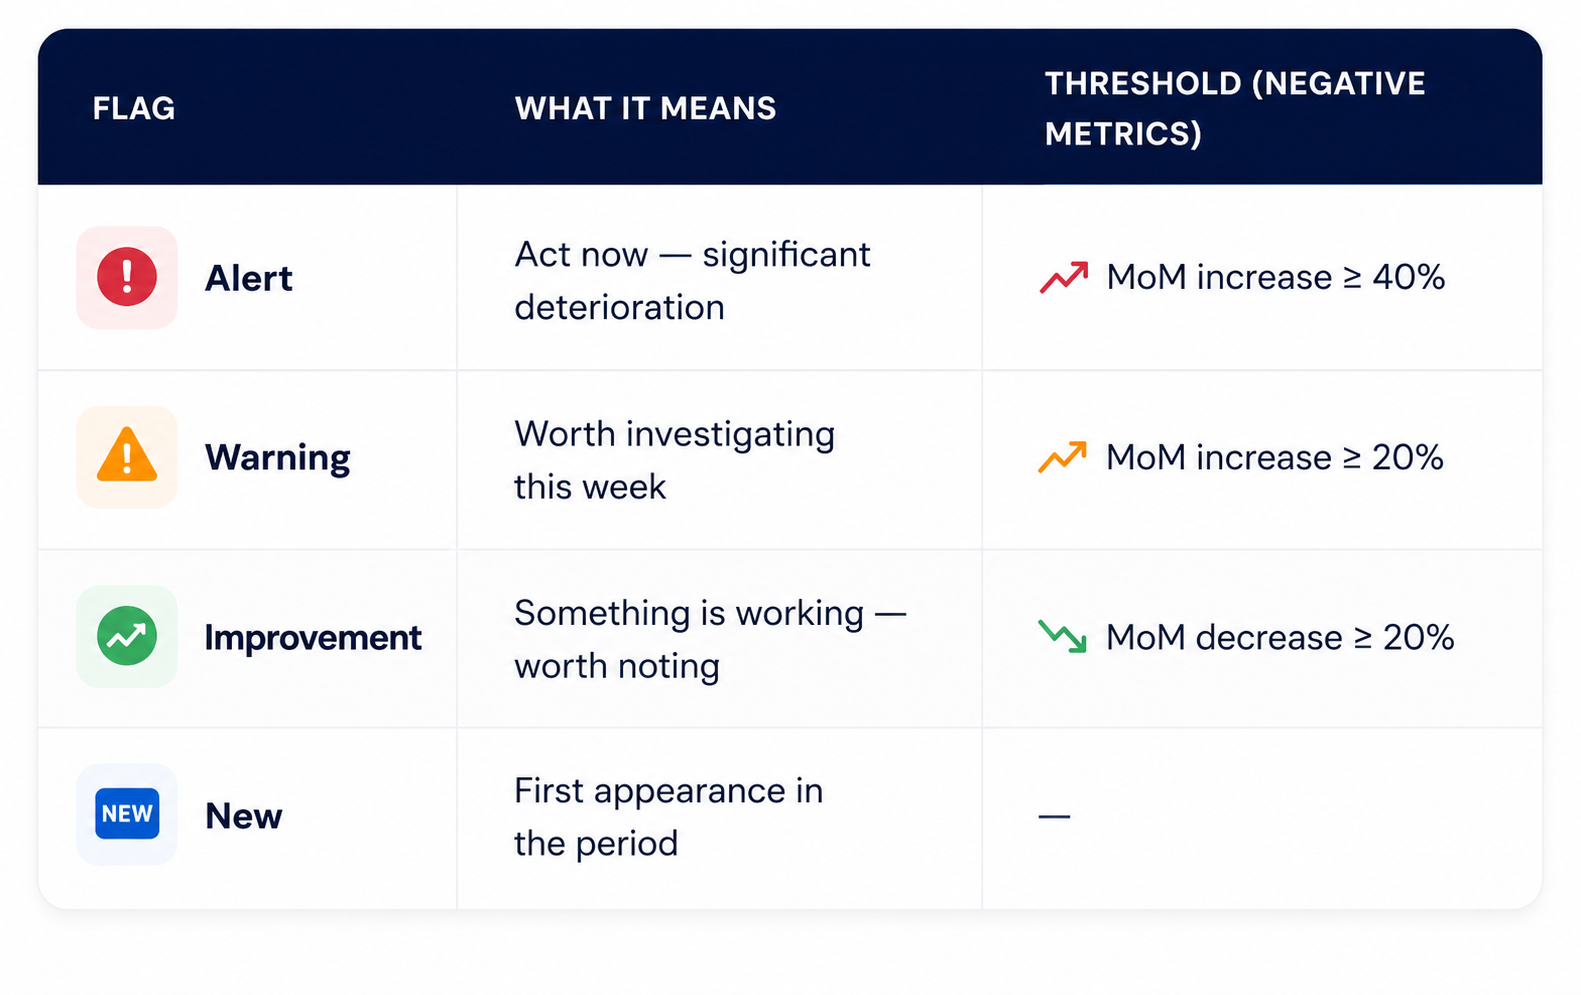
 Automatic flagging: Spikes and drops are flagged automatically, red for urgent, amber for watch, green for improvements.
What the dashboard doesn't do
Before you set it up, it’s worth knowing what falls outside the scope of what’s available via the Mouseflow MCP connector today.
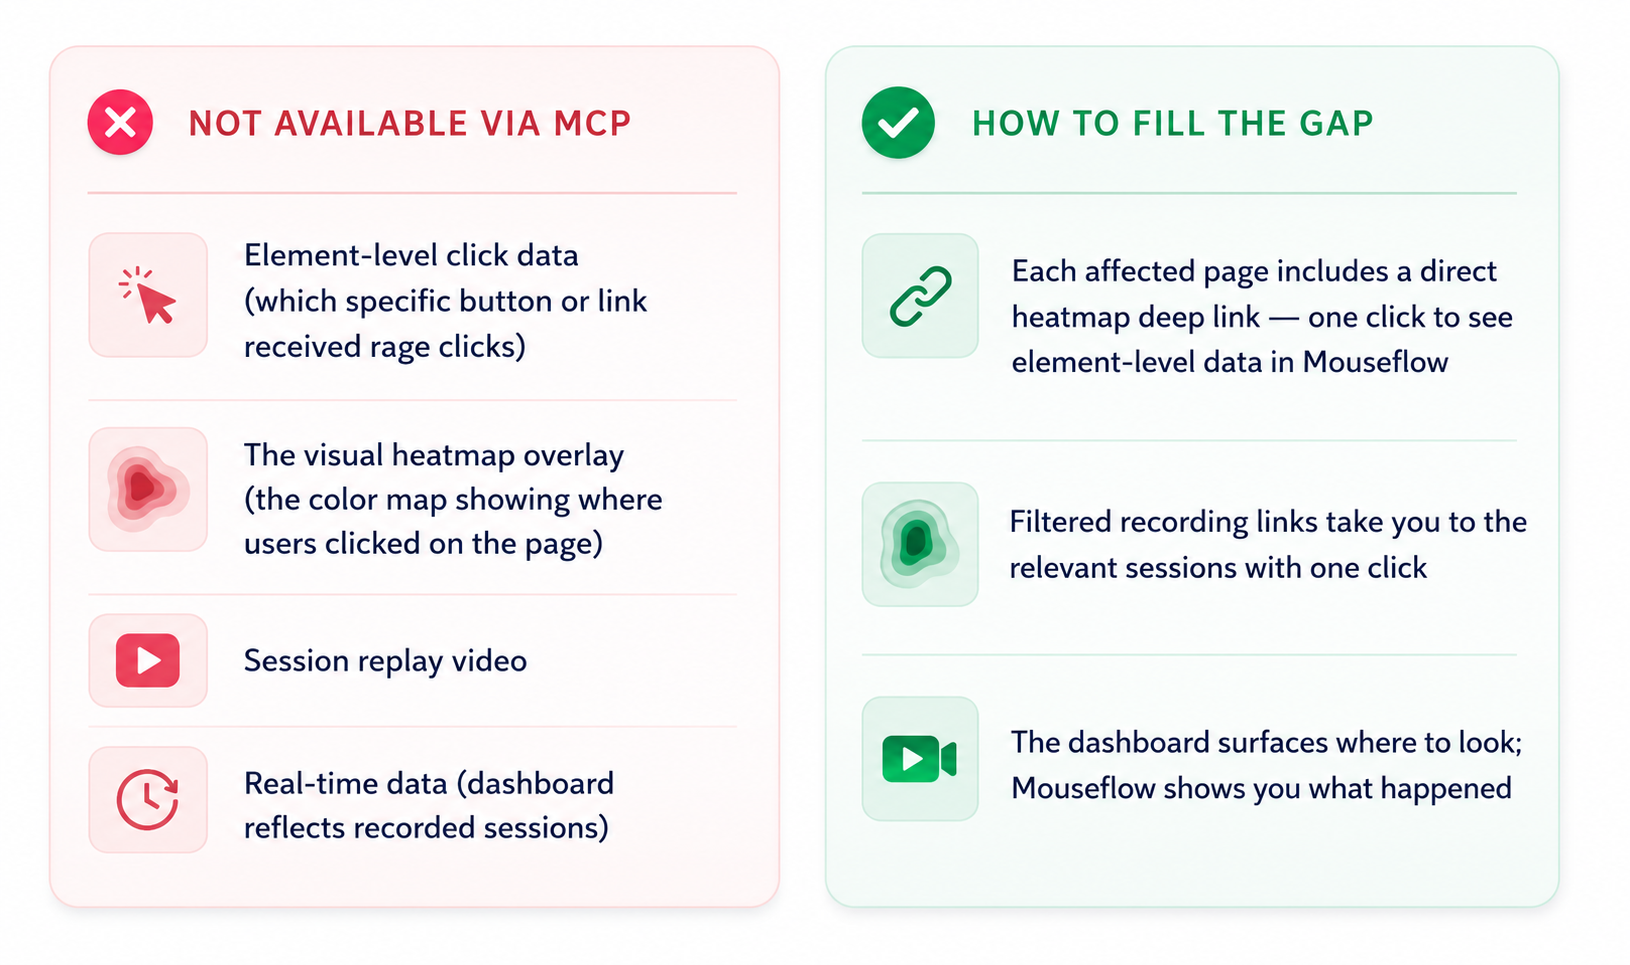 Think of the dashboard as your triage layer. It tells you what needs attention and where to look. The actual investigation, watching recordings, reading heatmaps, still happens in Mouseflow.
How to set it up
Setup takes about five minutes and you only do it once.
1 – Connect the Mouseflow MCP in Claude:
In Claude, go to Settings → Integrations and connect the Mouseflow MCP connector. This gives Claude live access to your Mouseflow data, recordings, heatmaps, funnels, forms, and friction metrics.
2 – Create a new Claude Project
In Claude, click New Project. Name it something like “Mouseflow Dashboard” or “Website Analytics.” Projects let you save instructions that persist across every conversation in that workspace.
3 – Paste the project instructions
Open the Project Instructions field and paste the full Website Analytics Dashboard block from the setup article. It starts with the heading “Website Analytics Dashboard – Project Instructions” and runs all the way to the end of that section, everything from Role & Purpose through the API Capabilities Reference table.
The instructions are long by design, don’t trim them.
4 – Add your Website ID
Use Ctrl+F (or Cmd+F on Mac) to find every instance of websiteId in the instructions and replace it with your actual Mouseflow Website ID. You can find this in Mouseflow under Settings → Website Settings. That’s the only value you need to edit manually, Claude retrieves form and funnel IDs automatically on the first run.
5 – Run your first report
Start a conversation inside the project and ask for a time range. Claude will query each section month by month and generate the full interactive dashboard
How to use the dashboard
Once the project is set up, using it is straightforward. You ask in plain language, Claude handles the rest.
- Requesting a time range
Claude understands natural date ranges and breaks them into monthly queries automatically.
Example prompt: “Build the dashboard for Q1 2026”
- Reading the flags
Every section applies automatic flags so you can see what needs attention without reading every number:
The flagging logic adjusts depending on the metric type. For friction signals like rage clicks or 404s, an increase is the problem, so alerts fire when numbers go up. For positive metrics like pageviews or form submissions, it’s the opposite, alerts fire when numbers drop. For conversion rates specifically, the threshold is measured in percentage points rather than relative change.
- Going deeper with recordings
Every flagged page in the dashboard includes a View in Mouseflow button that takes you directly to the relevant session recordings, pre-filtered by page URL and friction type.
Click it and you land exactly where you need to be, with no manual filtering required.
Quick recap
- Connect the Mouseflow MCP in Claude Settings
- Create a Claude Project and paste the instructions from the setup article
- Replace websiteId, formId, and funnelId with your own values
- Ask Claude for any time range, it queries month by month and builds the dashboard
- Open the Executive Summary drawer on each tab for narrative analysis and prioritized actions
- Click any flagged page to go straight to filtered recordings in Mouseflow
- Element-level data (which specific element) lives in the heatmap, use the deep link included for each page