This post was updated in July 2024 to include LogRocket.
If you want to know why your website visitors behave the way they do, you need a heatmap/session replay tool to visualize their behavior. Heatmaps and session replay tools always go hand in hand, because of how they capture the data. They are the two essential parts of every behavior analytics suite that often offer other features relying on the same technology.
In this post, we’re going to explore the list of features a behavior analytics tool usually has, and provide some guidance on how to choose the one that works best for you. Also, we’ll give a detailed analysis of the pros and cons of 9 best session replay tools and best heatmap tools.
How to Choose a Heatmap/Session Recording Tool
Behavior analytics platforms differ in additional features, UIs, data processing, and pricing models. So, the key to choosing the one that’s right for you is understanding what you actually want from it, how easy it is to get this information from the tool, and how much it i going to cost you.
Key Features of Behavior Analytics Platforms
Behavior analytics platforms typically come with a range of features, each providing the website owner with unique insights into user behavior:
- Heatmaps: These show users’ activity on the page, such as clicking, scrolling, or moving the mouse cursor. If you’re new to heatmaps, here’s a detailed guide on what a heatmap is.
Most behavioral analytics suites offer at least 3 types of heatmaps – click, mouse movement, and scroll heatmaps. Some platforms provide other kinds of heatmaps such as real-time heatmaps for dynamic websites, attention (or eye-tracking) heatmaps for understanding where users pay attention to, and geo heatmaps to see where your users come from.It’s worth noting that some vendors provide heatmaps that are more precise than what others offer, so it’s worth checking independent reviews to see if various users of a certain heatmap analytics tool mention poor quality of their heatmaps (clickmaps in particular, because in their case heatmap data is easier to compare with data from other sources such as Google Analytics).
- Session replays: These are actual reconstructions of your users’ sessions. They look more or less the same on each platform, but they can offer different usability improvements such as marking some friction events during the replay that could’ve impacted user experience. Also, the visual quality of replays can be different because of how different session replay tools work. Some tools capture replays for all sessions, some don’t. Here’s what you can learn from session recordings.
- Conversion funnels: This feature allows users to build funnels to see how users progress towards reaching a certain goal. Funnels also often look similar, but the devil is in the details. For example, some platforms allow you to get data instantly if the tracking script was installed on the website for some time, while others take time to gather data after setting up each funnel. Some tools also offer to see the session replays of people that dropped out at each stage.
- Feedback survey tools: Many behavior analytics platforms allow you to trigger surveys or feedback prompts when users perform certain actions on a website. Here, the difference can be in events on which feedback is triggered, design and customization of the pop-ups, and the amount of feedback questions available. Some tools have integrated AI to help with generating questions.
- Form analytics: This feature allows you to analyze and improve the performance of the forms you use on the website, revealing abandonment points. This tool really makes a difference if you care about capturing leads or checking out carts. It’s more rare than the others we’ve described above, but several behavior analytics platforms have it in their toolset. Read more about form analytics.
- UX score/Friction score: Behavior analytics tools capture a lot of user events including so-called rage clicks, dead clicks, and click errors. These are called friction events, because they usually signal that the visitor had some unpleasant experience during the session. Capturing these events allows behavior analytics platforms to offer error reporting – highlighting if the user encounters an error on the website. Also, some tools calculate an index for a website or a web page depending on the amount of friction events visitors encounter there.
A few behavior analytics platforms offer other features such as user journey mapping, A/B testing, or visual privacy tools, but these are rare.
Other Things to Keep in Mind
Aside from the difference in main features that they offer, behavior analytics platforms may have other properties that can be important for you.
- Compliance with data privacy regulations. If you’re working with Europe, California, Brazil, or many other countries with local data privacy laws, your website needs to be compliant with them, and so should be the 3rd party tools you use for data collection and processing, such as the heatmap software that you use. Not all behavior analytics vendors are compliant with all regulations. However, most from the list we are looking into today are.
- Data retention. Behavior analytics platforms don’t keep the captured data forever. Some, like Microsoft Clarity, offer only 30 days of storage, while others, like Mouseflow, can offer a whole year. More often than not, the data retention period depends on the plan you choose. The more you’re paying to the behavior analytics provider, the longer they are happy to keep the captured data.
- Integrations. Most heatmap and session replay software vendors make sure that their tools integrate with the rest of the tech stack that you may be using, such as Google Analytics 4 or Adobe Analytics, A/B testing tools like Convert or Kameleoon, eCommerce Platforms like WooCommerce and Shopify, and so on. Integrations help pass data from one tool to another seamlessly to simplify getting valuable insights. Some platforms have more integrations than others. Before committing to a platform, check that it has the integrations that you’ll need.
- Pricing. That’s often the most important part, because different platforms have completely different approaches regarding what you get for what you pay. For example, some providers, like Mouseflow, offer all features on all plans. The difference between plans is only in the number of sessions the tool will record per month.Others, like Hotjar and VWO, for example, offer certain features only on more expensive plans. Also, Hotjar charges a separate fee for using its feedback and survey tools, no matter what plan you choose, while most other providers bundle all their features together in one package at least on some plans.
- Sessions vs recordings. That’s another aspect of pricing. Some platforms, like Mouseflow, record every session. So, the number of sessions and recordings you get on a certain plan is the same. Most others use data sampling, and, while they offer a certain limit of sessions, they don’t record each session. Another example is Microsoft Clarity, which doesn’t use data sampling, but still doesn’t allow you to watch every recording. So, watch out if there’s a different number of sessions and recordings in the plan that a tool offers.
| Mouseflow | Microsoft Clarity | Hotjar | VWO Insights | Smartlook | CrazyEgg | FullStory | |
| Session replay | ✅ | ✅ | ✅ | ✅ | ✅ | ✅ | ✅ |
| Heatmap types | Click Scroll Movement Attention Geo Live |
Click Scroll Area |
Click Scroll Movement Engagement Rage click |
Click Scroll Area Live |
Click Scroll Movement |
Click Scroll Confetti Overlay |
Click Scroll Error Rage Click Dead Click |
| Conversion funnels | ✅ | ❌ | ✅ | ✅ | ✅ | ❌ | ✅ |
| Form analytics | ✅ | ❌ | ❌ | ✅ | ❌ | ❌ | ❌ |
| User Feedback | ✅ | ❌ | ✅ | ✅ | ❌ | ✅ | ❌ |
| Friction / UX score | ✅ | ❌ | ✅ | ✅ | ❌ | ❌ | ❌(can be set up manually) |
| User journey mapping | Coming soon | ❌ | ❌ | ❌ | ✅ | ❌ | ✅ |
| Unique features | Visual privacy tool | ❌ | User testing | ❌ | Crash reports | A/B testing | Omnisearch |
| No Sampling | ✅ | ✅ | ❌ | ❌ | ✅ | ❌ | ✅ |
| Data retention | 1-12 months | 1 month | 12 months | 7 days – 3 months | 1-3 months | 12-24 months | 1 month for replays, 12 months for data |
Now, let’s discuss each tool in detail. We leave it up to you to decide which one is best for you.
Mouseflow
Mouseflow is a website behavior analytics platform used by 210,000 digital marketers, eCommerce managers, conversion rate optimization (CRO) specialists, product managers, and others. Founded back in 2009, Mouseflow is one of the oldest players in the field of behavior analytics and one of the most well-known. It’s designed to help companies of all sizes – from small businesses to enterprises – understand how visitors interact with their websites, identify usability issues, and improve conversion rates.
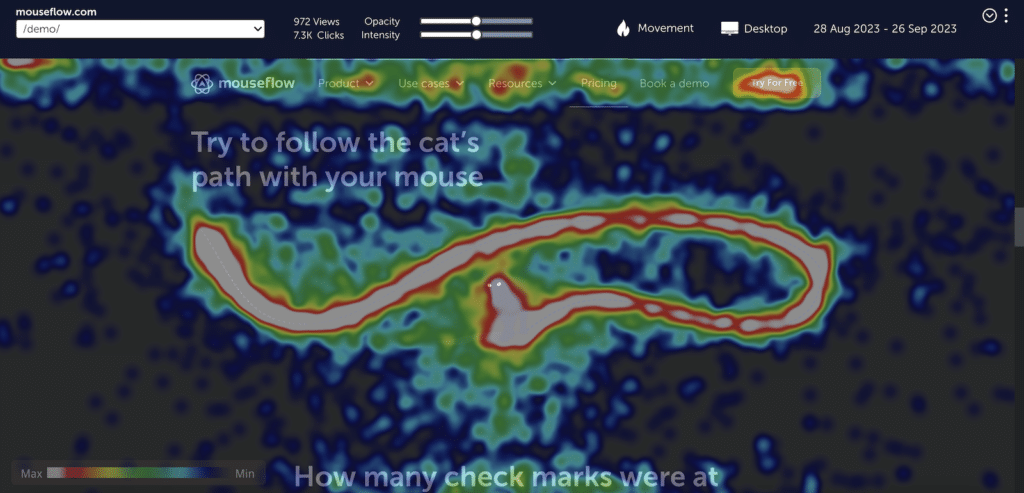
Mouseflow movement heatmap screenshot
What Tools Does Mouseflow Offer?
- Session replay tool: Records user sessions showing exact mouse movements, clicks, scrolls, and keystrokes, as well as highlighting friction events.
- Heatmap tool: Provides 6 types of heatmaps, from basic click, scroll, and movement heatmaps, to real-time, geographic, and attention heatmaps. When it comes to heatmaps, Mouseflow offers a more diverse spectrum than any other tool on the market.
- Form analytics: Offers detailed insights into how users interact with forms, including drop-off and struggle points.
- Funnels: Analyzes user paths and identifies where visitors are dropping off in the conversion process.
- Feedback surveys: Collects user feedback through customizable surveys and feedback forms.
- Friction score and friction events: Mouseflow captures 7 (6 predefined + custom that you can set up however you like) types of friction events, including click-rages and click-errors. For each website, each page, and each session it generates a friction score that can be used as a key metric for user experience on the website.
- Visual privacy tool: The visual privacy tool allows to exclude elements such as form fields from being tracked simply by selecting them on a website. It’s different from masking that many other tools use, as the sensitive data is completely excluded from the capture. It never leaves the website visitor’s computer.
Mouseflow Pros and Cons
Pros:
- Automatic heatmaps for every page: Mouseflow automatically builds 6 types of heatmaps for every tracked page. There’s no need to set them up, everything works out of the box. Most other tools require you to set up heatmaps manually, and start collecting data for them only upon setup.
- Form analytics: Mouseflow offers a form analytics feature that not many other tools have. Form analytics is extremely important for lead capture optimization. It helps increase form submission rate and allows you to find out what went wrong for those visitors who have abandoned forms.
- Custom tags: Mouseflow allows you to tag any user interactions using a visual no-code tool, creating custom events for these tags. It opens endless possibilities for in-depth analysis of user behavior based on your specific needs.
- Advanced segmentation and filtering: Mouseflow provides powerful segmentation and filtering options, allowing users to drill down into specific data sets easily.
- A broad set of integrations: Mouseflow integrates with many tools, including eCommerce platforms, analytics suites, A/B testing tools, and more. For details, visit Mouseflow’s integration page.
- Great support: G2 users often point out that Mouseflow support is very easy to reach, and very responsive.
- Compliance: Mouseflow is fully compliant with all data privacy regulations, including GDPR, CCPA, and others. For more information on compliance, visit the legal hub.
Cons:
- No A/B testing tool. To compensate for that, Mouseflow offers integrations with most popular 3rd party A/B testing tools.
- No user journey mapping tool (yet).
Mouseflow Pricing
- Free plan: ✅
Mouseflow offers a free plan with all features, that is suitable for small websites or those just starting with user behavior analytics. Additionally, it offers free trials for paid plans.
- Pricing: The pricing for paid plans starts at $31 per month, scaling up based on quantity: more recorded sessions, more tracked websites, longer data storage. Enterprise-grade plans are available with custom pricing to suit larger businesses’ needs. Check out detailed Mouseflow pricing.
Mouseflow Demo
Mouseflow has a public interactive demo, you can take a look at Mouseflow’s interface and get a glimpse of how to use it to solve problems. You can also request a personal Mouseflow demo if you want.
Our Verdict on Mouseflow
We obviously are going to be somewhat biased here. From our perspective, Mouseflow is a well-rounded tool that’s equally well-suited for SMBs and bigger companies. Its stronger sides are automatically generated heatmaps (all 6 types of them), its form analytics feature that is invaluable for leadgen and eCommerces, and the level of customization available for users. Also, Mouseflow records every session, which is not a common thing in the world of behavior analytics.
The downsides are, perhaps, not the most modern UI, and the lack of user journey mapping. Mouseflow’s pricing is quite generous, considering that it offers all features on all plans.
Hotjar
Hotjar is, perhaps, the most well-known behavior analytics platform. Founded in 2014, Hotjar has carved out a significant niche in the market by offering a blend of both analysis and feedback tools to understand user interactions, get behavior insights, and improve website performance. Hotjar’s audience is primarily small- and medium-sized businesses, with its more expensive sibling, Contentsquare, catering to the enterprise segment. Hotjar was acquired by Contentsquare in 2021.
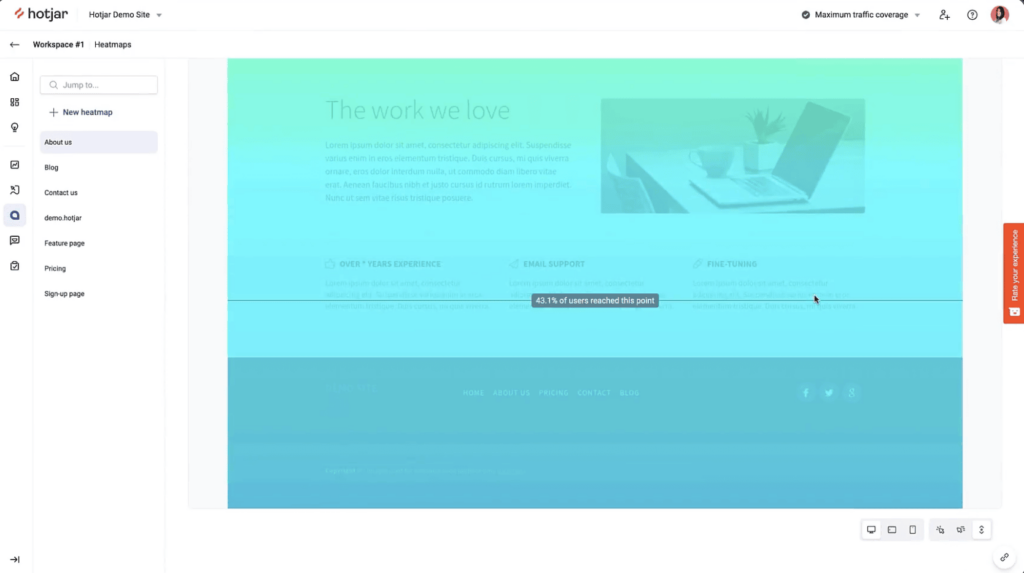
Hotjar scrollmap example. Source: Hotjar webiste
What Tools Does Hotjar Offer?
- Heatmap tool: Hotjar offers click, scroll, and movement heatmaps.
- Session replay: Records user sessions, giving a visual understanding of user actions and navigation paths.
- Conversion funnels: Analyzes where users are dropping off to identify potential improvements in the user journey.
- Feedback tool: Hotjar offers a user feedback tool as a part of their Ask package.
- User surveys: Another part of Hotjar’s Ask suite is a survey tool with built-in AI that helps to come up with questions.
- User interviews: Hotjar also provides a user testing tool, giving you the option to connect with users 1:1. They call this tool Engage.
Hotjar Pros and Cons
Pros:
- User-friendly interface: Hotjar has an intuitive UI/UX, and the learning curve isn’t steep.
- Insights: you can extract and save key insights from heatmaps and session recordings to share them with others.
- Powerful and easy feedback tool: Hotjar’s feedback tool stands out from the competition thanks to its sentiment monitoring, easy implementation of NPS, translations, and more. It’s one of the most flexible and intuitive feedback tools on the market.
- AI-assistant in the survey tool: Hotjar packs an AI assistant that helps to come up with questions for surveys, which enables users to create them in no time.
- User testing: Hotjar’s Engage user testing tool is unique in the behavior analytics market. Having it as a part of the suite has some benefits, even though it comes at a separate price.
Cons:
- Can quickly get expensive: Hotjar’s pricing depends on the tools that you choose (feedback, surveys, and user testing come at their own price), the features that you want, and the amount of sessions you want to track. With more than 2.5k daily sessions Hotjar quickly becomes expensive, costing thousands of dollars per month. And that’s without surveys/feedback and user testing. Hotjar changed its pricing strategy not so long ago, to a wave of critique from users.
- Heatmaps aren’t automatically created: You need to manually set up heatmaps for the pages that you want to analyze.
- Daily data sampling: Depending on the plan, Hotjar only captures a certain amount of sessions per day. So, on peak days like Black Friday, Hotjar won’t give you a full picture of what’s happening on the website.
- Not very responsive support: G2 users complain about Hotjar’s customer support taking quite some time to respond, and about needing to raise the same problem with them several times.
- Website performance issues: Hotjar’s recording script is heavy and can slow down the tracked website, impacting core page vitals. There are several user complaints about this issue.
Hotjar Pricing
- Free plan: ✅
Hotjar offers a basic free plan with up to 35 daily sessions (not recordings) and no access to most tools. There are separate free plans for Ask (surveys and feedback) and Engage (user interviews).
- Pricing: if you want filtering, you can start with the Plus plan at $32/month, and if you’re looking for full access to every feature (except surveys and user testing that still come at a separate price), you’ll need a plan called Scale that starts at $171 per month for 500 daily sessions.
Hotjar Demo
Hotjar doesn’t provide an interactive demo anymore (even though it used to). Instead, they offer a video product tour that you can watch to get better acquainted with their product.
Our Verdict on Hotjar
Hotjar’s strongest sides are how famous it is (many people don’t even know that there are other players in the behavior analytics field), its great feedback and survey tools, and its user testing functionality. The main downsides are that both best features come with an additional price tag, and that Hotjar can slow down a website, impacting the very same UX it’s aimed at improving. Hotjar’s prices start low, but snowball to much higher values very quickly.
Explore a detailed comparison between Hotjar and Mouseflow.
Microsoft Clarity
Microsoft Clarity is a free user behavior analytics tool, designed to provide insights into how visitors interact with websites. It has gained popularity for its accessibility and Microsoft’s big, well-respected brand. Clarity is often perceived as an entry point into the world of behavior analytics.
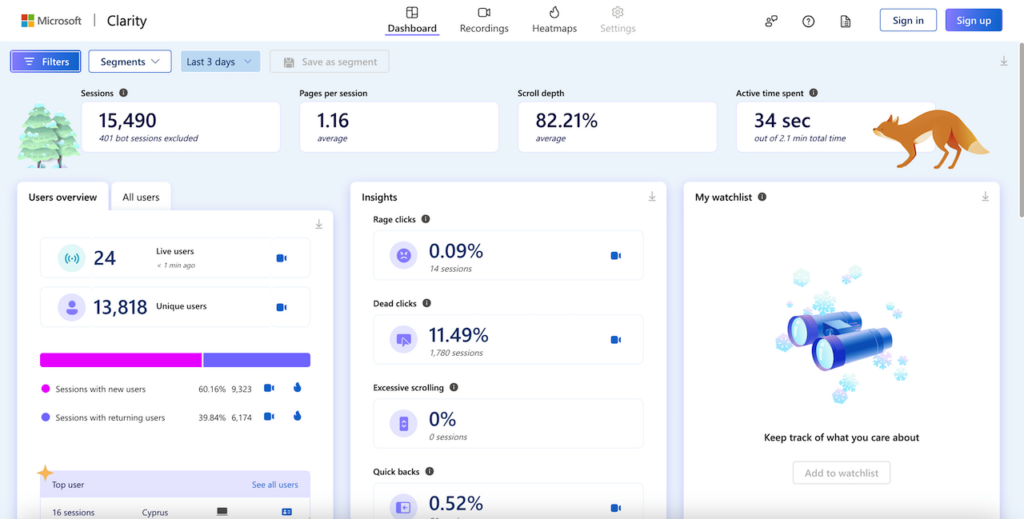
Microsoft Clarity screenshot. Source: Clarity Demo
What Tools Does Microsoft Clarity Offer?
- Session replay tool: Offers the capability to record and replay user sessions, showcasing user interactions, mouse movements, and navigation patterns.
- Heatmap tool: Clarity provides 3 types of heatmaps: click, scroll, and area heatmaps (with the latter being a different type of click heatmap).
- Funnels: Since June 2024, Microsoft added a funnels feature to Clarity, allowing users to build sequences of steps a user needs to go through before converting and track click-through-rates between these steps.
- CoPilot: an AI similar to OpenAI’s ChatGPT that helps distill insights from session recordings.
Microsoft Clarity Pros and Cons
Pros:
- Free of charge: Microsoft Clarity is completely free, making it accessible for businesses of any size.
- No sampling and limitations in data capture: Clarity is free, and it doesn’t provide a limit on captured sessions. Not all sessions are available for replay, though.
- Works with (some) mobile apps: Unlike many other tools, Microsoft Clarity can be used to analyze the behavior of mobile app users. But the spectrum of supported app frameworks at the time of writing includes only React Native, Android, Ionic, and Cordova.
- Compliance: According to Microsoft’s documentation, Clarity is compliant with GDPR and CCPA.
Cons:
- Only basic features: Clarity offers the basics – user session replay, heatmaps, and funnels – but doesn’t provide features that most other behavior analytics platforms have, including form analytics, user journey mapping, and user feedback surveys.
- Limited heatmap types: Compared to other tools, Clarity offers fewer types of heatmaps. It doesn’t have geo heatmaps, real-time heatmaps, movement, and attention heatmaps.
- Offers only random recordings for replay: Clarity doesn’t offer to replay every recording, picking them randomly.
- No real-time data processing: Some G2 users are complaining that recordings take a while to become available in Clarity’s interface. Also, Clarity only retains data for the last 30 days.
- Limited support: While Microsoft provides extensive documentation for Clarity, there’s no real-time support over chat, email, or any other means of communication.
- You are the product: Microsoft’s rationale behind Clarity’s $0 cost is that it collects the data from your website, and Microsoft may use it for its own purposes. As they say, when you don’t pay for the product, you’re the product.
Microsoft Clarity Pricing
- Free plan: ✅
Microsoft Clarity is entirely free, offering all its features at no cost.
- Pricing:
There is no paid plan; all features are included for free.
Microsoft Clarity Demo
There’s a live demo of Clarity available on Microsoft’s website.
Our Verdict on Microsoft Clarity
Clarity’s most prominent upside is very obvious – it’s free, and people like free things. The $0 price tag is also the reason why its functions are limited to only session replay and a few types of heatmaps.
Clarity may be a great starting point in someone’s behavior analytics’ journey, but as companies mature, they’ll likely outgrow Clarity and look for more advanced tools. It’s also worth noting that other tools have free plans as well, and for low-traffic websites they may be a better option. However, for bigger websites that aren’t willing to spend money on a heatmap and session recordings analytics tool but want to have these features, there are barely any alternatives to Clarity.
Explore a detailed comparison between Hotjar, Clarity, and Mouseflow.
VWO Insights
VWO Insights is a part of the VWO platform, a comprehensive suite for conversion rate optimization. VWO also offers an A/B testing tool, VWO Testing, but as a separate solution with a separate price tag. VWO Insights is a classic behavior analytics platform, focused on understanding user behavior through deep web analytics and feedback mechanisms. VWO caters to businesses of different sizes who want to purchase the whole suite for website optimization from one vendor.
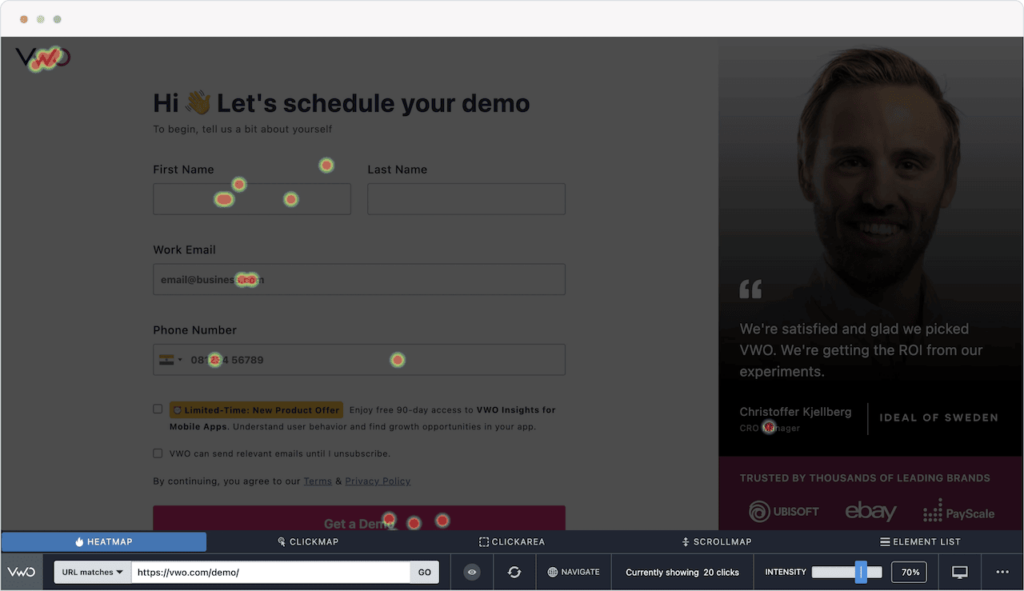
VWO Insights heatmap screenshot. Source: G2
What Tools Does VWO Insights Offer?
- Session replay tool: Records user interactions on a website, providing detailed insights into visitor behavior and experience.
- Heatmap tool: 3 heatmap options – visual representation of clicks, mouse movements, and scroll behavior to identify user engagement patterns on web pages.
- Form analytics: Analyzes user interactions with forms to identify potential drop-off points and areas for improvement.
- Conversion funnels: Tracks user journeys to identify where visitors are leaving and highlights opportunities for optimization.
- User feedback: Collects direct feedback from website visitors through surveys and feedback widgets.
VWO Insights Pros and Cons
Pros:
- Form analytics: VWO Insights is one of the few suites to offer form analytics. That’s a major plus for everybody who cares about leadgen and checkout optimization.
- Powerful user feedback survey feature: VWO offers a question bank to choose from when creating surveys, which helps speed up the process.
- Mobile app support: Recently, VWO insights added support for tracking user behavior in native Android and iOS mobile apps. Frameworks like Flutter and React Native are not supported at the time of writing, but VWO promises to add support soon.
- Compliance: According to VWO, VWO Insights adheres to major data privacy and protection regulations, including GDPR, CCPA, and PCI DSS.
Cons:
- Higher cost: VWO Insights is generally more expensive compared to many other analytics tools, which might be a barrier for smaller businesses.
- Limited heatmap types: VWO does not offer as many heatmap variations as some specialized heatmap tools. Scroll and dynamic heatmaps are only available on higher-price plans (Pro and Enterprise, starting at $373 per month).
- Limited features on cheaper plans: While overall VWO Insights offers a good selection of features, only a part of this selection is available for users on lower tier plans.
- No friction score insights: VWO Insights doesn’t offer a feature that would assess the quality of user experience and compare it to industry standards.
- Data sampling: VWO Insights samples user data, which means not all users’ sessions will be captured, not all users will see feedback prompts, etc.
VWO Insights Pricing and Compliance
- Free Plan: ✅
VWO Insights offers a free plan with 5,000 monthly tracked users that offers basic features and 7 days of data storage.
- Pricing:
Paid plans for VWO Insights start at $158 per month for 10,000 monthly tracked users, 1 month of data storage, and limited features. VWO Insights price depends on 2 variables: the number of monthly tracked users and the plan, with more expensive plans offering more features. Enterprise plan that packs all features starts at $882 per month.
VWO Insights demo
VWO doesn’t offer an interactive demo for VWO insights.
Our Verdict on VWO Insights
VWO Insights’s stronger side is being a part of a comprehensive website optimization suite and having good integrations with other tools that VWO offers. The recently added mobile app support also helps it stand out. Its main downside is that lower-tier plans are very limited in terms of features. Overall, VWO Insights is on the more expensive side of the spectrum.
Explore a detailed comparison between VWO and Mouseflow.
Smartlook
Smartlook, which recently became a part of Cisco, is a qualitative analytics platform designed for both websites and mobile apps. Smartlook offers an array of features that help businesses understand how users interact with their platforms. It’s suitable for a wide range of users, from small startups to large enterprises, looking to gain a better understanding of their user experience.
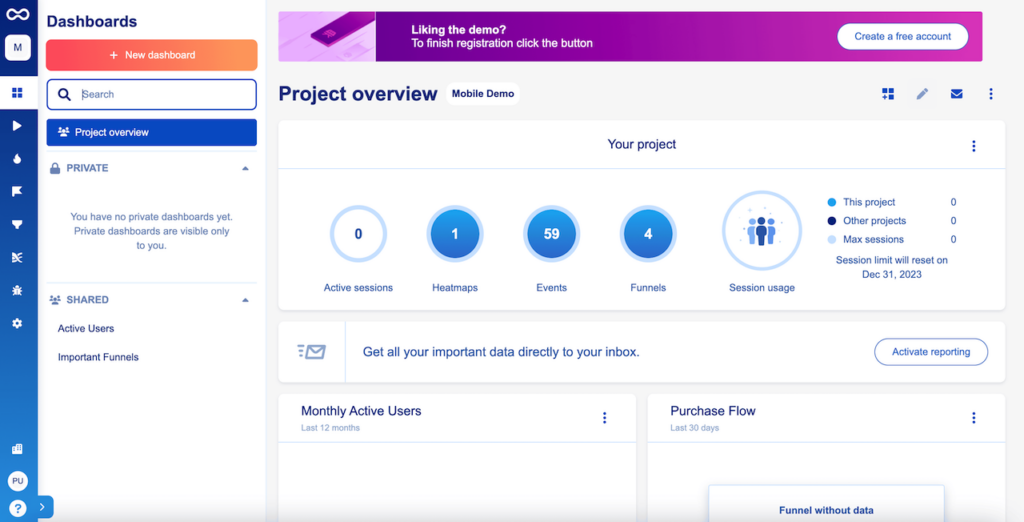
Smartlook dashboard screenshot. Source: Smartlook demo
What Tools Does Smartlook Offer?
- Session replay tool: Smartlook offers high-quality recordings of user sessions, including every click and scroll.
- Heatmap tool: Provides 3 types of heatmaps – click, move, and scroll – giving insights into the most interacted areas of a web page or app. The number of heatmaps that you can create is limited and defined by your plan.
- Event tracking and analysis: Automatically records significant user actions for detailed behavior analysis.
- Funnel analysis: Analyzes where users drop off in the navigation or conversion process.
- User flows: Smartlook can generate a Sankey diagram with paths that users take from a certain page. This feature is very useful when it comes to mapping user journeys on the website.
- Crash reports: An invaluable tool for mobile app analytics, Smartlook offers crash reports.
Smartlook Pros and Cons
Pros:
- Unified tracking between website and mobile apps: Unlike many other tools, Smartlook works not only with websites but also with mobile apps. And unlike Microsoft Clarity, it’s compatible with native apps and most popular cross-platform frameworks, including React Native and Flutter.
- Retroactive data analysis: Allows users to generate heatmaps and track events retroactively. Once you create a heatmap or build a funnel, Smartlook immediately populates it with data that it had since it started tracking.
- User flows: Smartlook is one of the few behavior analytics suites that offers user flows.
- Clean UI: Smartlook is a modern platform with a modern look and feel.
Cons:
- Pricing for advanced features: Higher-tier plans, especially those catering to larger businesses or more extensive data needs, can be expensive.
- Limited types of heatmaps: Smartlook offers basic heatmap types but lacks the diversity of some specialized heatmap tools: attention heatmaps and live heatmaps are not available in Smartlook.
- No friction score: Lacks advanced UX analysis features like friction score, which can identify user experience issues more precisely.
Smartlook Pricing
- Free plan: ✅
Smartlook offers a basic free plan with limited features, suitable for individuals just starting with behavior analytics.
- Paid plans: Pricing starts at around $55 for 5,000 monthly sessions (if billed annually) and goes all the way to $639 per month for 200,000 sessions. There are custom enterprise plans if you need more sessions or advanced features like using an API.
Smartlook Demo
Smartlook offers an interactive demo for prospective users to explore its features.
Our Verdict on Smartlook
Smartlook is young and rapidly evolving. Its stronger sides are mobile app analytics and good UI. It’s not as feature-rich as some other providers though, lacking some heatmaps and features such as form analytics and friction score, but trying to compensate for it with user journey mapping. Smartlook’s pricing is reasonable – it’s well suited for small businesses.
Explore a detailed comparison between Smartlook and Mouseflow.
Crazy Egg
Crazy Egg is a website optimization suite and a real dinosaur of this market – it was founded in 2006 by Neil Patel. It’s one of the pioneers in the behavior analytics and heatmapping space. CrazyEgg aims to help businesses of all sizes understand visitor interaction with their websites. What makes it stand out from the crowd is that it offers a basic A/B testing tool at no additional cost on all plans, even on the cheapest one.
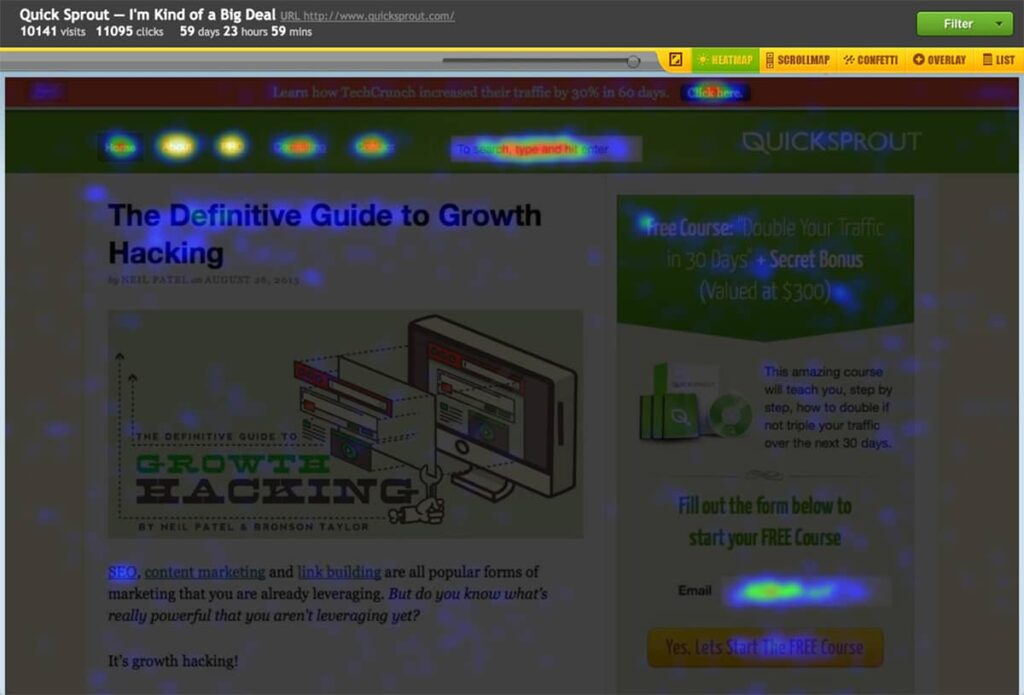
Crazy Egg heatmap screenshot. Source: Crazy Egg documentation
What Tools Does Crazy Egg Offer?
- Heatmap tool (Snapshots): In addition to the classic click heatmap and scroll heatmap, CrazyEgg provides a confetti map with individual clicks. It doesn’t offer live heatmaps or movement heatmaps though. In CrazyEgg, heatmaps are a part of a feature called Snapshots, which also offers traditional, spreadsheet-like reports.
- Session replay tool: Records individual user sessions, showing mouse movements, clicks, and navigation.
- Confetti tool: That’s CrazyEgg’s name for a heatmap with individual clicks. You can apply segments to it to filter out traffic from a certain referral source or device type.
- Overlay tool: That’s another type of click heatmap that provides a detailed breakdown of how many clicks each page element receives in percentage points.
- Surveys tool: Like most modern behavior analytics platforms, CrazyEgg offers a user survey tool that allows you to collect feedback from website visitors.
- A/B testing tool: CrazyEgg offers an easy-to-use platform for comparing different versions of a webpage to see which one performs better.
Crazy Egg Pros and Cons
Pros:
- Non-standard click analytics: The Confetti and Overlay tools provide insights into individual user clicks and percentages of clicks that different elements attract. You can get the same data from other tools too, but CrazyEgg offers it in a visual format.
- Integrated A/B testing: CrazyEgg integrates A/B testing directly into its platform, simplifying experimenting.
- Competitive pricing: CrazyEgg is cheaper than most tools on the market if you compare yearly spending. Especially if you consider that it has an A/B testing tool built in.
Cons:
- Limited heatmap types: Compared to most other heatmap tools, Crazy Egg offers fewer heatmap variations.
- Problems working with dynamic websites: Because of the lack of real time heatmaps, CrazyEgg is not well-suited for analysis of dynamic websites.
- Need to set up snapshots: CrazyEgg won’t automatically generate snapshots – you need to set up generating them manually, and, according to this user’s review, it takes about a week to generate one.
- Lack of features: CrazyEgg does not provide features like form analytics, funnels, or friction score, which are available in more comprehensive analytics tools.
- Problems with exporting data: Some G2 users complain about the fact that CrazyEgg doesn’t offer the option to export most reports as CSV sheets. The only report it allows you to export this way is their list report.
- No monthly billing: While CrazyEgg displays monthly prices, it in fact, doesn’t offer the option to pay monthly. After the trial is over, it’ll charge you for the whole year. There are some Capterra reviews from users that are unhappy about that.
Crazy Egg Pricing
- Free plan: ⛔
Crazy Egg doesn’t offer a free plan anymore (it used to a while ago). Instead, it offers a 30-day free trial with access to all features on all plans. It requires a credit card – and CrazyEgg will charge you for the whole year of using the plan you’ve chosen after your trial ends.
- Pricing: CrazyEgg offers 3 plans starting at $49 per month (billed annually) for the most basic Standard plan with 500 monthly recordings and goes all the way to $249 per month (billed annually) for the Enterprise plan.
Crazy Egg Demo
Crazy Egg doesn’t offer an interactive demo of their product. You can request a personalized demo using their website.
Our Verdict on Crazy Egg
Crazy Egg’s strongest side is packing an A/B testing tool in the suite at an affordable price. The behavior analytics part of Crazy Egg’s offering is not so strong as what other tools can provide. The heatmap types are limited, there’s no friction score, form analytics, or funnels. Crazy Egg could be a great choice for scrappy teams that need only the basic functionality for a reasonable price. But these teams should prepare to pay for the whole year after the trial ends.
Explore a detailed comparison between CrazyEgg and Mouseflow.
FullStory
FullStory is a digital intelligence tool that specializes in analytics and user experience optimization. Founded in 2014, it caters to larger businesses looking to gain in-depth insights into how users interact with their websites and mobile apps. FullStory offers a broad set of tools that product managers, marketers, and UX designers use for different purposes.
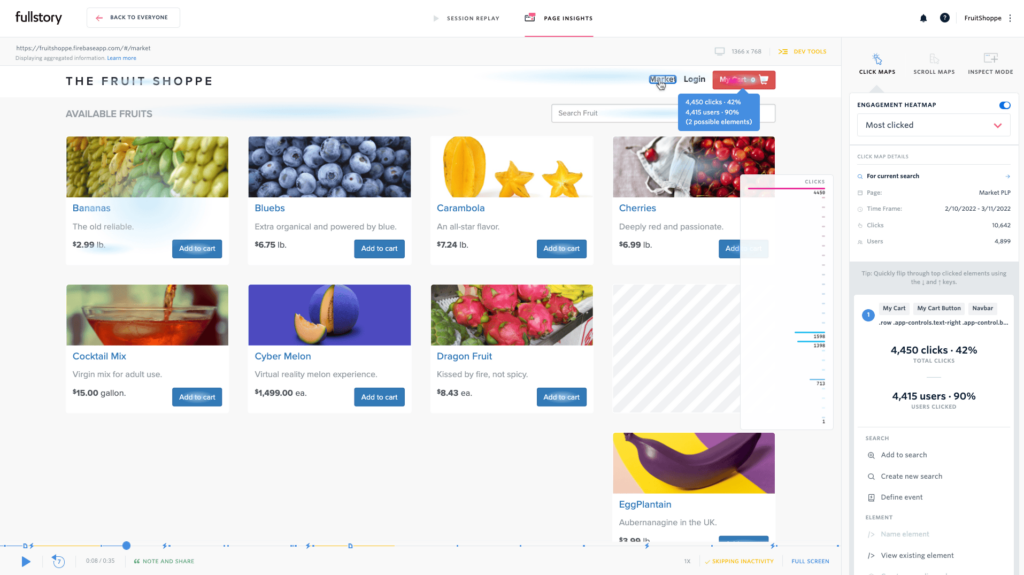
Fullstory heatmap screenshot. Source: G2
What Tools Does FullStory Offer?
- Session replay tool: Captures high-definition recordings of user sessions, showing every interaction in detail.
- Heatmap tool: Fullstory offers a broad selection of heatmaps. In addition to the usual click, scroll, and movement heatmaps, it also has eye tracking (aka attention) heatmap, and separate heatmaps with errors, dead clicks, and rage clicks. Most other tools don’t offer the latter three, instead choosing to display this information on click heatmaps.
- Frustration signals detection: Identifies user frustration through signals like rage clicks, error clicks, and dead clicks.
- Conversion funnels: Tracks user journey through the site to uncover where and why users drop off.
- Omnisearch feature: Since FullStory has a lot of features, they’ve implemented a search option to find whatever you’re looking for.
- Advanced segmentation and analytics: Offers detailed segmentation for targeted analysis of user behavior.
- User journeys: Tracks custom-defined user paths to analyze specific behaviors or workflows.
FullStory Pros and Cons
Pros:
- Flexible dashboards: FullStory allows you to build dashboards that can show trends, metrics, and more. The dashboards are very visual and highly customizable as well. What’s more, FullStory offers a Metrics tool to create your own metrics that you can then use on dashboards.
- Advanced filtering, segmenting, and search: FullStory allows you to filter and segment sessions by a lot of different things or events.
- A good selection of friction events: FullStory tracks different user friction events, including JavaScript errors, click rages, dead clicks, and custom events.
- Compliance with data privacy regulations: FullStory is compliant with GDPR and CCPA. It also has a whole page discussing security features.
- Omnisearch: That feature is unique to FullStory. It comes in very handy when a lot of users are building a lot of funnels, reports, etc.
- User journey mapping: FullStory offers user journey mapping, which is not yet a common feature for behavior analytics providers.
- Clean UI with highlighting insights: FullStory’s UI is different from what other behavior analytics suites offer. However, it’s clean, looks good, and helps quickly get important insights.
Cons:
- Steep learning curve: Fullstory offers a lot of options and detail, and it may be hard to get started as a result. Some reviewers on G2 mention that even the most basic things take several steps. Also, you’ll need to set up a lot of things – FullStory is very flexible and can be customized to cater to very different needs, but doesn’t offer much out of the box.
- Premium pricing: FullStory’s extensive features come at a higher cost, making it a significant investment. It’s more expensive than most tools on the market, and not well-suited for smaller businesses, as there’s no option to pay with a credit card.
- Problems with app tracking: Some G2 users highlight that FullStory is great for web, but not as good for apps.
- Can be slow: Some Capterra users notice that the interface can be slow, and also it takes some time to start capturing live sessions.
FullStory Pricing
- Free Plan: ✅
FullStory offers a free plan with basic features. The plan is limited to 10k sessions (not recordings) and offers a year of data storage.
- Pricing: FullStory doesn’t offer their plans at fixed prices – you’ll need to contact them if you want to use their services beyond the basic plan. The cheapest plan is called Business, and it offers limited features, lacking conversion funnels, retention analysis, and some other. The highest tier that offers all features is Enterprise.
FullStory Demo
FullStory doesn’t provide an interactive demo on their website. However, it offers on-demand training courses and sessions to educate users about the platform’s capabilities.
Our Verdict on FullStory
FullStory’s stronger side is how flexible the tool is. There’s a lot of things you can customize in FullStory to make it serve your specific needs. That’s also the downside of the tool, because a lot of things that are easy to do in other tools require some time to set up in FullStory. Another downside is the inability to pay with a credit card, and the overall expensiveness of the tool. Finally, most cool features that FullStory packs are only available on the more expensive plans.
Explore a detailed comparison between FullStory and Mouseflow.
Contentsquare
Contentsquare is a customer experience analytics platform aimed primarily at enterprises. It originated from France, where it was founded back in 2012.
Contentsquare as a company is interesting because it owns two other major players in the field – Hotjar and Heap, which remain as separate platforms. At some point Contentsquare also acquired yet another behavior analytics software, Clicktale, that was then merged with the Contentsquare platform.
Partially thanks to mergers and acquisitions, Contentsquare offers a wide variety of features, some of which other platforms don’t have. But they come with a hefty price tag.
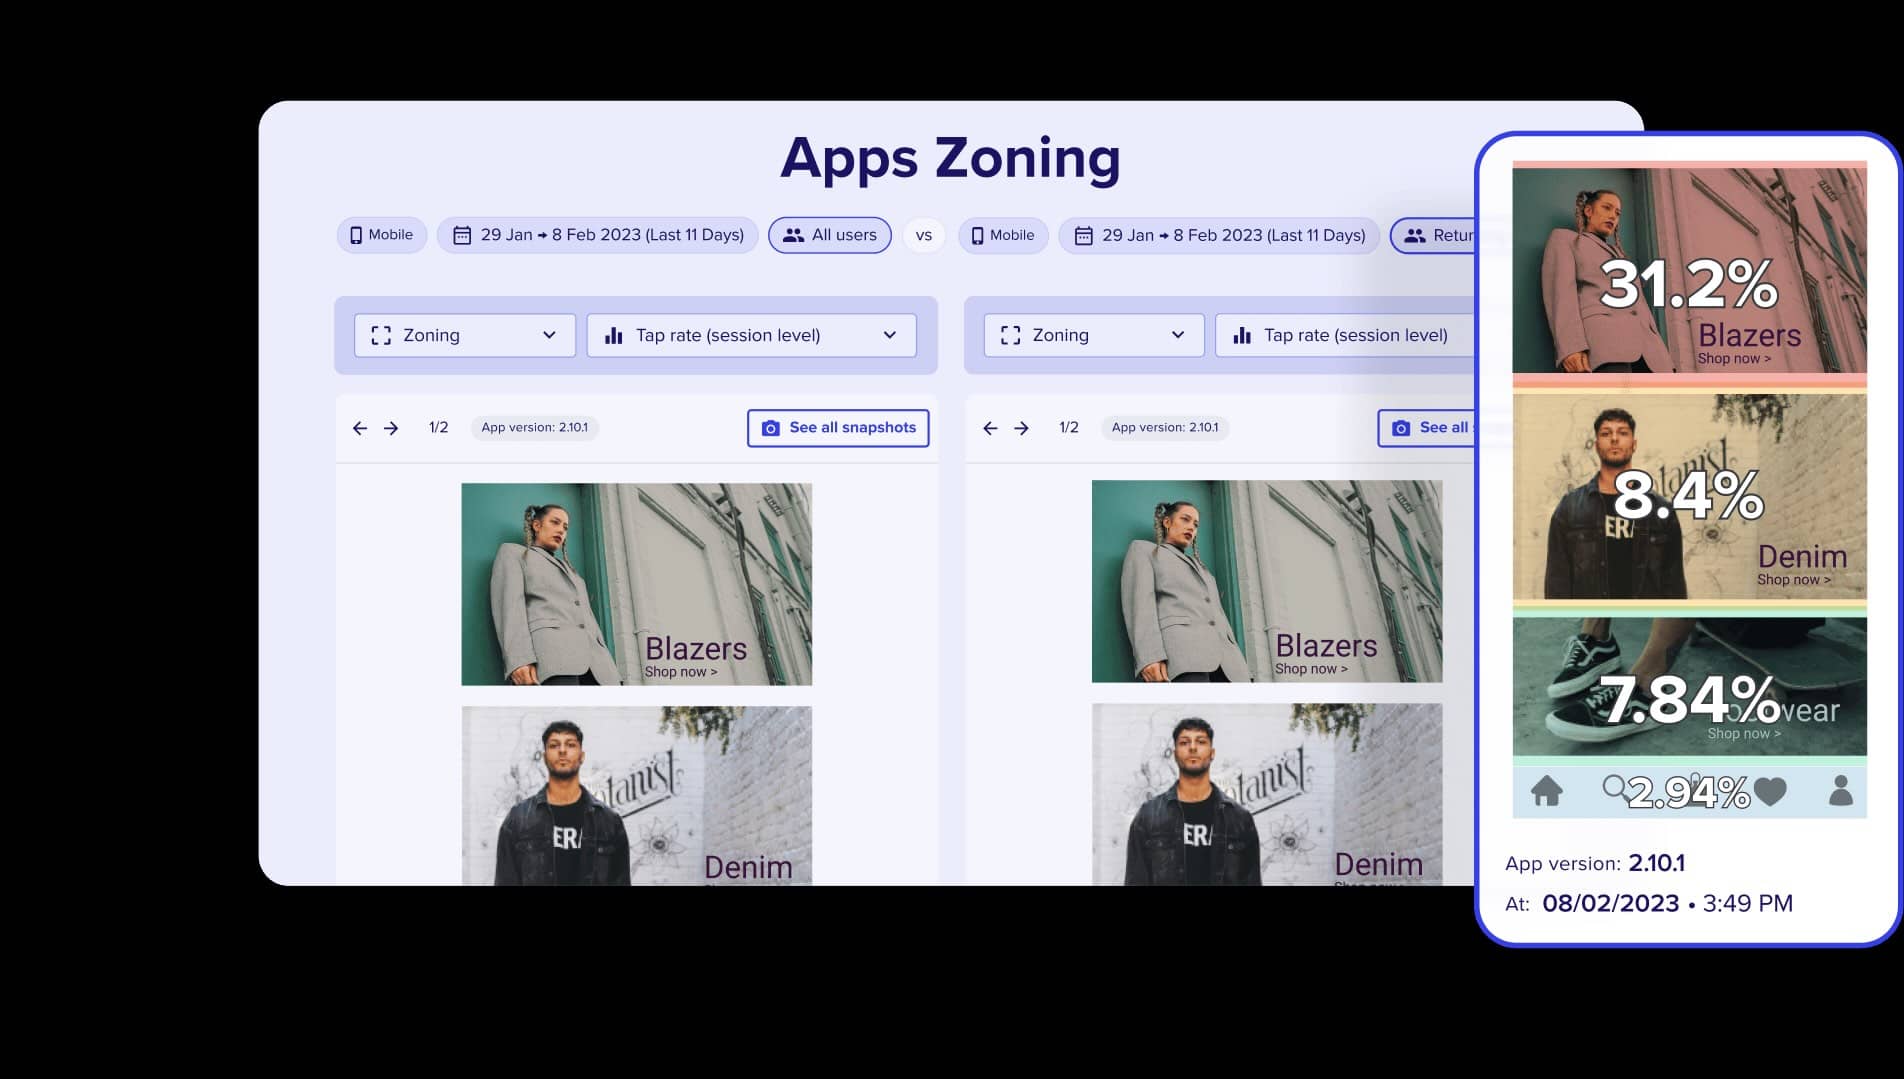
Source: Contentsquare. Note that this is not an actual screenshot, but rather a modified image for press
What Tools Does Contentsquare Offer
- Heatmap tool: In addition to the usual suspects – click, scroll, and movement heatmaps – Contentsquare offers zone-based heatmaps. Live heatmaps are on the menu as well.
- Session replay tool: Contentsquare offers the ability to watch individual user sessions
- Journeys: Contentsquare allows to analyze user journeys, providing sunburst diagrams that illustrate where users go next from a certain point. Unlike Sankey diagrams, sunburst diagrams can’t show where the visitors came from. But some find sunburst diagrams easier to read.
- Frustration scoring: With event tracking, Contentsquare offers frustration score for pages coupled with AI-generated insights
- Speed analysis: Contentsquare can give you the Core Web Vitals data for website pages.
- Error tracking: Contentsquare allows the detection of technical errors during sessions and even offers a graph showing how the percentage of sessions with errors changes over time.
Contentsquare Pros and Cons
Pros:
- No sampling: Contentsquare offers to collect 100% of website traffic. Of course, it’s impossible to track some users, but still, it’s what the more advanced platforms like Mouseflow or Glassbox offer.
- Works with mobile apps: Contentsquare offers mobile app analytics and supports native Android and iOS applications as well as major multiplatform frameworks like React Native or Flutter.
- Journeys: Not all behavior analytics tools have them, but Contentsquare does.
- Good support and education: Contentsquare provides dedicated support specialists and offers training that customers praise.
Cons:
- Learning curve: Some users find it difficult to use Contentsquare if you’re not well-versed in different modules.
- Subjective insights: Some of the insights that Contentsquare provides can be subjective and misleading, according to a G2 review.
- Upselling tactics: Contentsquare isn’t cheap to start with, and some users were upset to discover that some of the features they expected to be included in the package were sold at an additional cost. For example, Contentsquare only offers 3 months of data storage, with an additional 9 months that can be purchased separately.
- Expensive. Contentsquare costs much more than most other behavior analytics tools.
Contentsquare Pricing
- Free plan: ❌Contentsquare doesn’t offer a free plan or even a self-serve free trial.
- Pricing: Contentsquare doesn’t have any self-serve options, so its pricing isn’t transparent. The only option visitors have is to contact sales representatives and talk to them to learn how much the tool will cost them.So, to discuss pricing, we’ll need to rely on 3rd party information as well as insights from our prospects and customers. Vendr lists $24,000 as the lowest amount one can pay for a year of using Contentsquare. The average is much higher, sitting between $40,000-70,000 per year.
Contentsquare Demo
Contentsquare doesn’t offer a free trial or an interactive demo. But you can get a 6-minute demo video or contact Contentsquare and talk to sales representatives, getting a personalized demo.
Our Verdict on Contentsquare
Contentsquare offers a combination of quality standard tools and some unique features that other platforms do not have. That puts it among the top players in the field when it comes to functionality.
The downside is that it comes at a steep price that rises even higher if you want to get more features. Basically, Contentsquare’s pricing (and the lack of self-serve options) prohibits small and medium sized companies from using it. And for larger ones, despite the tool’s great capabilities, the ROI would likely be lower compared to some alternatives – again, because of how expensive the platform is.
Explore a detailed comparison between Contentsquare and Mouseflow
Glassbox
Glassbox is a digital experience analytics platform that aims to create frictionless digital journeys for its customers’ customers. It originated from Israel and was called Clarisite before a rebranding in 2016.
In 2020, Glassbox acquired one of its competitors – SessionCam, which was absorbed into the Glassbox platform. Glassbox serves only enterprise customers and primarily focuses on the finance industry.
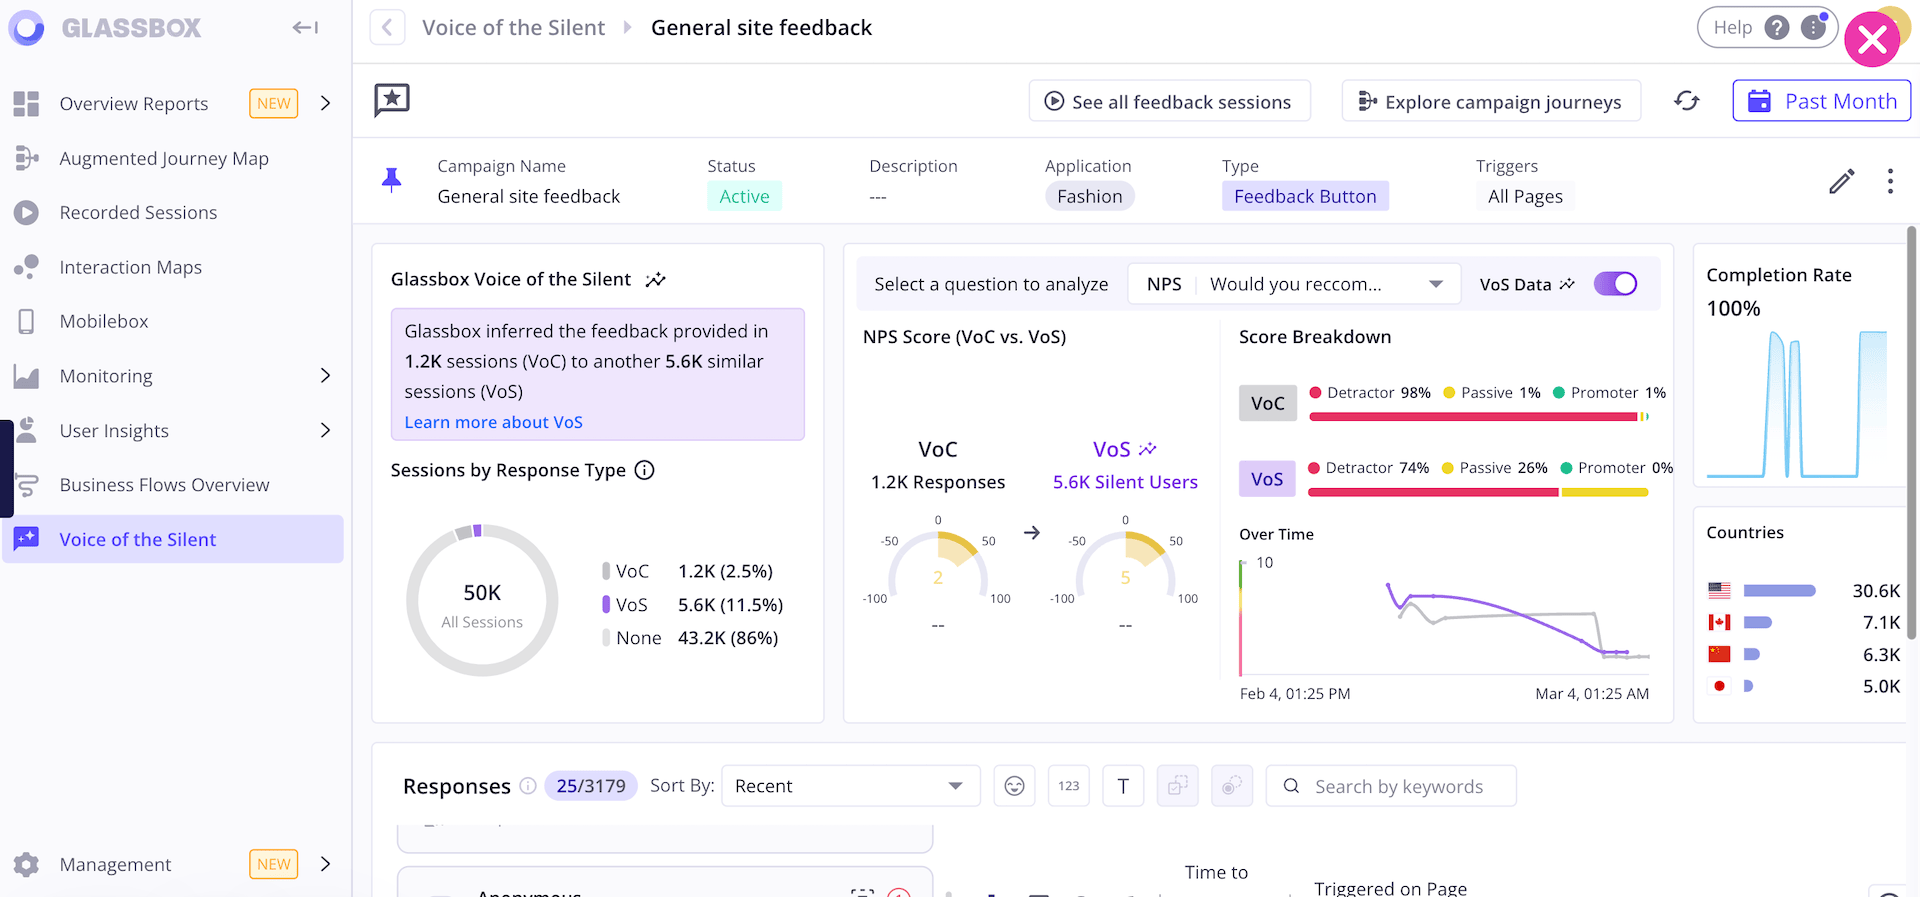
Source: Glassbox guided product tour
What Tools Does Glassbox Offer
- Session replay. Glassbox can replay user sessions with all user events, offering insights into how users really use your website or app.
- Interaction Maps. Instead of offering different types of heatmaps, Glassbox provides just one. They call it an “interaction map,” and it incorporates data usually found on scroll and zoning heatmaps.
- User Journey Mapping. Glassbox builds the classic Sankey diagrams, providing insights into the users’ journey across a site or a mobile app.
- Struggle Score. A proprietary score to estimate user friction.
- Conversion Analysis. Glassbox allows you to build conversion funnels and analyze their efficiency.
- Voices of the Silent. Glassbox has a fancy name for its user feedback tool that is combined with analyzing sessions of those who didn’t leave feedback, but had a similar experience to those who did.
Glassbox Pros and Cons
Pros:
- Mobile apps analytics. Glassbox can track users across both websites and mobile apps, supporting native apps and popular multiplatform frameworks like Flutter and React Native.
- AI Assistant. Glassbox’s GIA is an AI assistant which understands prompts in human language and condenses fields of data into insights.
- Journeys. If a behavior analytics platform has this feature, we list it among the pros. Glassbox does, and it offers all the necessary functionality.
- Highly customizable reports and dashboards. Customers love Glassbox’s reports and dashboards, mostly for their flexibility. Some, however, dislike them for the same reason.
Cons:
- Very expensive. Glassbox’s pricing isn’t transparent, but they sell their services on the Amazon marketplace, which requires putting a price tag. According to it, Glassbox starts at $50,000 per year for 50,000 monthly sessions.
- Can be slow. Some users complain that the platform is not responsive.
- No form analytics. At such a steep price, Glassbox doesn’t offer a form analysis tool.
Glassbox Pricing
- Free plan: ❌
Glassbox doesn’t offer a free plan or a free trial. - Pricing:Glassbox doesn’t have a pricing page, and their pricing is not transparent. The only source that allows us to give an estimate is the aforementioned Amazon marketplace page, with $50,000 per year for 50,000 monthly sessions or $75,000 per year for 100,000 sessions.
Glassbox Demo
- While there’s no free trial, Glassbox offers several guided product tours. And of course, you can book a personalized demo with a sales representative.
Our Verdict on Glassbox
Glassbox is a powerful digital experience analytics platform. Its main strengths are a broad set of tools, AI-generated insights, and the ability to support mobile apps. But Glassbox lacks form analytics, and its interaction maps don’t provide as much data as other platforms’ heatmaps of different types. Also, there are many Glassbox alternatives that are much less expensive.
LogRocket
LogRocket calls itself an “AI-first session replay and analytics that shows you what’s wrong”. Indeed, its main function is session replay, with a huge focus on error tracking and issue detection with some help from AI. While most of the tools on the list are geared towards marketers, LogRocket’s primary audience is web developers.
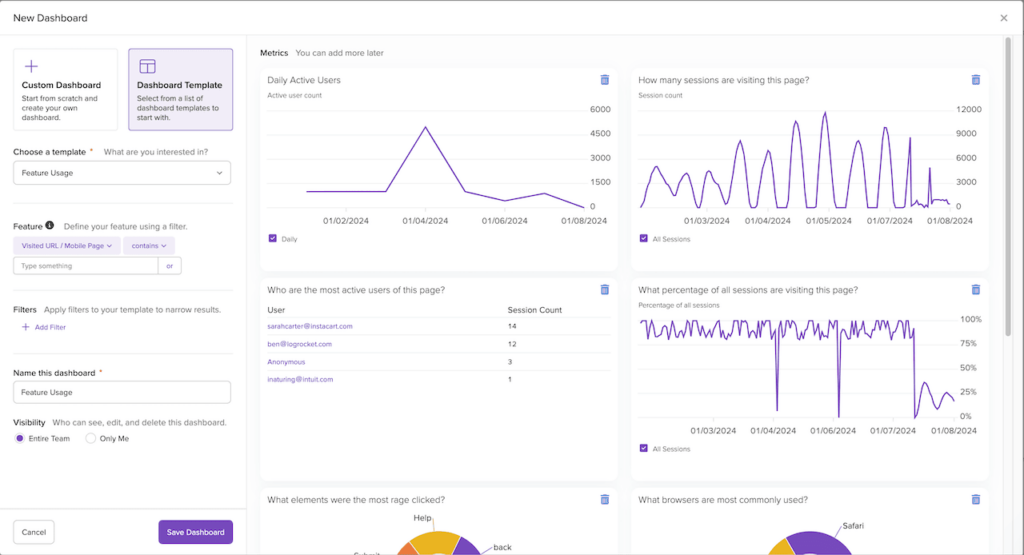
source: LogRocket documentation
What Tools Does LogRocket Offer?
- Session Replay: LogRocket records user sessions by capturing DOM and user events and then reconstructing the web page and the user behavior. For developers, that means that when they see users struggling with an element on the website, they can immediately get the HTML code of the element and analyze it.
- Heatmaps: LogRocket offers 4 types of heatmaps: movement heatmaps (hovermaps), clickmaps, scrollmaps, and a unique type called conversion rate heatmaps. The latter is a correlation of clicks on a specific element on the page with achieving a certain goal (like a page visit or click). LogRocket doesn’t proactively create any heatmaps, you need to build them for each page individually. Also, heatmaps are only available on Professional or Enterprise plans, don’t expect to find them on Free and Team plans.
- Funnels: The funnel feature is pretty standard – LogRocket allows you to create conversion funnels, tracking conversion rates between pages. The interesting option here is that you can choose between types of funnels – ordered or unordered. In the former case, the sequence in which the user goes through the steps matters; in the latter, it doesn’t. Like heatmaps, funnels are only available on Professional or Enterprise plans.
- Path Analysis: LogRocket can draw Sankey diagrams, showing how users progress from a certain point to other pages, and where they go further, outlining the different user journeys across the website. Just like heatmaps and funnels, the path analysis feature is also only for Professional or Enterprise plan users.
- Error Tracking & Frontend Performance Monitoring: LogRocket is made primarily for frontend developers, so it has extensive functionality to help them catch errors and monitor frontend performance. That includes core web vitals tracking, stack traces, catching JavaScript and network errors, and more.
- Galileo AI: LogRocket’s AI helps in several different areas – from issue reporting to predicting the severity of impact some website issues may cause.
LogRocket Pros and Cons
Pros:
- Mobile analytics: LogRocket is capable of tracking and recording not only websites and web apps, but also mobile apps, including native ones.
- Detailed session replay: While some session replay vendors offer low-resolution replays, LogRocket recreates the replay in full resolution with all the DOM structure and the events.
- AI: LogRocket found good use for AI – its Galileo AI feature helps with getting additional data on issues and producing severity scores for each of them.
- Additional capabilities for frontend engineers: LogRocket has additional features like providing stack traces and console logs that could be helpful for developers.
Cons:
- Glitches in session replays: On G2, multiple LogRocket users have complained about session replays not working properly – getting blank screens instead of user sessions, not seeing the entire application on the recording, or about session replay simply not working for some of the users.
- No form analytics: LogRocket doesn’t have a form analytics tool, but it’s not a surprise – developers are not really interested in lead generation or checkout optimization. For this reason, it’s not exactly correct to list it among the drawbacks, but that’s where we’ve listed it for others, so we’re adding it here as well.
- Feedback available only on Enterprise plan: LogRocket has a feedback feature, but a very basic one, and it’s only available on the Enterprise plan, which means most of its customers never get to use it.
- Free and Team plans don’t provide much value: Free and Team plans have the same functionality and are only different in the number of sessions that they cover. But most tools – heatmaps, conversion funnels, path analysis, AI, and more – are unavailable on these plans.
- Professional plan is expensive: The Professional plan has almost all features, but it comes with a hefty price tag. Also, LogRocket is quite aggressive with upselling the users on the Free and Team plans, trying to make them switch to the Professional plan. Some G2 users found it annoying.
LogRocket Pricing
- Free plan: ✅
LogRocket offers a free tier with 1,000 sessions per month and 1 month of data retention. But it lacks heatmaps, conversion funnels, path analysis, dashboards, tracking rage clicks and dead clicks, and all AI features. LogRocket’s free tier is a very limited session replay software with a touch of error tracking, not a full-fledged behavior analytics platform. - Pricing:
Paid plans start at $69/month for 10,000 sessions for the Team tier, but at this price, you also get the same limitations as on Free plan. The plan with almost all features – Professional – starts at $295/month for the same 10,000 sessions.
LogRocket Demo
Theoretically, LogRocket offers a demo instance for those who want to try before they buy. Practically though, we couldn’t get it to work because of some server errors that kept happening on their side.
Our Verdict on LogRocket
LogRocket is a rare example of powerful session replay software that’s not geared primarily towards marketers and CRO professionals. Its primary audiences are web and mobile developers. For them, in addition to session replay and other usual features, LogRocket offers advanced error and performance tracking, console logs, and more. Product analytics is another use case where LogRocket is one of the stronger tools on our list.
For marketers, UX and CRO specialists, the lack of feedback and form analytics tools make it less interesting. And for small businesses with budget restrictions, LogRocket also isn’t the best session replay software because most of its features are only available on a relatively expensive Professional plan, including some that affect the usability of the session recordings themselves.
Which Heatmap and Session Replay Tool is The Best for You
Mouseflow is one of the leaders in session replay and heatmaps (according to both G2, Capterra, and almost every other comparison platform), so we (as Mouseflow editorial team) would obviously be biased if we were to choose one tool. Here, we’re trying to be objective and evaluate each tool’s pros and cons. So, instead, we leave the choice to you – and hope that our guide on the best heatmap and session replay software helped at least a little.
There are many more other heatmap and session replay software vendors such as Inspectlet, Logrocket, Plerdy, Amplitude, Lucky Orange, and more. For this guide, we chose the ones that we thought were the best in at least some aspect – be it having the widest choice of heatmaps (like what Mouseflow offers), offering form analytics (like Mouseflow and VWO) or built-in A/B-testing (as CrazyEgg has). Or being completely free (like Clarity), or offering some magic around the data layer that data scientists love so much (that’s what FullStory has to offer).
Best of luck in choosing the best heatmap and session replay tool that is right for you!
Changelog
July 2024: added LogRocket
June 2024: Clarity introduced Funnels
May 2024: added Contentsqaure and Glassbox
